Posts from December 2018 (13)

December 31, 2018

Rugby Premiership Predictions for Round 12

Team Ratings for Round 12

The basic method is described on my Department home page.
Here are the team ratings prior to this week’s games, along with the ratings at the start of the season.

Current Rating Rating at Season Start Difference
Exeter Chiefs 11.49 11.13 0.40
Saracens 11.43 11.19 0.20
Northampton Saints 4.03 3.42 0.60
Wasps 3.28 8.30 -5.00
Gloucester Rugby 3.05 1.23 1.80
Leicester Tigers 2.67 6.26 -3.60
Harlequins 2.17 2.05 0.10
Bath Rugby 2.00 3.11 -1.10
Sale Sharks 1.47 -0.81 2.30
Worcester Warriors -2.83 -5.18 2.30
Newcastle Falcons -2.94 -3.51 0.60
Bristol -4.23 -5.60 1.40


Performance So Far

So far there have been 66 matches played, 48 of which were correctly predicted, a success rate of 72.7%.
Here are the predictions for last week’s games.

Game Date Score Prediction Correct
1 Northampton Saints vs. Exeter Chiefs Dec 28 31 – 28 -3.10 FALSE
2 Gloucester Rugby vs. Sale Sharks Dec 29 15 – 30 9.00 FALSE
3 Harlequins vs. Wasps Dec 29 20 – 13 3.80 TRUE
4 Saracens vs. Worcester Warriors Dec 29 25 – 17 21.00 TRUE
5 Bath Rugby vs. Leicester Tigers Dec 30 23 – 16 4.40 TRUE
6 Bristol vs. Newcastle Falcons Dec 30 35 – 28 3.60 TRUE


Predictions for Round 12

Here are the predictions for Round 12. The prediction is my estimated expected points difference with a positive margin being a win to the home team, and a negative margin a win to the away team.

Game Date Winner Prediction
1 Sale Sharks vs. Saracens Jan 04 Saracens -4.50
2 Exeter Chiefs vs. Bristol Jan 05 Exeter Chiefs 21.20
3 Leicester Tigers vs. Gloucester Rugby Jan 05 Leicester Tigers 5.10
4 Newcastle Falcons vs. Harlequins Jan 05 Newcastle Falcons 0.40
5 Worcester Warriors vs. Bath Rugby Jan 05 Worcester Warriors 0.70
6 Wasps vs. Northampton Saints Jan 06 Wasps 4.80


Pro14 Predictions for Round 13

Team Ratings for Round 13

The basic method is described on my Department home page.
Here are the team ratings prior to this week’s games, along with the ratings at the start of the season.

Current Rating Rating at Season Start Difference
Leinster 12.43 9.80 2.60
Munster 10.08 8.08 2.00
Glasgow Warriors 8.20 8.55 -0.30
Scarlets 3.53 6.39 -2.90
Connacht 2.92 0.01 2.90
Cardiff Blues 1.12 0.24 0.90
Ulster 0.59 2.07 -1.50
Ospreys 0.45 -0.86 1.30
Edinburgh -0.22 -0.64 0.40
Cheetahs -2.93 -0.83 -2.10
Treviso -3.89 -5.19 1.30
Dragons -9.26 -8.59 -0.70
Southern Kings -9.63 -7.91 -1.70
Zebre -12.85 -10.57 -2.30


Performance So Far

So far there have been 82 matches played, 64 of which were correctly predicted, a success rate of 78%.
Here are the predictions for last week’s games.

Game Date Score Prediction Correct
1 Connacht vs. Ulster Dec 29 21 – 12 6.40 TRUE
2 Treviso vs. Zebre Dec 30 28 – 10 12.60 TRUE
3 Glasgow Warriors vs. Edinburgh Dec 30 8 – 16 14.60 FALSE
4 Munster vs. Leinster Dec 30 26 – 17 0.80 TRUE
5 Scarlets vs. Cardiff Blues Dec 30 5 – 34 9.40 FALSE
6 Dragons vs. Ospreys Dec 31 23 – 22 -6.40 FALSE


Predictions for Round 13

Here are the predictions for Round 13. The prediction is my estimated expected points difference with a positive margin being a win to the home team, and a negative margin a win to the away team.

Game Date Winner Prediction
1 Ospreys vs. Cardiff Blues Jan 05 Ospreys 3.80
2 Treviso vs. Glasgow Warriors Jan 06 Glasgow Warriors -7.60
3 Leinster vs. Ulster Jan 06 Leinster 16.30
4 Scarlets vs. Dragons Jan 06 Scarlets 17.30
5 Connacht vs. Munster Jan 06 Munster -2.70
6 Edinburgh vs. Southern Kings Jan 06 Edinburgh 13.90
7 Zebre vs. Cheetahs Jan 07 Cheetahs -5.40


December 26, 2018

Pro14 Predictions for Round 12

Team Ratings for Round 12

The basic method is described on my Department home page.
Here are the team ratings prior to this week’s games, along with the ratings at the start of the season.

Current Rating Rating at Season Start Difference
Leinster 13.08 9.80 3.30
Munster 9.43 8.08 1.40
Glasgow Warriors 9.02 8.55 0.50
Scarlets 4.77 6.39 -1.60
Connacht 2.71 0.01 2.70
Ospreys 1.05 -0.86 1.90
Ulster 0.80 2.07 -1.30
Cardiff Blues -0.12 0.24 -0.40
Edinburgh -1.05 -0.64 -0.40
Cheetahs -2.93 -0.83 -2.10
Treviso -4.32 -5.19 0.90
Southern Kings -9.63 -7.91 -1.70
Dragons -9.85 -8.59 -1.30
Zebre -12.41 -10.57 -1.80


Performance So Far

So far there have been 76 matches played, 61 of which were correctly predicted, a success rate of 80.3%.
Here are the predictions for last week’s games.

Game Date Score Prediction Correct
1 Cardiff Blues vs. Dragons Dec 22 19 – 16 15.30 TRUE
2 Ulster vs. Munster Dec 22 19 – 12 -5.20 FALSE
3 Zebre vs. Treviso Dec 23 8 – 10 -3.90 TRUE
4 Ospreys vs. Scarlets Dec 23 19 – 12 -0.40 FALSE
5 Edinburgh vs. Glasgow Warriors Dec 23 23 – 7 -7.30 FALSE
6 Leinster vs. Connacht Dec 23 33 – 29 15.90 TRUE


Predictions for Round 12

Here are the predictions for Round 12. The prediction is my estimated expected points difference with a positive margin being a win to the home team, and a negative margin a win to the away team.

Game Date Winner Prediction
1 Connacht vs. Ulster Dec 29 Connacht 6.40
2 Treviso vs. Zebre Dec 30 Treviso 12.60
3 Glasgow Warriors vs. Edinburgh Dec 30 Glasgow Warriors 14.60
4 Munster vs. Leinster Dec 30 Munster 0.80
5 Scarlets vs. Cardiff Blues Dec 30 Scarlets 9.40
6 Dragons vs. Ospreys Dec 31 Ospreys -6.40


Rugby Premiership Predictions for Round 11

Team Ratings for Round 11

The basic method is described on my Department home page.
Here are the team ratings prior to this week’s games, along with the ratings at the start of the season.

Current Rating Rating at Season Start Difference
Saracens 12.04 11.19 0.80
Exeter Chiefs 12.04 11.13 0.90
Gloucester Rugby 4.03 1.23 2.80
Wasps 3.57 8.30 -4.70
Northampton Saints 3.48 3.42 0.10
Leicester Tigers 2.90 6.26 -3.40
Harlequins 1.88 2.05 -0.20
Bath Rugby 1.76 3.11 -1.40
Sale Sharks 0.49 -0.81 1.30
Newcastle Falcons -2.63 -3.51 0.90
Worcester Warriors -3.45 -5.18 1.70
Bristol -4.54 -5.60 1.10


Performance So Far

So far there have been 60 matches played, 44 of which were correctly predicted, a success rate of 73.3%.
Here are the predictions for last week’s games.

Game Date Score Prediction Correct
1 Worcester Warriors vs. Northampton Saints Dec 21 6 – 32 0.70 FALSE
2 Exeter Chiefs vs. Saracens Dec 22 31 – 13 4.20 TRUE
3 Leicester Tigers vs. Harlequins Dec 22 35 – 24 5.50 TRUE
4 Newcastle Falcons vs. Gloucester Rugby Dec 22 17 – 20 -0.80 TRUE
5 Sale Sharks vs. Bristol Dec 22 27 – 10 9.70 TRUE
6 Wasps vs. Bath Rugby Dec 23 14 – 24 8.90 FALSE


Predictions for Round 11

Here are the predictions for Round 11. The prediction is my estimated expected points difference with a positive margin being a win to the home team, and a negative margin a win to the away team.

Game Date Winner Prediction
1 Northampton Saints vs. Exeter Chiefs Dec 28 Exeter Chiefs -3.10
2 Gloucester Rugby vs. Sale Sharks Dec 29 Gloucester Rugby 9.00
3 Harlequins vs. Wasps Dec 29 Harlequins 3.80
4 Saracens vs. Worcester Warriors Dec 29 Saracens 21.00
5 Bath Rugby vs. Leicester Tigers Dec 30 Bath Rugby 4.40
6 Bristol vs. Newcastle Falcons Dec 30 Bristol 3.60


December 14, 2018

Briefly

  • I wrote about the babysitter dystopia of automated social media analysis from a Herald story. Gizmodo has a longer and more detailed piece, including what the automated system thought about the writer’s babysitter and why that’s interesting.
  • Cathy O’Neil has a short animated video about why predictive algorithms aren’t objective in the ‘value-free’ sense
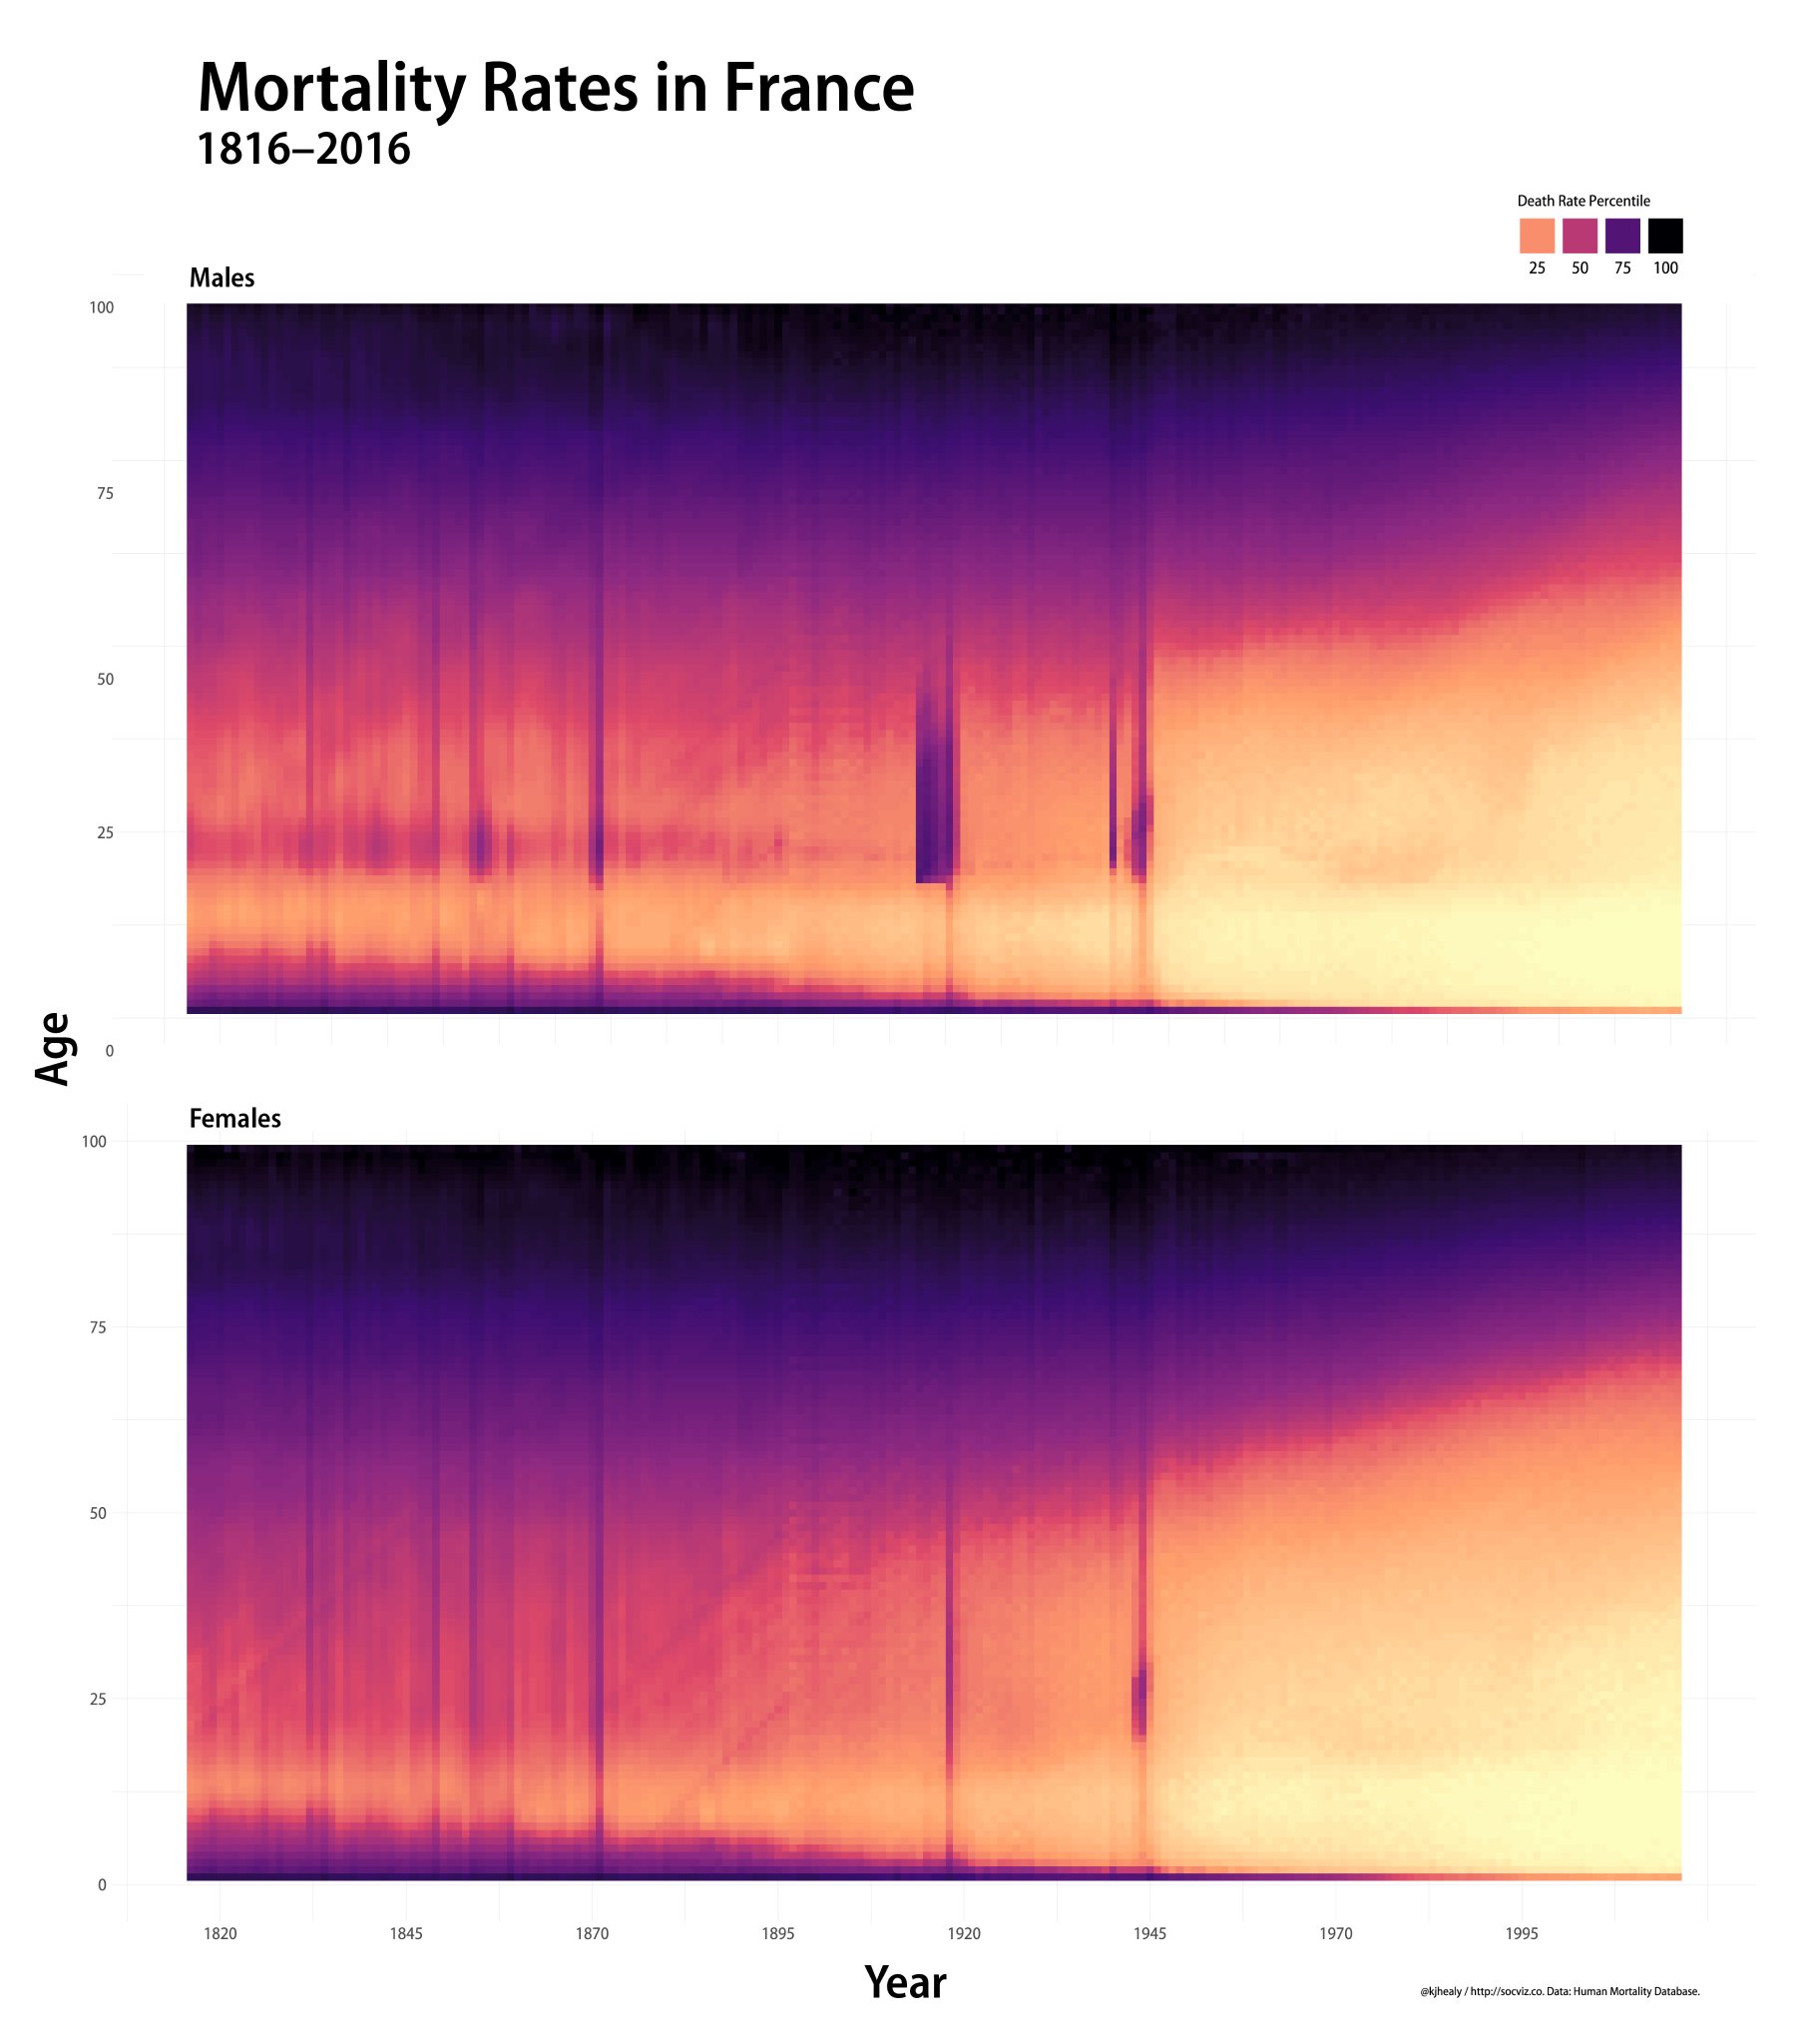
  • Beautiful pictures of mortality rates over time in France, by Kieran Healy (who also has a new book on data visualisation). The vertical lines show event such as wars and pandemics; the general lightening shows improved life expectancy over time; and the subtle diagonal lines follow people born in certain specific years and show they had a shorter life expectancy than those a little older or younger.

Beginning to look a lot like Christmas

In particular, the Christmas issue of the medical journal BMJ, which traditionally includes some research and commentary making serious points in a somewhat non-standard way.

As you may know, a famous BMJ Christmas research paper from 2003 summarised all the existing randomised trials of parachute use when jumping from a plane. There were none.  The paper concluded

 We think that everyone might benefit if the most radical protagonists of evidence based medicine organised and participated in a double blind, randomised, placebo controlled, crossover trial of the parachute.

The paper was pushing the idea that a lot of interventions are so obviously beneficial as to not need evaluation. This idea hasn’t gained much ground since then; probably the reverse. So, it’s appropriate that the highlight of this year’s Christmas issue is a randomised controlled trial of parachute use when jumping from a plane, measuring the effect (impact?) on the risk of being dead or seriously injured, both immediately after the jump and 30 days later.

The trial found no suggestion of a difference between the participants who used a parachute and the ones who used an ordinary North Face backpack. As the researchers note, however,

the trial was only able to enroll participants on small stationary aircraft on the ground, suggesting cautious extrapolation to high altitude jumps.

That is, the paper is making the point that randomised trials often recruit very non-representative sets of people, and this especially true when the medical community, rightly or wrongly, thinks it knows the treatment is effective.


December 13, 2018

Or you’ll go blind?

Almost exactly one year ago, my glasses got broken. I went to a nice optometrist, had an eye exam, and got new glasses.  Apart from my recurring surprise that the lenses have to come all the way from Australia everything was fine. I’ve now had five emails telling me that my next eye exam is “due”, that this sort of regular checkup is “very important” and that it enables the “early detection of a number of eye health problems … making successful treatment more likely”.

The New Zealand medical guidelines for someone in my situation suggest that I need an eye exam at least once every five years, primarily to detect glaucoma. The Australian guidelines (PDF) are similar, but recommend starting at 50. In the US, where they really like screening, the American Academy of Ophthalmology says eye exams every 2-4 years.

That’s a bit different from what optometrists will tell you. The American Optometric Association says ‘at least every two years’ — though they don’t explain their evidence base for this — and the main NZ chains agree. One interesting exception is the College of Optometrists, in the UK, which recommends that you wait a minimum of two years if there isn’t any special reason for more frequent examination.

It’s quite hard to work out optimal screening frequency, but it does look here as though the people who describe how have they tried to consider costs and benefits carefully come up with longer intervals than people who don’t.

December 9, 2018

Is 90% accuracy a lot?

There’s a headline in the Guardian Scientists develop 10-minute universal cancer test. As you’d probably expect by now, that’s overstating things quite a bit. Let’s see what we can find.

The Guardian story doesn’t link to the open-access research paper, but there’s a piece by the researchers themselves in The Conversation. It doesn’t link, either. However, Google finds the science news website phys.org, and it does link.

The idea is that the C of the DNA A, C, T, G bases exists in two versions (C and Ç, say). The modified (methylated) version  is involved in turning genes off, so successful tumours have often managed to get rid of the modifications near genes important for cell growth.  The clever idea is that the changes in methylation can affect how the DNA sticks to itself and to other things — such as gold nanoparticles, where it’s detectable because it changes the colour of the particles in solution.

The research paper shows how this sort of science works. There’s a lot of effort put into measuring how DNA sticks to things, and then showing that it’s really methylation that the test is measuring, including tests with DNA that’s had methylation added or removed artificially.   Then, there are tests with DNA extracted from a selection of real tumours and non-tumours, seeing how well the decisions correlate with cancer. All of this is important as a foundation for the science.

Finally, there’s the data that is directly related to testing for cancer: running the test on DNA found floating free in the blood of people with and without diagnosed cancer

Statistical diagnostic efficacy test at cutoff value %ir = 35.7 shows that our method has high accuracy (83.45%) with high positive and negative predictive values (Table-Fig. 3d, PPV = 91.30%, NPV = 69.81%, see more details at Supplementary Table 3). 

The positive way to put this is that it’s pretty impressive for a first effort, and that optimising the test might make it really useful.  The less positive way to put it is that the positive predictive value of 91.3% (meaning that 91.3% of the people who test positive actually have cancer) happened when two-thirds of all the people tested had cancer.

In that example, roughly one in four of the people without cancer tested positive. Suppose instead you’re using it for screening and that 1 in 100 people really have detectable cancer.   You probably pick up that one person, but you also pick up about 25 people without cancer. And since the other attribute of the test is that it’s supposed to be sensitive to any type of cancer anywhere in the body, you’re going to need to do a lot of further investigation to reassure those 25 people.

December 6, 2018

Six chips a serving

Q: Did you see there’s an exact number of chips that’s healthy?

A: Doesn’t it depend on how big they are?

Q: Apparently not. It’s from a Harvard professor!

A: You know, the more Harvard professors you meet, the less you think they’re automatically right about everything.

Q: It’s based on research! In the American Journal of Clinical Nutrition!

A: That’s more promising.  Link?

Q: 🤣

A: <sigh>. Ok, the story is originally from the New York Times, and they link

Q: Is it in people?

A: Yes

Q: Not randomised, probably.

A: No

Q: So they compared people who ordinarily eat just 6 chips in a serving with normal people and there were health differences? Where did they find the six-chip people?

A: It wasn’t a comparison of six chips to more than six.

Q: Ok, but still larger servings vs smaller servings?

A: No. People who eat fried potatoes more often (like 2-3 times per week) had a higher rate of death than people who ate them less often.

Q: I suppose that makes sense. Especially if you consider what sorts of meals you usually eat with fries.

A: They’d prefer you  focus your attention on the actual fries, not on anything else you eat.

Q: So that gives the message ‘fries are bad’. Why six?

A:  It’s not specified

Q: 🙄

Q: So he’s really saying NO SAFE LEVEL and RISK OF DEATH WITH EVEN ONE just like with bacon and alcohol and driving?

A: To be fair, he’s actually trying not to say that. Or even that normal servings of chips should be BANNED!!.  In fact,  he said later that he just wanted the option of a six-chip serving.

Q: And how popular is that likely to be?

A: Well, here’s the other result I got from searching for “six chips”

December 5, 2018

Pro14 Predictions for Round 11

Team Ratings for Round 11

The basic method is described on my Department home page.
Here are the team ratings prior to this week’s games, along with the ratings at the start of the season.

Current Rating Rating at Season Start Difference
Leinster 13.60 9.80 3.80
Munster 9.95 8.08 1.90
Glasgow Warriors 9.87 8.55 1.30
Scarlets 5.36 6.39 -1.00
Connacht 2.20 0.01 2.20
Ospreys 0.45 -0.86 1.30
Cardiff Blues 0.41 0.24 0.20
Ulster 0.28 2.07 -1.80
Edinburgh -1.90 -0.64 -1.30
Cheetahs -2.93 -0.83 -2.10
Treviso -4.17 -5.19 1.00
Southern Kings -9.63 -7.91 -1.70
Dragons -10.37 -8.59 -1.80
Zebre -12.57 -10.57 -2.00


Performance So Far

So far there have been 70 matches played, 58 of which were correctly predicted, a success rate of 82.9%.
Here are the predictions for last week’s games.

Game Date Score Prediction Correct
1 Munster vs. Edinburgh Dec 01 44 – 14 15.10 TRUE
2 Ospreys vs. Zebre Dec 01 43 – 0 15.60 TRUE
3 Cheetahs vs. Connacht Dec 02 17 – 21 0.00 FALSE
4 Ulster vs. Cardiff Blues Dec 02 16 – 12 4.40 TRUE
5 Dragons vs. Leinster Dec 02 10 – 59 -17.30 TRUE
6 Glasgow Warriors vs. Scarlets Dec 02 29 – 20 9.00 TRUE
7 Southern Kings vs. Treviso Dec 02 19 – 22 -0.60 TRUE


Predictions for Round 11

Here are the predictions for Round 11. The prediction is my estimated expected points difference with a positive margin being a win to the home team, and a negative margin a win to the away team.

Game Date Winner Prediction
1 Cardiff Blues vs. Dragons Dec 22 Cardiff Blues 15.30
2 Ulster vs. Munster Dec 22 Munster -5.20
3 Zebre vs. Treviso Dec 23 Treviso -3.90
4 Ospreys vs. Scarlets Dec 23 Scarlets -0.40
5 Edinburgh vs. Glasgow Warriors Dec 23 Glasgow Warriors -7.30
6 Leinster vs. Connacht Dec 23 Leinster 15.90