Posts from February 2020 (15)

February 29, 2020

Viral misinformation misinformation

I wasn’t going to post about this, but I’ve seen two good Kiwi journalists retweet versions of this today already and I’m having a sense of humour failure about it.

A US public relations company did a phone survey. They don’t describe the methodology very clearly (a bad sign), but suppose we assume for the sake of argument that it was competent.  They don’t given the exact question they asked (also a bad sign), but their conclusion was

  • 38% of beer-drinking Americans would not buy Corona under any circumstances now

Ten years ago, I lived in the US and would have counted as a ‘beer-drinking American’ for phone survey purposes.  I would probably have answered ‘Never’ to a question on whether I would buy Corona.  Strictly speaking, that might have been an exaggeration (and let me point you to one of the great 1980s Australian beer ads as a possible counterexample), but as far as I recall I didn’t ever buy Corona.

Lots of ‘beer-drinking Americans’ don’t buy Corona because they don’t like the flavour or because it’s advertised for a different social group, or whatever. It wouldn’t be surprising if that came to 38% who always preferred Bud or Molson or Coors or Mirror Pond Pale Ale or PBR.

The survey also asked people who usually drank Corona (clearly a minority of the respondents) whether they would still drink it. 4% said no. Unless your survey is exceptionally well conducted, that’s down at the level of alien abductions and lizard people.

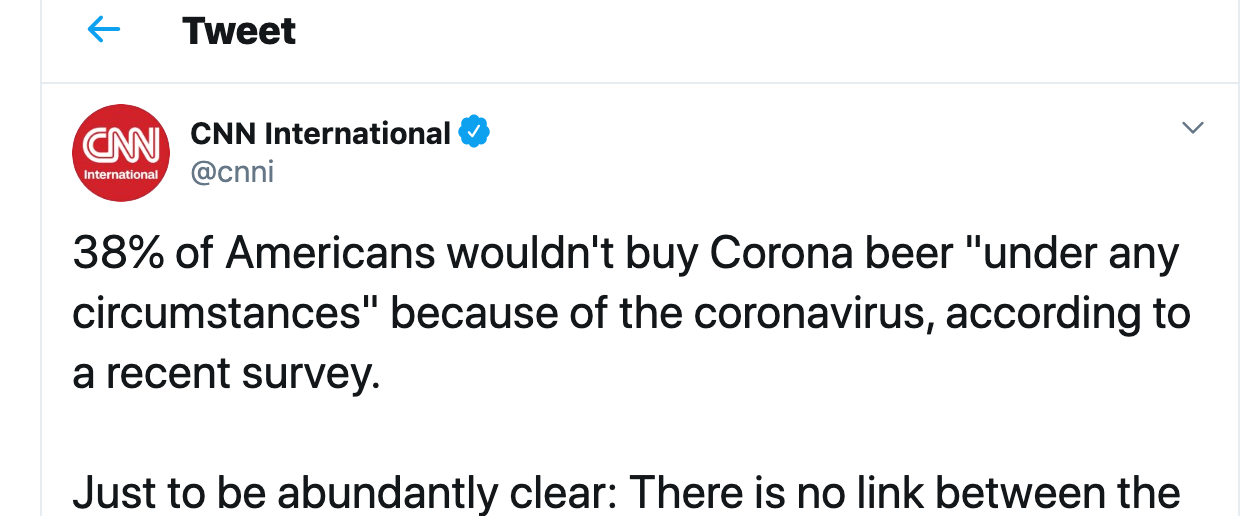
The CNN story also referred to a YouGov survey that said the ‘intent to buy Corona’ was at the lowest level in two years. Here’s the graph

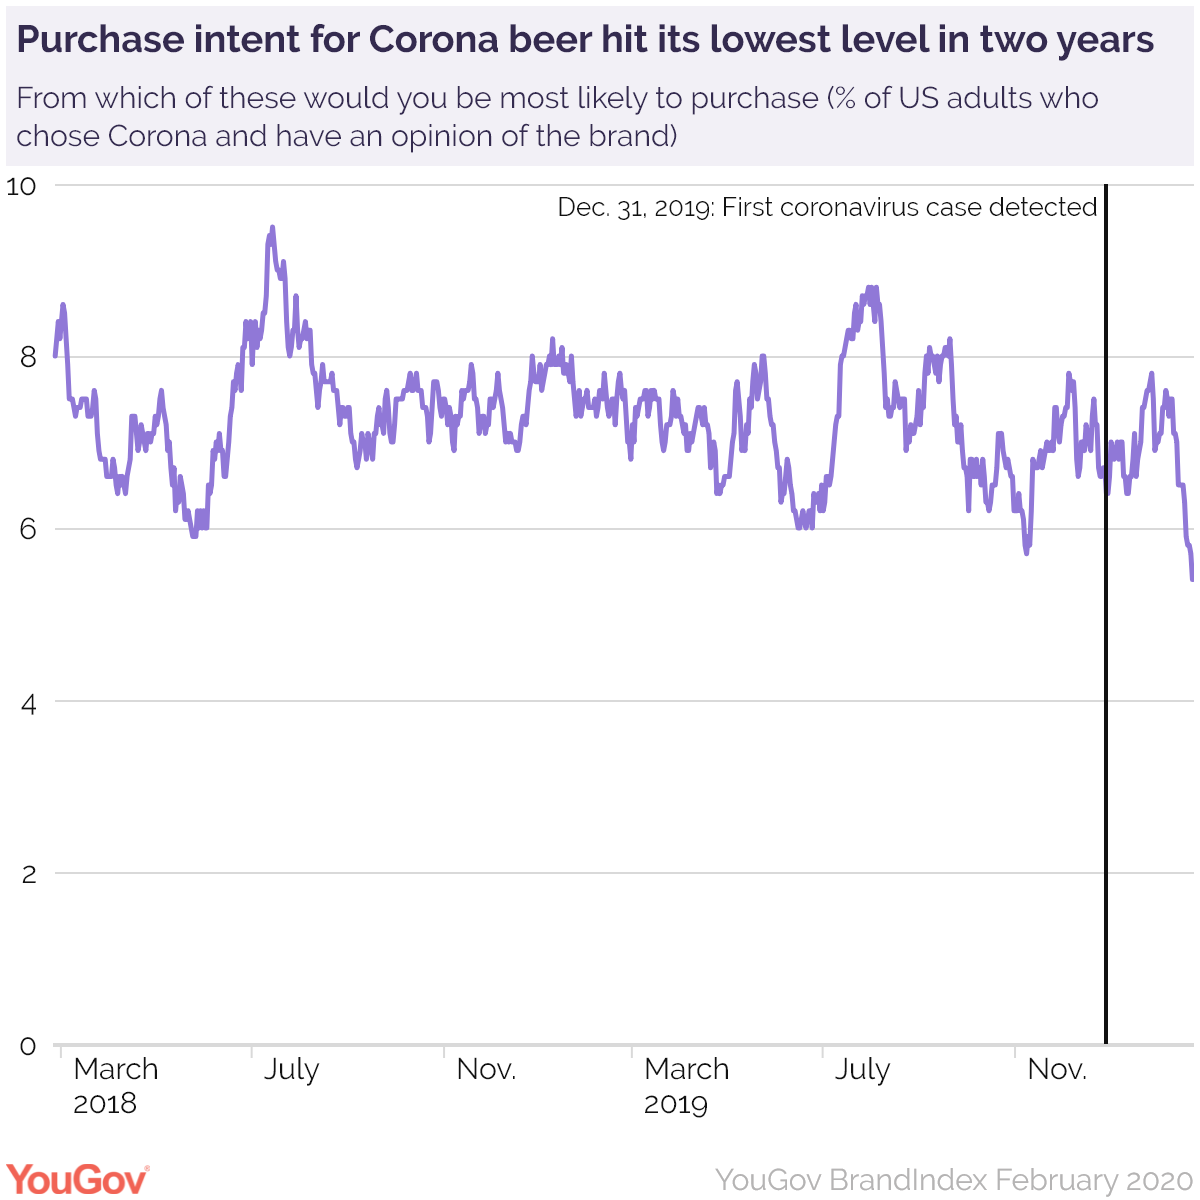
Intent to buy Corona is down about one percentage point from Christmas and maybe two-tenths of a percentage point from October.

While I’m on the topic, I’d like to point out the Infodemic blog. It goes into great detail (with animated gifs and so on) on simple ways to fact-check claims about coronavirus — or anything else.   It’s the same sort of techniques that I use in writing StatsChat, but Mike Caulfield explains them patiently and carefully and I just try to show how I use them.


February 25, 2020

Super Rugby Predictions for Round 5


Team Ratings for Round 5

The basic method is described on my Department home page.
Here are the team ratings prior to this week’s games, along with the ratings at the start of the season.

Current Rating Rating at Season Start Difference
Crusaders 16.23 17.10 -0.90
Hurricanes 7.97 8.79 -0.80
Jaguares 6.76 7.23 -0.50
Chiefs 6.52 5.91 0.60
Stormers 3.02 -0.71 3.70
Highlanders 2.74 4.53 -1.80
Brumbies 2.34 2.01 0.30
Sharks 2.01 -0.87 2.90
Blues 1.05 -0.04 1.10
Bulls -0.64 1.28 -1.90
Lions -1.48 0.39 -1.90
Reds -2.19 -5.86 3.70
Waratahs -4.43 -2.48 -2.00
Rebels -8.28 -7.84 -0.40
Sunwolves -20.59 -18.45 -2.10


Performance So Far

So far there have been 27 matches played, 16 of which were correctly predicted, a success rate of 59.3%.
Here are the predictions for last week’s games.

Game Date Score Prediction Correct
1 Crusaders vs. Highlanders Feb 21 33 – 13 17.50 TRUE
2 Rebels vs. Sharks Feb 22 24 – 36 -3.00 TRUE
3 Chiefs vs. Brumbies Feb 22 14 – 26 13.50 FALSE
4 Reds vs. Sunwolves Feb 22 64 – 5 19.50 TRUE
5 Stormers vs. Jaguares Feb 22 17 – 7 1.00 TRUE
6 Bulls vs. Blues Feb 22 21 – 23 5.70 FALSE


Predictions for Round 5

Here are the predictions for Round 5. The prediction is my estimated expected points difference with a positive margin being a win to the home team, and a negative margin a win to the away team.

Game Date Winner Prediction
1 Highlanders vs. Rebels Feb 28 Highlanders 17.00
2 Waratahs vs. Lions Feb 28 Waratahs 3.00
3 Hurricanes vs. Sunwolves Feb 29 Hurricanes 34.60
4 Reds vs. Sharks Feb 29 Reds 1.80
5 Stormers vs. Blues Feb 29 Stormers 8.00
6 Bulls vs. Jaguares Feb 29 Jaguares -1.40


Rugby Premiership Predictions for Round 12

Team Ratings for Round 12

The basic method is described on my Department home page.
Here are the team ratings prior to this week’s games, along with the ratings at the start of the season.

Current Rating Rating at Season Start Difference
Exeter Chiefs 9.84 7.99 1.80
Saracens 7.60 9.34 -1.70
Sale Sharks 4.71 0.17 4.50
Gloucester 0.55 0.58 -0.00
Bath 0.20 1.10 -0.90
Wasps 0.18 0.31 -0.10
Northampton Saints -0.87 0.25 -1.10
Bristol -1.57 -2.77 1.20
Harlequins -2.21 -0.81 -1.40
Leicester Tigers -3.77 -1.76 -2.00
London Irish -3.82 -5.51 1.70
Worcester Warriors -4.64 -2.69 -2.00


Performance So Far

So far there have been 66 matches played, 45 of which were correctly predicted, a success rate of 68.2%.
Here are the predictions for last week’s games.

Game Date Score Prediction Correct
1 Bath vs. Harlequins Feb 22 19 – 12 6.90 TRUE
2 Bristol vs. Worcester Warriors Feb 22 13 – 10 8.20 TRUE
3 Exeter Chiefs vs. Northampton Saints Feb 22 57 – 7 11.70 TRUE
4 London Irish vs. Gloucester Feb 22 24 – 20 -0.40 FALSE
5 Sale Sharks vs. Leicester Tigers Feb 22 36 – 3 10.70 TRUE
6 Wasps vs. Saracens Feb 22 60 – 10 -8.00 FALSE


Predictions for Round 12

Here are the predictions for Round 12. The prediction is my estimated expected points difference with a positive margin being a win to the home team, and a negative margin a win to the away team.

Game Date Winner Prediction
1 Bath vs. Bristol Feb 29 Bath 6.30
2 Gloucester vs. Sale Sharks Feb 29 Gloucester 0.30
3 Harlequins vs. Exeter Chiefs Feb 29 Exeter Chiefs -7.50
4 Leicester Tigers vs. Worcester Warriors Feb 29 Leicester Tigers 5.40
5 London Irish vs. Wasps Feb 29 London Irish 0.50
6 Northampton Saints vs. Saracens Feb 29 Saracens -4.00


Pro14 Predictions for Round 13

Team Ratings for Round 13

The basic method is described on my Department home page.
Here are the team ratings prior to this week’s games, along with the ratings at the start of the season.

Current Rating Rating at Season Start Difference
Leinster 15.78 12.20 3.60
Munster 9.40 10.73 -1.30
Glasgow Warriors 6.45 9.66 -3.20
Edinburgh 5.92 1.24 4.70
Ulster 4.58 1.89 2.70
Scarlets 2.49 3.91 -1.40
Connacht 0.61 2.68 -2.10
Cheetahs -0.03 -3.38 3.30
Cardiff Blues -0.40 0.54 -0.90
Ospreys -2.82 2.80 -5.60
Treviso -4.03 -1.33 -2.70
Dragons -7.76 -9.31 1.60
Southern Kings -14.82 -14.70 -0.10
Zebre -15.37 -16.93 1.60


Performance So Far

So far there have been 83 matches played, 65 of which were correctly predicted, a success rate of 78.3%.
Here are the predictions for last week’s games.

Game Date Score Prediction Correct
1 Ospreys vs. Leinster Feb 22 13 – 21 -13.00 TRUE
2 Edinburgh vs. Connacht Feb 22 41 – 14 10.50 TRUE
3 Zebre vs. Munster Feb 22 0 – 28 -17.30 TRUE
4 Glasgow Warriors vs. Dragons Feb 23 34 – 19 22.00 TRUE
5 Ulster vs. Cheetahs Feb 23 20 – 10 11.40 TRUE
6 Cardiff Blues vs. Treviso Feb 24 34 – 24 10.20 TRUE
7 Scarlets vs. Southern Kings Feb 24 36 – 17 24.90 TRUE


Predictions for Round 13

Here are the predictions for Round 13. The prediction is my estimated expected points difference with a positive margin being a win to the home team, and a negative margin a win to the away team.

Game Date Winner Prediction
1 Edinburgh vs. Cardiff Blues Feb 29 Edinburgh 12.80
2 Leinster vs. Glasgow Warriors Feb 29 Leinster 15.80
3 Zebre vs. Ospreys Feb 29 Ospreys -6.00
4 Treviso vs. Ulster Mar 01 Ulster -2.10
5 Munster vs. Scarlets Mar 01 Munster 13.40
6 Dragons vs. Cheetahs Mar 01 Cheetahs -1.20
7 Southern Kings vs. Connacht Mar 01 Connacht -8.90


February 20, 2020

Briefly

  • “To be clear I’m not saying that the numbers are wrong, I’m just saying that you can’t have a circle representing $401m be smaller than the lump representing $223m” Felix Salmon, about this graphic from a NY Times story. These ‘bubble’ graphics can be seriously misleading, though they probably wouldn’t violate NZ advertising standards
  • A popular self-driving car dataset is missing labels for hundreds of pedestrians
  • The weirdness of UK gold export statistics, from Ed Conway on Twitter
  • A very nice piece from Hamish Rutherford at the NZ Herald, on how Ardern and Bridges can disagree so much about economic growth.
  • NY Post claims ‘majority of serial killers are Taurus’, attributing the ‘research’ to Britain’s Daily Mirror. It would be surprising if this were true, and it isn’t. The Mirror actually saysmore killers on [a thriller author’s] list were Taureans – born between April 20 and May 20 – than any other star sign.” You might then worry how comprehensive or representative this list was.  Or you might wonder whether 8 out of 35 is surprisingly high for the star sign with the most entries on the list.  Or, you might think “astrology <eyeroll emoji>” (James Heathers on Twitter)
February 18, 2020

Census 2018 data quality

Since August 2018, I’ve been on an external data quality review panel looking at the Census 2018 data, as augmented by StatsNZ’s mitigation efforts. Our final report is out now (yesterday).  From the StatsNZ press release

The panel was convened by the Government Statistician in August 2018 to provide an independent, external review of the quality of 2018 Census data and to provide recommendations to the Government Statistician around improvements to census data quality. The eight-member panel includes experts on census methods, statistics, Māori data, demography, and equity.

It was the Government Statistician’s intention that the panel’s reports would be released publicly and unedited, as a matter of transparency, so all New Zealanders could see both the quality of the variables and the composition of the data.

Here’s the complete series

The basic message is that the quality of the data varies enormously, both by variable and depending on what you want to use it for. Some of it is very good; some of it is not. You should read our assessments and the StatsNZ data quality information before doing anything you might later regret.

Are cars bad for you?

One of the problems with looking for health benefits of active transportation is that people who walk or cycle are self-selected weirdos. It’s a free country. You can’t just randomise people to owning a car or not.  You’d think.

As Alex Hutchinson, of the Globe and Mail reports, based on a research paper in the BMJ,

 Because of mounting congestion, Beijing has limited the number of new car permits it issues to 240,000 a year since 2011. Those permits are issued in a monthly lottery with more than 50 losers for every winner – and that, as researchers from the University of California Berkeley, Renmin University in China and the Beijing Transport Institute recently reported in the British Medical Journal, provides an elegant natural experiment on the health effects of car ownership.

The researchers interviewed a sample of 40,000 people across Beijing and asked them questions. Because of the lottery, the results should be more reliable than useful usual.

It’s not quite as simple as that.  First, people who respond to the survey may be unrepresentative (just over 20% responded). Second, the impact of winning the lottery seemed relatively small:

Our results indicate that those individuals winning a lottery permit to purchase a car reported transit use 45% lower than those who did not win…Differences in physical activity became apparent over time. About 2.6 years after winning, winners spent 7% less time walking or bicycling than losers. At 5.1 years the reduction in walking or bicycling rose to 42%.

This may be less surprising if you’ve been to Beijing and seen the traffic congestion. Anyway, the impact on physical activity was very small initially, though it did increase over time.

The main outcome variable measured was weight:

Average weight did not change significantly between lottery winners and losers.

If you look just at people over 50, and wait until five years after the lottery, there’s an estimated 10kg weight difference, but the statistical evidence is pretty weak and the uncertainty is large. The effect could easily be pretty much zero, and that’s without worrying about picking just one age group.

The basic message here is that it’s hard to do experiments on driving — even in one of the world’s biggest cities, the data end up being consistent with anything from no effect to a huge effect.

Counting cases

There have been some fairly large fluctuations in the reported number of cases of COVID-19, the new coronavirus, in China, as the authorities change how they define cases.  That’s not as dodgy as it might sound.

We can divide the population into two groups according to how they feel: do they have symptoms consistent with COVID-19 infection or not.  We can divide them into three groups according to viral testing: positive, negative, not tested yet.  Outside the outbreak area we could also divide people according to whether they had a plausible exposure or not, but at the centre of the outbreak it makes sense to assume basically anyone could have been exposed.  We end up with six groups.

  • The no-symptoms, negative test group clearly shouldn’t be counted as cases.
  • The symptoms, positive test group clearly are cases.

Then it gets harder:

  • The symptoms, no-test group will be mixed.  Many of them will have COVID-19 infection, but others will just have some other influenza-like illness. The likelihood that they are cases will vary according to exactly what symptoms they have.  Most of these people are being tested for the virus, but testing for a new virus is relatively slow and takes expertise, and the testing labs are backed up. The subset of people with lower respiratory tract infection confirmed by chest imaging (x-ray) were recently added to the official case count, but only if they are in Hubei province, China.
  • The symptoms, negative test group are probably not cases of COVID-19.
  • The no-symptoms, positive test group are probably cases, but since few asymptomatic people are being tested, they will be a small and unrepresentative subset of the asymptomatic cases. I have one source that says these were recently subtracted from the count
  • The no-symptoms, no-test group includes nearly everyone, including most of the asymptomatic (or mildly symptomatic) cases.

Who you want to count depends on what you want to do with the data.

Super Rugby Predictions for Round 4

Team Ratings for Round 4

The basic method is described on my Department home page.
Here are the team ratings prior to this week’s games, along with the ratings at the start of the season.

Current Rating Rating at Season Start Difference
Crusaders 16.01 17.10 -1.10
Chiefs 8.18 5.91 2.30
Hurricanes 7.97 8.79 -0.80
Jaguares 7.41 7.23 0.20
Highlanders 2.96 4.53 -1.60
Stormers 2.37 -0.71 3.10
Sharks 1.36 -0.87 2.20
Brumbies 0.68 2.01 -1.30
Blues 0.35 -0.04 0.40
Bulls 0.05 1.28 -1.20
Lions -1.48 0.39 -1.90
Waratahs -4.43 -2.48 -2.00
Reds -4.65 -5.86 1.20
Rebels -7.63 -7.84 0.20
Sunwolves -18.13 -18.45 0.30


Performance So Far

So far there have been 21 matches played, 12 of which were correctly predicted, a success rate of 57.1%.
Here are the predictions for last week’s games.

Game Date Score Prediction Correct
1 Blues vs. Crusaders Feb 14 8 – 25 -9.90 TRUE
2 Rebels vs. Waratahs Feb 14 24 – 10 -0.70 FALSE
3 Sunwolves vs. Chiefs Feb 15 17 – 43 -19.10 TRUE
4 Hurricanes vs. Sharks Feb 15 38 – 22 11.90 TRUE
5 Brumbies vs. Highlanders Feb 15 22 – 23 4.80 FALSE
6 Lions vs. Stormers Feb 15 30 – 33 1.50 FALSE
7 Jaguares vs. Reds Feb 15 43 – 27 18.50 TRUE


Predictions for Round 4

Here are the predictions for Round 4. The prediction is my estimated expected points difference with a positive margin being a win to the home team, and a negative margin a win to the away team.

Game Date Winner Prediction
1 Crusaders vs. Highlanders Feb 21 Crusaders 17.50
2 Rebels vs. Sharks Feb 22 Sharks -3.00
3 Chiefs vs. Brumbies Feb 22 Chiefs 13.50
4 Reds vs. Sunwolves Feb 22 Reds 19.50
5 Stormers vs. Jaguares Feb 22 Stormers 1.00
6 Bulls vs. Blues Feb 22 Bulls 5.70


Rugby Premiership Predictions for Round 11

Team Ratings for Round 11

The basic method is described on my Department home page.
Here are the team ratings prior to this week’s games, along with the ratings at the start of the season.

Current Rating Rating at Season Start Difference
Saracens 10.13 9.34 0.80
Exeter Chiefs 8.06 7.99 0.10
Sale Sharks 3.60 0.17 3.40
Northampton Saints 0.91 0.25 0.70
Gloucester 0.84 0.58 0.30
Bath 0.19 1.10 -0.90
Bristol -1.24 -2.77 1.50
Harlequins -2.20 -0.81 -1.40
Wasps -2.34 0.31 -2.70
Leicester Tigers -2.65 -1.76 -0.90
London Irish -4.11 -5.51 1.40
Worcester Warriors -4.97 -2.69 -2.30


Performance So Far

So far there have been 60 matches played, 41 of which were correctly predicted, a success rate of 68.3%.
Here are the predictions for last week’s games.

Game Date Score Prediction Correct
1 Gloucester vs. Exeter Chiefs Feb 15 15 – 26 -1.70 TRUE
2 Harlequins vs. London Irish Feb 15 15 – 29 8.70 FALSE
3 Leicester Tigers vs. Wasps Feb 15 18 – 9 3.50 TRUE
4 Northampton Saints vs. Bristol Feb 15 14 – 20 8.20 FALSE
5 Saracens vs. Sale Sharks Feb 15 36 – 22 10.50 TRUE
6 Worcester Warriors vs. Bath Feb 15 21 – 22 -0.60 TRUE


Predictions for Round 11

Here are the predictions for Round 11. The prediction is my estimated expected points difference with a positive margin being a win to the home team, and a negative margin a win to the away team.

Game Date Winner Prediction
1 Bath vs. Harlequins Feb 22 Bath 6.90
2 Bristol vs. Worcester Warriors Feb 22 Bristol 8.20
3 Exeter Chiefs vs. Northampton Saints Feb 22 Exeter Chiefs 11.70
4 London Irish vs. Gloucester Feb 22 Gloucester -0.40
5 Sale Sharks vs. Leicester Tigers Feb 22 Sale Sharks 10.70
6 Wasps vs. Saracens Feb 22 Saracens -8.00