Posts from February 2022 (24)

February 15, 2022

Super Rugby Predictions for Week 1

Team Ratings for Week 1

A couple of comments for the start of this competition.

I have in the past have had reasonable success rating new teams at -10, and have done that this time. The Waratahs were a total disaster last year and rated -11. I don’t believe they will be worse than the new teams so did adjust their rating to -9. Even this may be viewing them a little negatively. Overall, be aware this is a new competition in a number of ways, and initially I may not achieve very good results.

I have predicted a result for the opening game involving Moana Pasifika, which seems unlikely to go ahead.

The basic method is described on my Department home page.
Here are the team ratings prior to this week’s games, along with the ratings at the start of the season.

Current Rating Rating at Season Start Difference
Crusaders 13.43 13.43 0.00
Blues 9.26 9.26 -0.00
Hurricanes 8.28 8.28 0.00
Highlanders 6.54 6.54 -0.00
Chiefs 5.56 5.56 -0.00
Brumbies 3.61 3.61 -0.00
Reds 1.37 1.37 -0.00
Western Force -4.96 -4.96 0.00
Rebels -5.79 -5.79 -0.00
Waratahs -9.00 -9.00 0.00
Moana Pasifika -10.00 -10.00 0.00
Fijian Drua -10.00 -10.00 0.00


Predictions for Week 1

Here are the predictions for Week 1. The prediction is my estimated expected points difference with a positive margin being a win to the home team, and a negative margin a win to the away team.

Game Date Winner Prediction
1 Moana Pasifika vs. Blues Feb 18 Blues -19.30
2 Waratahs vs. Fijian Drua Feb 18 Waratahs 6.50
3 Chiefs vs. Highlanders Feb 19 Highlanders -6.50
4 Crusaders vs. Hurricanes Feb 19 Crusaders 5.20
5 Reds vs. Rebels Feb 19 Reds 12.70
6 Brumbies vs. Western Force Feb 19 Brumbies 14.10


Rugby Premiership Predictions for Round 17

Team Ratings for Round 17

The basic method is described on my Department home page.
Here are the team ratings prior to this week’s games, along with the ratings at the start of the season.

Current Rating Rating at Season Start Difference
Saracens 4.76 -5.00 9.80
Exeter Chiefs 4.00 7.35 -3.30
Sale Sharks 3.31 4.96 -1.70
Wasps 2.53 5.66 -3.10
Leicester Tigers 2.51 -6.14 8.60
Gloucester 1.54 -1.02 2.60
Northampton Saints 0.10 -2.48 2.60
Harlequins 0.00 -1.08 1.10
Bristol -2.67 1.28 -4.00
London Irish -2.82 -8.05 5.20
Bath -6.44 2.14 -8.60
Newcastle Falcons -7.61 -3.52 -4.10
Worcester Warriors -10.82 -5.71 -5.10


Performance So Far

So far there have been 94 matches played, 51 of which were correctly predicted, a success rate of 54.3%.
Here are the predictions for last week’s games.

Game Date Score Prediction Correct
1 Bristol vs. London Irish Feb 13 32 – 49 7.00 FALSE
2 Exeter Chiefs vs. Gloucester Feb 13 24 – 15 6.60 TRUE
3 Leicester Tigers vs. Northampton Saints Feb 13 35 – 20 5.90 TRUE
4 Sale Sharks vs. Worcester Warriors Feb 13 36 – 12 17.90 TRUE
5 Saracens vs. Harlequins Feb 13 19 – 10 9.30 TRUE
6 Wasps vs. Bath Feb 13 41 – 24 12.90 TRUE


Predictions for Round 17

Here are the predictions for Round 17. The prediction is my estimated expected points difference with a positive margin being a win to the home team, and a negative margin a win to the away team.

Game Date Winner Prediction
1 Bath vs. Leicester Tigers Feb 20 Leicester Tigers -4.40
2 Harlequins vs. Wasps Feb 20 Harlequins 2.00
3 London Irish vs. Saracens Feb 20 Saracens -3.10
4 Newcastle Falcons vs. Exeter Chiefs Feb 20 Exeter Chiefs -7.10
5 Northampton Saints vs. Sale Sharks Feb 20 Northampton Saints 1.30
6 Worcester Warriors vs. Bristol Feb 20 Bristol -3.60


February 13, 2022

Community Covid Testing

For the past couple of years I’ve been arguing against Covid testing for people who don’t have symptoms and aren’t at high risk of exposure: they’ll have only a minute chance of testing positive, so we won’t learn anything, and we have better uses for the testing resources.  The only country that’s been doing systematic surveillance of Covid has been the UK, where the background prevalence has been, let’s say, somewhat higher than it had been here.

New Zealand is now getting a substantial Covid outbreak.  We’ll be over 1000 new cases some day soon, and it will start to matter for hospital planning purposes whether we’re detecting 20% of infections or 10% or 1% — because hospital numbers follow infection numbers with a long enough lag that the information is useful.

We’ve got two possible approaches to estimating the population Covid burden. One is wastewater testing, the other is random sampling.  Both approaches will keep working no matter how high the Covid prevalence is and no matter what fraction of infections are diagnosed and reported.  Sampling is more expensive, but has the advantage that it actually counts people rather than counting viruses and extrapolating to people.  Using both would probably help balance their pros and cons.

Sampling doesn’t have to be ‘simple random sampling’. If we know there’s more Covid in Auckland than in Oamaru, we can sample at a higher rate in Auckland and a lower rate in Oamaru.  We can also do adaptive sampling, where you take more samples in places where you find a hotspot.  Statistical ecologists trying to count plant and animal populations have studied this sort of problem quite a lot over the years — and statistical ecology is, fortunately, an area where NZ has expertise. But even simple random sampling would work, and would give us an estimate of infections and symptomatic cases across the country, and help plan the short to medium term response.

February 10, 2022

Briefly

  • Good discussion of the overinterpretation of opinion polls from Mediawatch. Hayden Donnell jokingly says “That is, of course, except for Mediawatch, which is the only truly objective outlet in town” — but like StatsChat, Mediawatch has the luxury of not commenting on stories where we don’t have anything to say.
  • In contrast to well-conducted opinion polls, Twitter polls are completely valueless as a way of collecting and summarising popular opinion. This means that while they’re fine for entertainment (yay  @nickbakernz) and collecting reckons from your friends, it’s probably not a good idea to rage-retweet batshit political polls.  Let them get 37:0 in favour of banning arithmetic or whatever, rather than 37:1000 against.
  • A summary of where the various non-profit Covid vaccines have got to, from Hilda Bastian
  • One of the repeated themes of this blog is that you need to measure the right things if you’re going to base decisions on them.  The “Drug Harm Index” may not qualify here because it’s not clear decisions are made based on it, but it’s still worth looking at whether it measures harm the right way.  As Russell Brown points out, the index would say “that cannabis is New Zealand’s most harmful drug – accounting for $626 million in “community harm” every year. Would you be surprised if I told you more than a third of that was lost GST?”
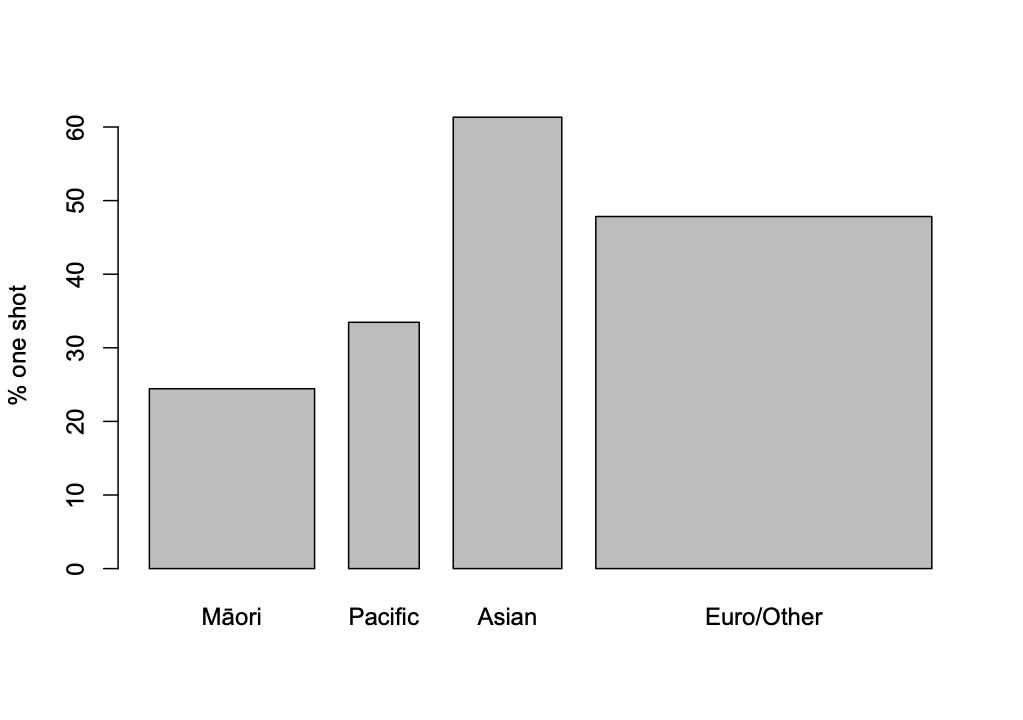
  • According to the MoH vaccination data, the vaccine roll-out for kids is going well on average, with 43% having had their first shot, but the differences by ethnicity are about the same as they were for adults. At the start of the Delta outbreak in August  (according to Hannah Martin at Stuff)  just over 40% of Aucklanders had had a first dose, 33% of Pacific people and 28% of Māori. That’s almost creepily close to the current situation with 5-11 year olds across the country now — the percentage for Māori being slightly lower this time.  Equity being a priority doesn’t seem to have had much impact.
  • Interesting post from Pew Research on writing survey questions: in particular, ‘agree:disagree’ questions give you more ‘agree’ results than forced choice “pineapple or pepperoni” questions on the same issues.
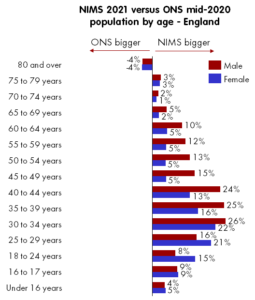
  • In New Zealand there are some issues with denominators for vaccination rates — the population that’s used undercounts minority groups.  This seems to be much worse in the UK: from Paul Mainwood on Twitter
February 8, 2022

Top 14 Predictions for Postponed Games

Team Ratings for Postponed Games

The basic method is described on my Department home page.
Here are the team ratings prior to this week’s games, along with the ratings at the start of the season.

Current Rating Rating at Season Start Difference
La Rochelle 7.03 6.78 0.20
Stade Toulousain 6.97 6.83 0.10
Bordeaux-Begles 6.87 5.42 1.50
Racing-Metro 92 5.50 6.13 -0.60
Lyon Rugby 4.87 4.15 0.70
Clermont Auvergne 4.45 5.09 -0.60
Montpellier 4.32 -0.01 4.30
Castres Olympique 1.49 0.94 0.50
Stade Francais Paris 0.30 1.20 -0.90
RC Toulonnais -0.53 1.82 -2.30
Section Paloise -2.40 -2.25 -0.20
USA Perpignan -3.23 -2.78 -0.50
Brive -3.68 -3.19 -0.50
Biarritz -4.60 -2.78 -1.80


Performance So Far

So far there have been 111 matches played, 82 of which were correctly predicted, a success rate of 73.9%.
Here are the predictions for last week’s games.

Game Date Score Prediction Correct
1 USA Perpignan vs. Stade Toulousain Feb 06 36 – 13 -5.40 FALSE
2 Lyon Rugby vs. Stade Francais Paris Feb 06 26 – 22 11.90 TRUE
3 Montpellier vs. Section Paloise Feb 06 29 – 12 12.80 TRUE
4 Racing-Metro 92 vs. Brive Feb 06 57 – 19 14.20 TRUE
5 RC Toulonnais vs. Castres Olympique Feb 06 10 – 22 5.60 FALSE
6 Biarritz vs. La Rochelle Feb 07 27 – 24 -6.00 FALSE


Predictions for Postponed Games

Here are the predictions for Postponed Games. The prediction is my estimated expected points difference with a positive margin being a win to the home team, and a negative margin a win to the away team.

Game Date Winner Prediction
1 Brive vs. Clermont Auvergne Feb 13 Clermont Auvergne -1.30
2 Racing-Metro 92 vs. Section Paloise Feb 13 Racing-Metro 92 13.30
3 Stade Toulousain vs. Stade Francais Paris Feb 12 Stade Toulousain 14.70
4 RC Toulonnais vs. Bordeaux-Begles Feb 13 Bordeaux-Begles -1.10


United Rugby Championship Predictions for Week 14

Team Ratings for Week 14

The basic method is described on my Department home page.
Here are the team ratings prior to this week’s games, along with the ratings at the start of the season.

Current Rating Rating at Season Start Difference
Leinster 14.71 14.79 -0.10
Munster 9.92 10.69 -0.80
Ulster 7.71 7.41 0.30
Glasgow 4.87 3.69 1.20
Edinburgh 3.66 2.90 0.80
Bulls 2.28 3.65 -1.40
Stormers 1.83 0.00 1.80
Connacht 1.71 1.72 -0.00
Sharks 0.69 -0.07 0.80
Ospreys 0.18 0.94 -0.80
Cardiff Rugby -0.93 -0.11 -0.80
Scarlets -1.39 -0.77 -0.60
Benetton -3.05 -4.50 1.40
Lions -3.37 -3.91 0.50
Dragons -6.46 -6.92 0.50
Zebre -16.31 -13.47 -2.80


Performance So Far

So far there have been 67 matches played, 46 of which were correctly predicted, a success rate of 68.7%.
Here are the predictions for last week’s games.

Game Date Score Prediction Correct
1 Ulster vs. Connacht Feb 05 32 – 12 9.90 TRUE
2 Bulls vs. Lions Feb 06 21 – 13 11.20 TRUE
3 Stormers vs. Sharks Feb 06 20 – 10 5.30 TRUE


Predictions for Week 14

Here are the predictions for Week 14. The prediction is my estimated expected points difference with a positive margin being a win to the home team, and a negative margin a win to the away team.

Game Date Winner Prediction
1 Leinster vs. Edinburgh Feb 12 Leinster 17.50
2 Glasgow vs. Munster Feb 12 Glasgow 1.40
3 Lions vs. Stormers Feb 13 Stormers -0.20
4 Bulls vs. Sharks Feb 13 Bulls 6.60


Rugby Premiership Predictions for Round 16

Team Ratings for Round 16

The basic method is described on my Department home page.
Here are the team ratings prior to this week’s games, along with the ratings at the start of the season.

Current Rating Rating at Season Start Difference
Saracens 4.79 -5.00 9.80
Exeter Chiefs 3.81 7.35 -3.50
Sale Sharks 2.94 4.96 -2.00
Wasps 2.27 5.66 -3.40
Leicester Tigers 1.98 -6.14 8.10
Gloucester 1.73 -1.02 2.80
Northampton Saints 0.62 -2.48 3.10
Harlequins -0.02 -1.08 1.10
Bristol -1.48 1.28 -2.80
London Irish -4.01 -8.05 4.00
Bath -6.18 2.14 -8.30
Newcastle Falcons -7.61 -3.52 -4.10
Worcester Warriors -10.45 -5.71 -4.70


Performance So Far

So far there have been 88 matches played, 46 of which were correctly predicted, a success rate of 52.3%.
Here are the predictions for last week’s games.

Game Date Score Prediction Correct
1 Bristol vs. Newcastle Falcons Feb 06 37 – 21 9.90 TRUE
2 Exeter Chiefs vs. Wasps Feb 06 26 – 27 7.00 FALSE
3 Gloucester vs. London Irish Feb 06 24 – 7 9.30 TRUE
4 Harlequins vs. Sale Sharks Feb 06 14 – 36 4.10 FALSE
5 Leicester Tigers vs. Worcester Warriors Feb 06 36 – 16 16.30 TRUE
6 Saracens vs. Bath Feb 06 40 – 3 13.10 TRUE


Predictions for Round 16

Here are the predictions for Round 16. The prediction is my estimated expected points difference with a positive margin being a win to the home team, and a negative margin a win to the away team.

Game Date Winner Prediction
1 Bristol vs. London Irish Feb 13 Bristol 7.00
2 Exeter Chiefs vs. Gloucester Feb 13 Exeter Chiefs 6.60
3 Leicester Tigers vs. Northampton Saints Feb 13 Leicester Tigers 5.90
4 Sale Sharks vs. Worcester Warriors Feb 13 Sale Sharks 17.90
5 Saracens vs. Harlequins Feb 13 Saracens 9.30
6 Wasps vs. Bath Feb 13 Wasps 12.90


Currie Cup Predictions for Round 4


Team Ratings for Round 4

The basic method is described on my Department home page.
Here are the team ratings prior to this week’s games, along with the ratings at the start of the season.

Current Rating Rating at Season Start Difference
Bulls 7.21 7.25 -0.00
Sharks 3.77 4.13 -0.40
Western Province -0.14 1.42 -1.60
Cheetahs -0.20 -2.70 2.50
Pumas -2.36 -3.31 0.90
Griquas -2.73 -4.92 2.20
Lions -5.56 -1.88 -3.70


Performance So Far

So far there have been 9 matches played, 7 of which were correctly predicted, a success rate of 77.8%.
Here are the predictions for last week’s games.

Game Date Score Prediction Correct
1 Griquas vs. Pumas Feb 03 41 – 20 1.10 TRUE
2 Bulls vs. Cheetahs Feb 03 25 – 38 16.10 FALSE
3 Sharks vs. Western Province Feb 03 35 – 20 7.00 TRUE


Predictions for Round 4

Here are the predictions for Round 4. The prediction is my estimated expected points difference with a positive margin being a win to the home team, and a negative margin a win to the away team.

Game Date Winner Prediction
1 Griquas vs. Western Province Feb 19 Griquas 1.90
2 Pumas vs. Cheetahs Feb 19 Pumas 2.30
3 Lions vs. Sharks Feb 20 Sharks -4.80


February 7, 2022

Testing numbers

The Herald and the Spinoff both commented on the Covid testing results yesterday. The Spinoff had a quick paragraph

While the tally of new cases is down, the test positivity rate is up. Yesterday’s report saw 21,471 tests and 243 positive cases – a one in 88 result; today it was 16,873 tests and 208 new cases: a one in 81 result.

and the Herald had a detailed story with quotes from experts

Experts believe Covid fatigue and a perception that Omicron is less of a threat than Delta are to blame for low testing numbers at the start of the community outbreak.

There were 100,000 fewer tests administered in the week following Omicron community transmission than the week following Delta transmission, Ministry of Health data shows.

They’re both right, but the Ministry of Health is not giving out the most helpful numbers or comparisons to understand how much it’s really a problem.

There are three basic reasons for testing: regular surveillance for people in certain high-risk jobs, testing of contacts, and testing of people with symptoms.  The number of surveillance tests is pretty much uninformative — it’s just a policy choice — but the proportion of positive tests is a strong signal.  The number of tests done for (not yet symptomatic) close contacts tells us about the effectiveness of contact tracing and about the number of cases in recent days (which we knew), but it doesn’t tell  us much else, and the positivity rate will mostly depend on who we define as close contacts rather than on anything about the epidemic.  The number of tests prompted by symptoms actually is an indicator of willingness to test, and the test positivity rate is an indicator of Covid prevalence, but only up to a point.

There’s another external factor confusing the interpretation of changes in symptomatic testing: the seasonal changes in the rate of other illnesses.  When Delta appeared, testing was higher than when Omicron appeared.  That could be partly because people (wrongly) thought Omicron didn’t matter, or (wrongly) thought it couldn’t be controlled, or (perhaps correctly) worried that their employers would be less supportive of being absent, or thought the public health system didn’t care as much or something.  It will also be partly because fewer people have colds in December than in August.

As a result of much collective mahi and good luck, most of the people getting tested because of symptoms actually have some other viral upper-respiratory illness, not Covid.  At times of year when there is more not-actually-Covid illness, testing rates should be higher. August is winter and kids had been at school and daycare; it’s the peak season for not-actually-Covid. December, with school out and after a long lockdown to suppress various other viruses, is low season for not-actually-Covid. Fewer tests in December is not a surprise.

Not only will more colds mean more testing, they will also mean a lower test positivity rate — at the extreme if there were no other illnesses, everyone with symptoms would have Covid. The two key testing statistics, counts and positivity rate, are hard to interpret in comparisons between now and August.

It would help some if the Ministry of Health reported test numbers and results by reason for testing: contacts, symptoms, regular surveillance. It would help to compare symptomatic testing rates with independent estimates of the background rate of symptoms (eg from Flutracker).  But it’s always going to be hard to interpret differences over long periods of time — differences over a few weeks are easier to interpret, preferably averaged over more than one day of reporting to reduce random noise.

None of this is to disagree with the call for people with symptoms to get tested.  We know not everyone with symptoms is tested; it’s probably been a minority throughout the pandemic. Getting the rate up would help flatten the wave of Omicron along with masks and vaccines and everything else.
February 6, 2022

How many omicrons (recap)

Now we’re at Waitangi weekend we can confirm that New Zealand modellers and epidemiologists, none of whom expected 50,000 cases per day at this point, were correct.  Unfortunately, the Herald has

Questioned on earlier figures that up to 50,000 new cases would be emerging by Waitangi Day – and 80,000 a day a few weeks later – Hipkins described the calculations as useful, saying it was better to have some modelling than none.

Further down, the Herald piece admits that these figures didn’t come from the New Zealand modellers that the Minister is paying and being advised by, but from IHME in Seattle. It’s worse than that, though. The only place I saw tens of thousands of cases as a description of the modelling by the IHME in Seattle was in a Herald headline.

All the other reporting of it that I saw at least said “infections”, even if they weren’t clear enough that this wasn’t remotely the same as cases. 

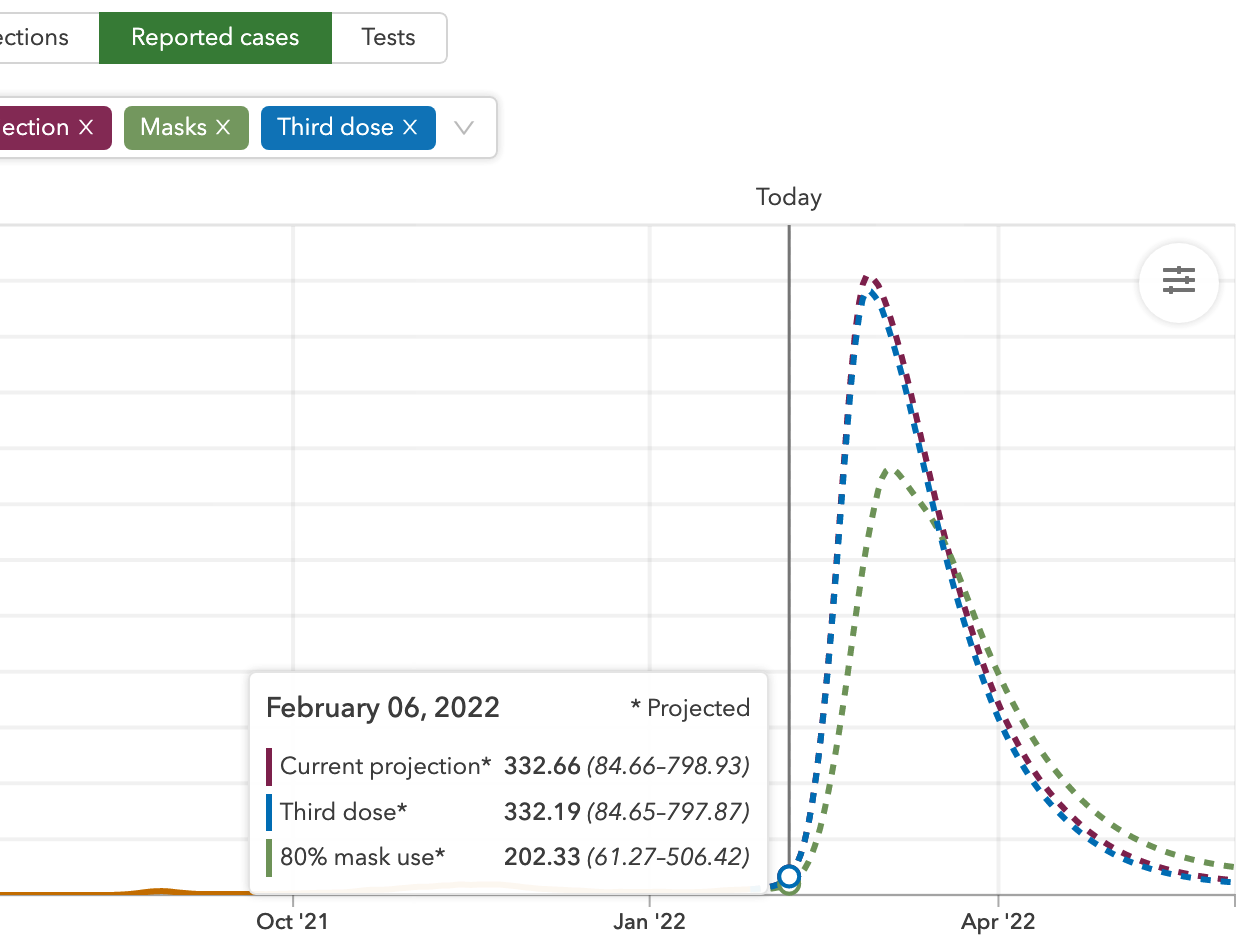
As you can see, the IHME model prediction for reported cases today, Sunday 6 February, was actually 332 (or 202 with good mask use), even though the projection for infections by tomorrow was nearly 50,000.

The uncertainty interval for that projected 332 went from 85 to nearly 800, so the actual figure was well inside the predicted range.

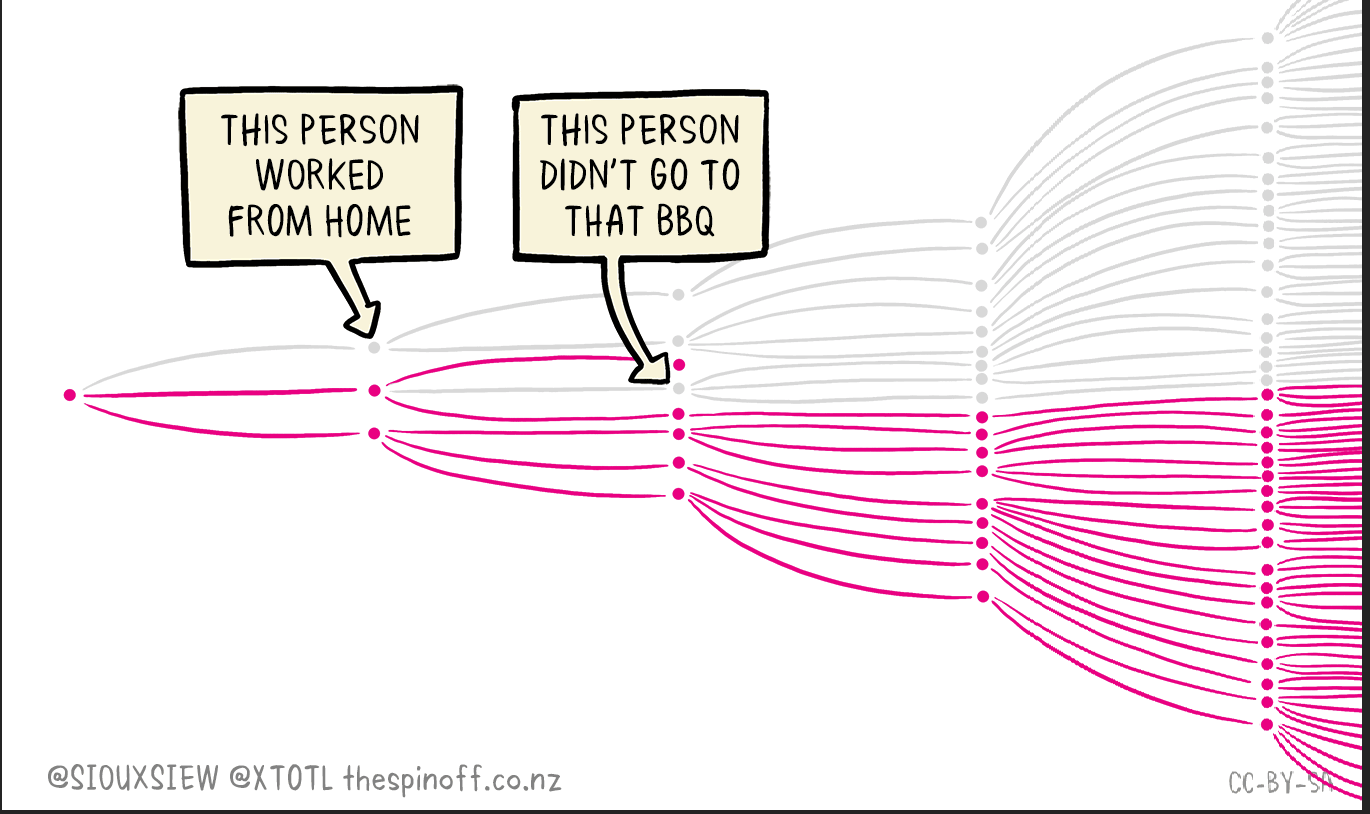
You might think that this sort of accuracy still isn’t very good. Projecting the timing of the epidemic is hard — think of the exponential-spread cartoon from Toby Morris and Siouxsie Wiles

Especially early on in an outbreak, individual choices and luck can make a big difference to how fast the outbreak spreads.  Eventually it will be overall patterns of vaccination and masking and distancing and isolation that matter for the overall outbreak size. The models will be more accurate as the outbreak gets bigger and less random, and they will likely be more accurate about total outbreak size than about timing.

I’m not a fan of the IHME models — they have notoriously been overly optimistic in the medium to long term in the US — but Michael Baker and the Otago group think they’re reasonable, and you should arguably listen to them rather than me on this topic.  We’ll find out soon. Whatever you think of them in general, though, the modellers certainly didn’t predict 50,000 cases by today, and shouldn’t be criticised for failing to predict something that didn’t happen.