Good reporting of numbers
Stuff has a new fact-check column, “The Whole Truth”, and there’s a good example with discussion of youth crime trends, by James Halpin.
The graphs are just the sort of thing I use and recommend: enough history and (where appropriate) enough context to see what trends are just continuing and where things might have changed
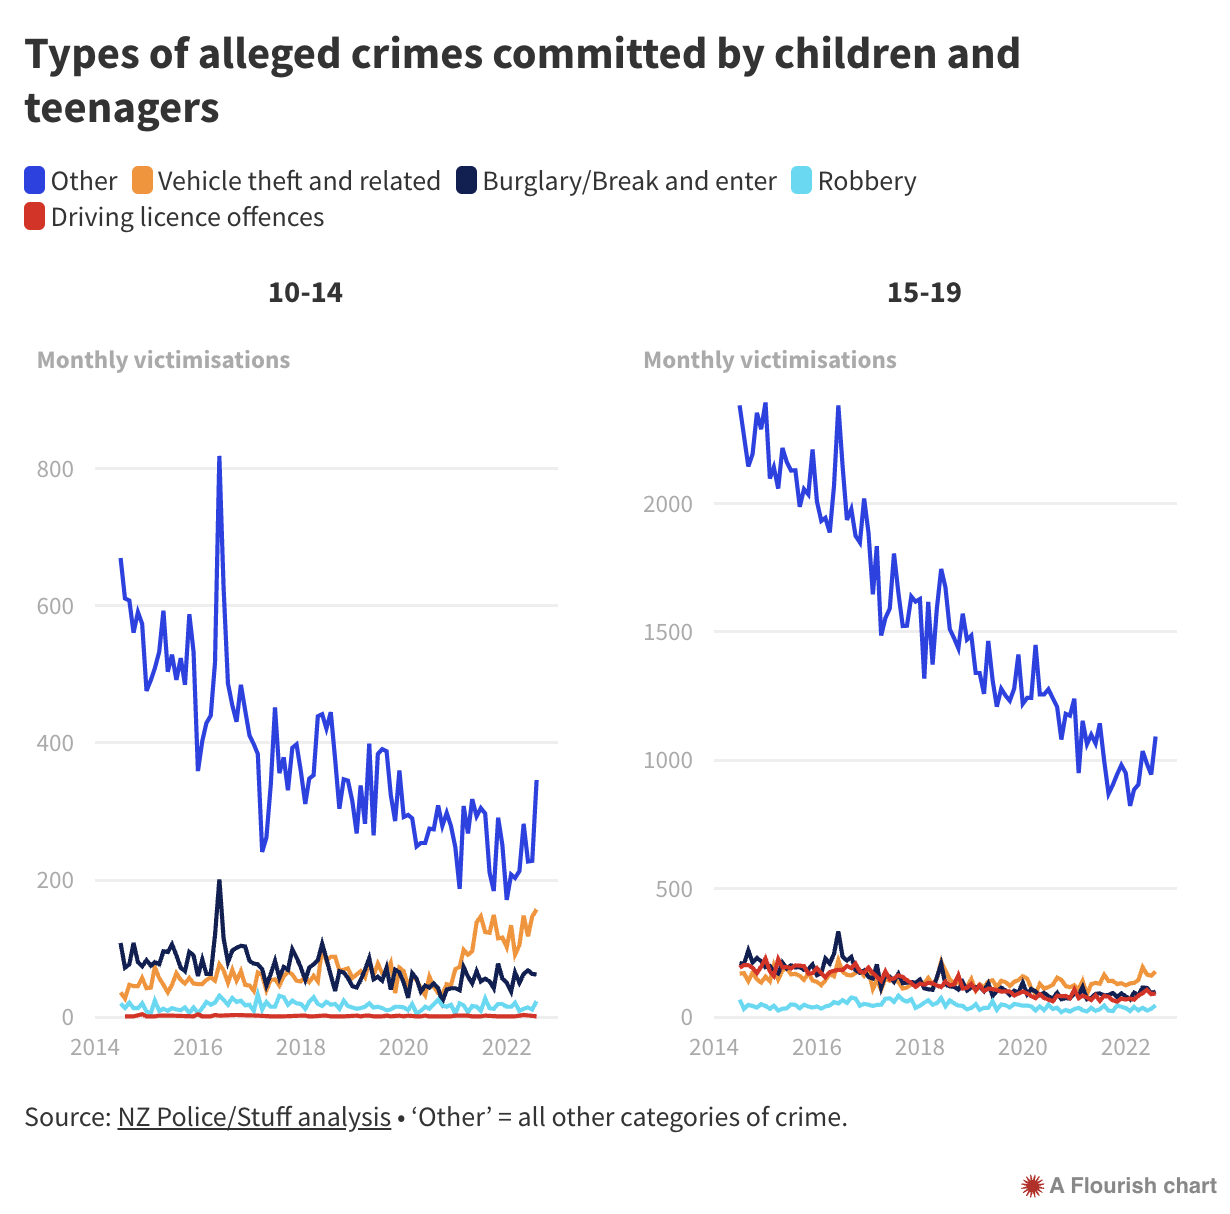
It’s clear that the orange line in the left panel is different from basically everything else. It looks as though the blue line might be going up, but it’s clearly still lower than it was in recent years.
That is, one category of crime in one age group is up. Overall, robberies and burglaries, even those specifically committed by young people, aren’t increasing, but these vehicle crimes are. They go on to say that ram-raids by young people are up; the absolute numbers are small, but these are serious crimes, with damage out of proportion to the amount stolen. It’s unlikely to be reporting bias — again, these are serious crimes that would usually be reported.
The data can’t really support a general ‘kids today’ narrative, but there is a real, specific, problem.
Thomas Lumley (@tslumley) is Professor of Biostatistics at the University of Auckland. His research interests include semiparametric models, survey sampling, statistical computing, foundations of statistics, and whatever methodological problems his medical collaborators come up with. He also blogs at Biased and Inefficient See all posts by Thomas Lumley »
From the linked article, the graph of how the police handle youth crime is insufficient given the preceding graphs
In its favour, the mouse-over provides the actual percentage for a band (which is hard to figure out on a stacked graph)
The main negative for me is that the earlier graphs show a clear downward trend in total crimes and changes in the types of crime. This graph shows variable percentages for the manner in which the crime is handled over time. It is hard to determine how many crimes are let off with an informal warning over time or whether there is any correlation between type/severity of crimes and handling method
Other than that, pretty good
4 years ago
You can do your own bespoke analysis from the options presented
https://www.police.govt.nz/about-us/publications-statistics/data-and-statistics/policedatanz
For ‘proceeedings’ you can choose the type of outcome from 6 choices
4 years ago
My concern is that the vertical axes on both graphs are very different (right=c.2.5 left), but suggest at a first glance that the Alleged Crimes for 10-14yo are roughly on a par with 15-19yo.
4 years ago
It is also worth mentioning the “aging effect” that teenagers aged 10-14 five years ago are not the same teenagers aged 10-14 now. It is thus interesting to see if there will be an increase in the vehicle crimes in the panel on the right in a few years time.
4 years ago