Posts written by Thomas Lumley (2645)

avatar

Thomas Lumley (@tslumley) is Professor of Biostatistics at the University of Auckland. His research interests include semiparametric models, survey sampling, statistical computing, foundations of statistics, and whatever methodological problems his medical collaborators come up with. He also blogs at Biased and Inefficient

May 1, 2015

If it seems too good to be true

This one is originally from the Telegraph, but it’s one where you might expect the local editors to exercise a little caution in reposting it

A test that can predict with 100 per cent accuracy whether someone will develop cancer up to 13 years in the future has been devised by scientists.

It’s very unlikely that the accuracy could be 100%. Even it is was,  it’s very unlikely that the scientists could know it was 100% accurate by the time they first published results.

One doesn’t need to go as far as the open-access research paper to confirm one’s suspicions. The press release from Northwestern University doesn’t have anything like the 100% claim in it; there are no accuracy claims made at all.

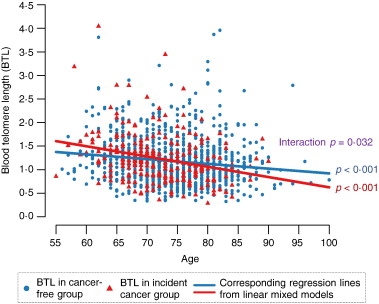
If you do go to the research paper, just looking at the pictures helps. In this graph (figure 1), the red dots are people who ended up with a cancer diagnosis; the blue dots are those who didn’t. There’s a difference between the two groups, but nothing like the complete separation you’d see with 100% accuracy.
1-s2.0-S2352396415001024-gr1

Reading the Discussion section, where the researchers tend to be at least somewhat honest about limitations of their research

Our study participants were all male and mostly Caucasian, thus studies of females and non-Caucasians are warranted to confirm our findings more broadly. Our sample size limited our ability to analyze specific cancer subtypes other than prostate cancer. Thus, caution should be exercised in interpreting our results as different cancer subtypes have different biological mechanisms, and our low sample size increases the possibility of our findings being due to random chance and/or our measures of association being artificially high.

Often, exaggerated claims in the media can be traced to press releases or to comments by researchers. In this case it’s hard to see the scientists being at fault; it looks as if it’s the Telegraph that has come up with the “100% accuracy” claim and the consequent fears for the future of the insurance industry.


(Thanks to Mark Hanna for pointing this one out on Twitter)



Have your say on the 2018 census


StatsNZ has a discussion forum on the 2018 Census

census

They say

The discussion on Loomio will be open from 30 Apr to 10 Jun 2015.

Your discussions will be considered as an input to final decision making.

Your best opportunity to influence census content is to make a submission. Statistics NZ will use this 2018 Census content determination framework to make final decisions on content. The formal submission period will be open from 18 May until 30 Jun 2015 via www.stats.govt.nz.

So, if you have views on what should be asked and how it should be asked, join in the discussion and/or make a submission


April 30, 2015

Half the median

From the Herald, under the headline “First-home buyers nab new home subsidies”

The AMP 360 First Home Buyer Affordability Report, published yesterday, shows housing remains “affordable” in all regions except Auckland and Queenstown.

The index tracked the lower-quartile (halfway between zero and the median) selling prices of houses and the median after-tax income of typical first-home buyers (a working couple both aged 25 to 29).

The lower quartile is not “halfway between zero and the median”. The lower quartile is the price that 25% of sales are below and 75% are above.

What’s more, the interpretation is obviously wrong. If you take the first Google link, at interest.co.nz, there’s a table by region, and it lists the lower quartile price for Auckland metro as $587000 and Auckland City as $681000. The Herald reports the median price often enough that they must know it isn’t over a million dollars.

While I’m complaining: the data table at interest.co.nz is in a state of sin. It’s not actually a data table; it’s a picture of a data table, a GIF image.

April 24, 2015

Graph of the week

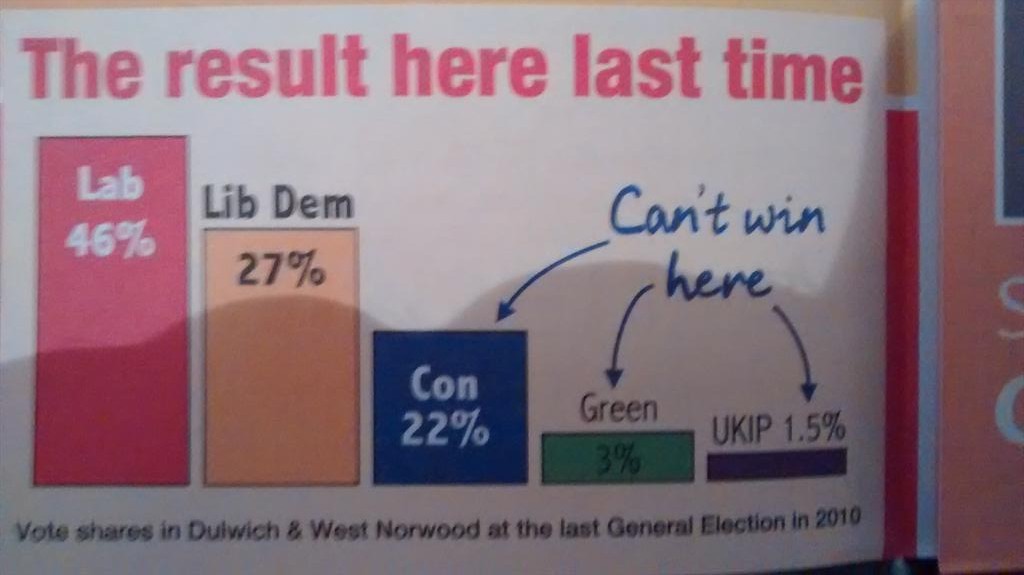
Via @ian_sample on Twitter, a UK election ad

libdem

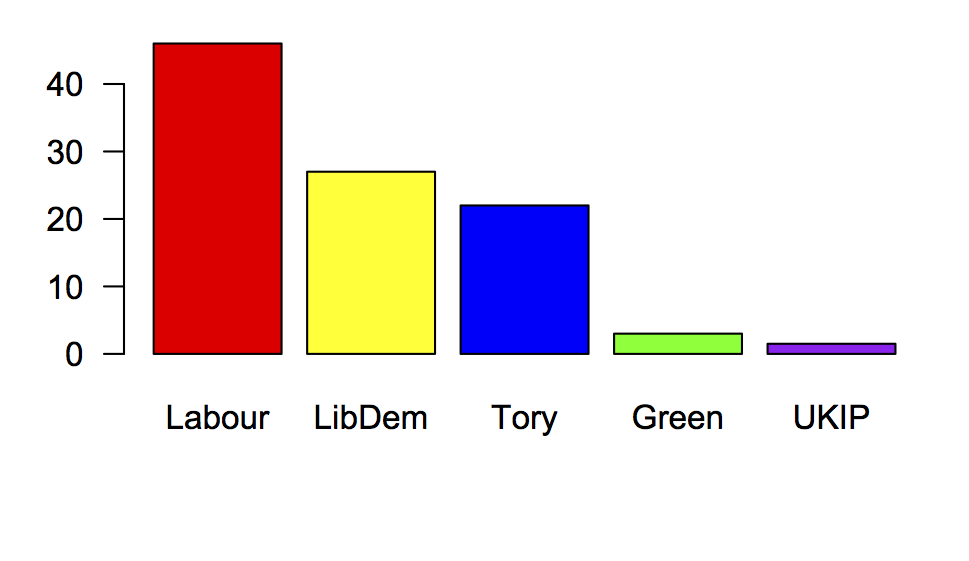
The basic approach has been traditional with the Liberal Party since before they merged with the Social Democratic Party; the accuracy has been, let’s say, variable. In this example, the 19-point difference between Labour and Liberal Democrats is shown as larger smaller than the 5-point difference between Liberal Democrats and Conservatives.

Here’s what those numbers really look like:
dulwich


April 23, 2015

Genetic determinism: mosquito bite edition

Q: Did you see that being bitten by mosquitoes is genetic?

A: What? Being outside without mosquito repellent, especially in the evening, is genetic now?

Q: No.

A: Living in places with lots little pools of standing water in the summer is genetic?

Q: No

A: Having wire mesh screens on your windows is genetic?

Q: Ok, yes, very droll. No, “Scientists have found that the chance of being bitten by a mosquito is written in the genes and some people are just more likely to be attacked no matter how much insect repellent they slap on.” What repellent did they use? DEET or one of those lemon things?

A: You mean this paper in PLoS One. They didn’t use any repellent.

Q: So they don’t really know that the usual repellents don’t work for some people because of genetics?

A: No. They didn’t look at that at all.

Q: Should I pretend to be shocked?

A: Don’t bother for now.

Q: Ok, who got bitten by the mosquitoes? You’re not going to tell me it was mice again, are you?

A: No, no mice, but also no bites. The researchers took smell samples from volunteers’ hands, and measured which samples the mosquitoes flew towards?

Q: How did they choose the people?

A: The comparisons were all within sets of female twins.

Q: Not really a representative population sample, was it?

A: It’s a reasonable approach for testing if there’s a genetic component to something: identical twins should be more similar than non-identical twins.

Q: And if it was completely genetic, identical twins would be identical, right?

A: Yes.

Q: So when they say “the mosquitoes would bite none, or both of the identical twins, but the results were mixed for the non-identical twins” that means it was completely genetic?

A:  No, the implication doesn’t work backwards that way. And also that’s a pretty serious exaggeration of what they found.

Q: But at least they did find a genetic component? Some people make a natural repellent?

A: There’s pretty good evidence of a genetic component, even a fairly big one. The article makes it clear that they don’t know whether some people make a repellent or whether other people make an attractant: “It is not known whether the differences between MZ and DZ twins is due to the presence or absence of attractive or repellent chemicals,”

Q: That seems pretty unambiguous, but it isn’t what the newspaper says.

A: No, it isn’t.

Q: Should I pretend to be shocked now?

A: I’d wait and get it over with all at once.

Q: The newspaper has a link to a related story. Should we read that?

A: Sure. Why not?

Q: It says “most of this research uses only one mosquito species. Switch to another species and the results are likely to be different.” Huh. I didn’t know that. Which species did the twin research use?

A: Aedes aegypti, a tropical mosquito (originally from Africa) that spreads yellow fever and dengue.

Q: Is Aedes aegypti common in New Zealand?

A: No, it could live in Northland but the biosecurity folks have stopped it invading so far.

Q: How about in the UK, where the news story came from initially?

A: No, the UK is too cold.

Q: So it’s not really relevant to mosquito bites for their readers?

A: It’s still important as a global health issue, but no, not all that relevant from a mundane viewpoint of actual day-to-day utility.

Q: Ok, is now the time to pretend to be shocked?

A: If it makes you feel better, sure.


Don’t hold your breath

The story at the Herald (from the Telegraph) starts off dramatically, then walks its claims back, but not back far enough.

First off, the dramatic claim:

Asthma could be cured within five years after scientists discovered what causes the condition and how to switch it off.

Then the description of what the researchers actually did: ‘identified which cells cause the airways to narrow when triggered by irritants like pollution.’ That’s less dramatic; it’s also not true. The researchers looked at the same cells everyone else looks at. What they did was show that a molecule on the surface of these cells (“calcium-sensing receptor”) appears to be central to the triggering.

The other main selling point:

Crucially, drugs already exist which can deactivate the cells. They are known as calcilytics and are used to treat people with osteoporosis.

In fact, they aren’t used to treat people with osteoporosis. As the research paper says, they “were initially developed as anti-osteoporotic drugs and reached phase 2 clinical trials for this purpose”. That is, they didn’t work. They might work for asthma, but it’s not like finding a new use for an actually-marketed drug — especially as the drugs would have to be inhaled, something that hasn’t been studied in humans at all. If everything goes right, it might be possible to get the safety and effectiveness studies done and the drug approved in five years, but that’s pretty optimistic.

Also, the drugs are promising, but not as promising as the story says:

But when calcilytic drugs are inhaled, it deactivates the cells and stops all symptoms.

Most of the research was either in isolated cells (which don’t have symptoms) or in non-asthmatic mice. One experiment, in asthmatic mice, showed a reduction in airway resistance with the drugs, but not down to the level in non-asthmatic mice.  And airway resistance isn’t the same as symptoms. And these are mice.

A comment from Asthma UK raises another point that hasn’t appeared so far

“Five per cent of people with asthma don’t respond to current treatments so research breakthroughs could be life changing for hundreds of thousands of people. If this research proves successful we may be just a few years away from a new treatment for asthma”

Inhaled steroids for asthma are already pretty effective. While they aren’t enough for everyone, a more common problem is the hassle of using the inhaler twice a day every day when you’re healthy, to prevent relatively rare asthma attacks.  The new drugs will likely have the same problem  — it’s a treatment, not a cure — and their real potential isn’t for everyone with asthma, but for the relatively small subset where current treatments don’t work.


April 22, 2015

Briefly

  • From the BBC: The illusion of control and how it makes us feel better. That’s part of the benefit of real-time transit prediction: knowing how long you have to wait makes you feel more in control, as long as the system is good enough not to shatter the illusion.
  • Social networks to visualise relationships between allegedly-independent landlords
April 15, 2015

Briefly

  • Good article in New York Times about why ‘survival rates’ aren’t the best way to assess progress in cancer. Same explanation that I’ve covered before several times: survival can improve when all you do is move diagnosis earlier without affecting disease or death at all
  • Whether state government subsidy of tuition in the US is increasing or decreasing seems like it should be an easy question. Not so much.
  • Comparing prices from different years without inflation adjustment is like comparing prices from different countries without currency conversion.  Any inflation adjustment is better than none, but if you’re interested in different ways it can be done there’s a fairly comprehensible review by the UK Statistics Authority
  • Headlines based on bogus polls are back. At Stuff, an implausible headline from a survey created to publicise a dating app and National Cheese Week. Celebrate National Library Week instead.
April 14, 2015

Cumulative totals go up

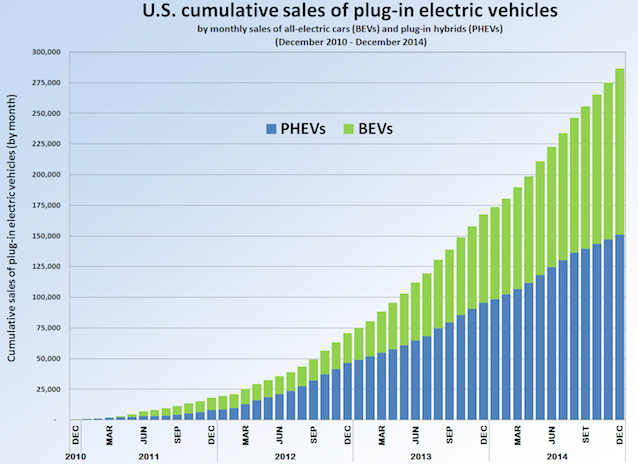
From ThinkProgress  (graph from Wikipedia) “U.S. plug-in electric vehicle cumulative sales have soared in the past few years, thanks in part to rapidly falling battery prices” and “A major reason for the rapid jump in EV sales is the rapid drop in the cost of their key component -– batteries.”

US_PEV_Sales_2010_2014

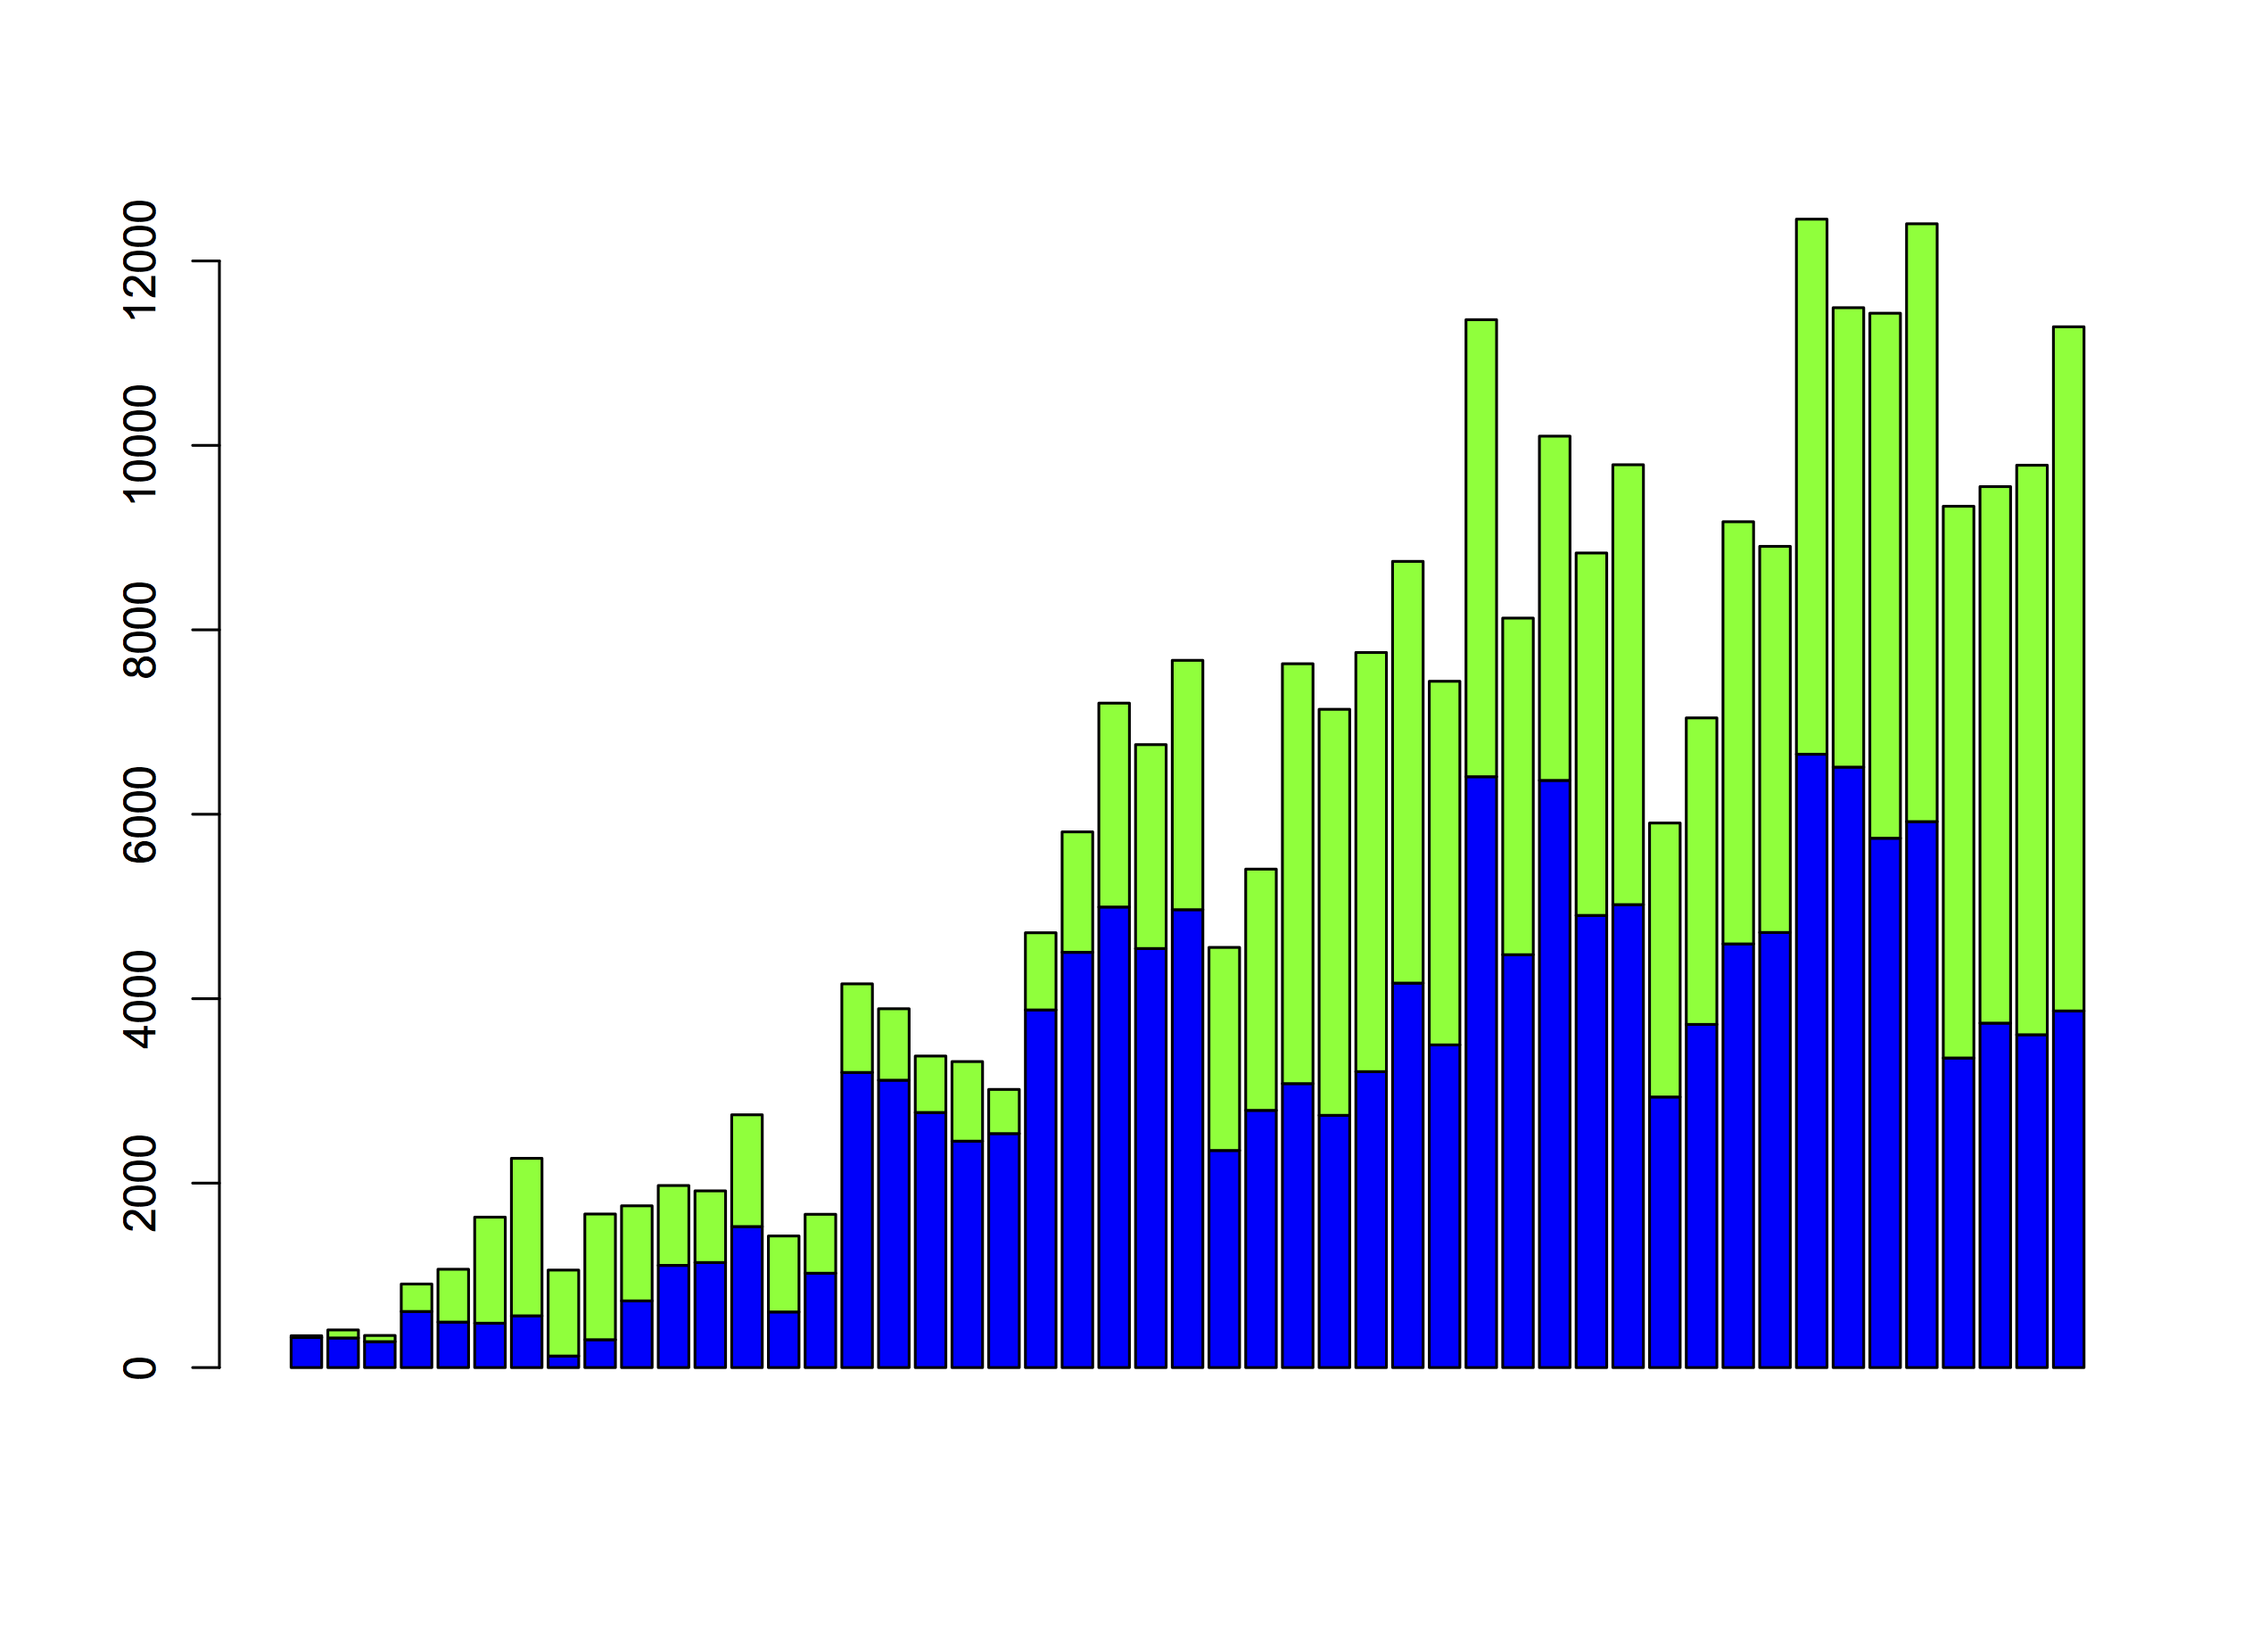
From a cumulative graph it’s hard to tell whether the cumulative sales have soared due to rapidly falling battery prices or just due to the fact that cumulative sales have to increase, but the past few years look pretty much like straight lines to me.

Here’s the noncumulative monthly sales, with the same colour-coding: there hasn’t been a big increase in the rate of sales during 2013 or 2014, so it’s not clear there’s much for falling battery prices to explain. Beyond the graph, for the first three months of 2015 there have been slightly few sales than in the first three months of 2014.

noncumulative

Cumulative sales of a new technology with sizeable network effects are important: it matters how many plug-in vehicles are out there. A cumulative graph is still a bad way to see patterns.


Northland school lunch numbers

Last week’s Stat of the Week nomination for the Northern Advocate didn’t, we thought point out anything particularly egregious. However, it did provoke me to read the story — I’d previously only  seen the headline 22% statistic on Twitter.  The story starts

Northland is in “crisis” as 22 per cent of students from schools surveyed turn up without any or very little lunch, according to the Te Tai Tokerau Principals Association.

‘Surveyed’ is presumably a gesture in the direction of the non-response problem: it’s based on information from about 1/3 of schools, which is made clear in the story. And it’s not as if the number actually matters: the Te Tai Tokerau Principals Association basically says it would still be a crisis if the truth was three times lower (ie, if there were no cases in schools that didn’t respond), and the Government isn’t interested in the survey.

More evidence that number doesn’t matter is that no-one seems to have done simple arithmetic. Later in the story we read

The schools surveyed had a total of 7352 students. Of those, 1092 students needed extra food when they came to school, he said.

If you divide 1092 by 7352 you don’t get 22%. You get 15%.  There isn’t enough detail to be sure what happened, but a plausible explanation is that 22% is the simple average of the proportions in the schools that responded, ignoring the varying numbers of students at each school.

The other interesting aspect of this survey (again, if anyone cared) is that we know a lot about schools and so it’s possible to do a lot to reduce non-response bias.  For a start, we know the decile for every school, which you’d expect to be related to food provision and potentially to response. We know location (urban/rural, which district). We know which are State Integrated vs State schools, and which are Kaupapa Māori. We know the number of students, statistics about ethnicity. Lots of stuff.

As a simple illustration, here’s how you might use decile and district information.  In the Far North district there are (using Wikipedia because it’s easy) 72 schools.  That’s 22 in decile one, 23 in decile two, 16 in decile three, and 11 in deciles four and higher.  If you get responses from 11 of the decile-one schools and only 4 of the decile-three schools, you need to give each student in those decile-one schools a weight of 22/11=2 and each student in the decile-three schools a weight of 16/4=4. To the extent that decile predicts shortage of food you will increase the precision of your estimate, and to the extent that decile also predicts responding to the survey you will reduce the bias.

This basic approach is common in opinion polls. It’s the reason, for example, that the Green Party’s younger, mobile-phone-using support isn’t massively underestimated in election polls. In opinion polls, the main limit on this reweighting technique is the limited amount of individual information for the whole population. In surveys of schools there’s a huge amount of information available, and the limit is sample size.