Posts written by Thomas Lumley (2645)

avatar

Thomas Lumley (@tslumley) is Professor of Biostatistics at the University of Auckland. His research interests include semiparametric models, survey sampling, statistical computing, foundations of statistics, and whatever methodological problems his medical collaborators come up with. He also blogs at Biased and Inefficient

May 3, 2014

White House report: ‘Big Data’

There’s a new report “Big Data: Seizing Opportunities, Preserving Values” from the Office of the President (of the USA).  Here’s part of the conclusion (there are detailed recommendations as well)

Big data tools offer astonishing and powerful opportunities to unlock previously inaccessible insights from new and existing data sets. Big data can fuel developments and discoveries in health care and education, in agriculture and energy use, and in how businesses organize their supply chains and monitor their equipment. Big data holds the potential to streamline the provision of public services, increase the efficient use of taxpayer dollars at every level of government, and substantially strengthen national security. The promise of big data requires government data be viewed as a national resource and be responsibly made available to those who can derive social value from it. It also presents the opportunity to shape the next generation of computational tools and technologies that will in turn drive further innovation.

Big data also introduces many quandaries. By their very nature, many of the sensor technologies deployed on our phones and in our homes, offices, and on lampposts and rooftops across our cities are collecting more and more information. Continuing advances in analytics provide incentives to collect as much data as possible not only for today’s uses but also for potential later uses. Technologically speaking, this is driving data collection to become functionally ubiquitous and permanent, allowing the digital traces we leave behind to be collected, analyzed, and assembled to reveal a surprising number of things about ourselves and our lives. These developments challenge longstanding notions of privacy and raise questions about the “notice and consent” framework, by which a user gives initial permission for their data to be collected. But these trends need not prevent creating ways for people to participate in the treatment and management of their information.

You can also read comments on the report by danah boyd, and the conference report and videos from her conference’The Social, Cultural & Ethical Dimensions of “Big Data”‘ are now online.
The all-purpose ordinal bar chart

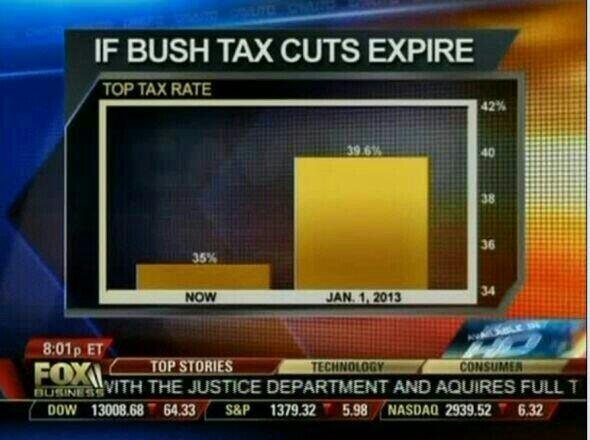
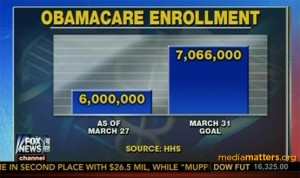
Edward Tufte coined the phrase ‘the Pravda school of ordinal graphics’, reminding us that numbers have a magnitude as well as a direction.  Nowadays, he might have named the problem for  Fox News.

I wrote about this one last month

obamacareenrollment-fncchart-300x178

Today’s (historical) effort, via Ben Atkinson

Bmo62lrCUAEXZqa


Interestingly, although they could use exactly the same barchart every time, they don’t.  The Obamacare chart representing the data ratio  7066/6000 = 1.17 by a height ratio of  2.8; the tax cut chart represents the very similar data ratio 36.9/35 = 1.13 by a height ratio of 5.

“Waste, Fraud, and Abuse” is a common slogan for cutting government spending. Here, the fraud and abuse is obvious in the bar charts, but I hadn’t realised the extent of wasted effort that must go into redrawing it each time.


May 2, 2014

Animal testing

Labour want to prevent animal testing of legal highs. That’s a reasonable position. They are quoted by the Herald as saying “there is no ethical basis for testing legal highs on animals”. That’s a completely unreasonable position: testing on animals prevents harm to humans, and the fact you don’t agree with something doesn’t mean it lacks an ethical basis.

More important is their proposed legislation on this issue, with the key clause

Notwithstanding anything in the Psychoactive Substances Act 2013, no animal shall be used in research or testing for the purpose of gaining approval for any psychoactive substance as defined in section 9 of the Psychoactive Substances Act 2013.”

Assuming that the testing is done overseas, which seems to be National’s expectation, this legislation wouldn’t prevent animal use in testing.  The time when a drug dealer would want to use animals in testing is for initial toxicity: does the new drug cause liver or kidney damage, or have obvious long-term neurological effects that might reduce your customer base unduly.  The animal data wouldn’t be sufficient on their own, because there’s some variation between species, especially in side-effects mediated by the immune system (don’t Google “Stevens-Johnson syndrome” while you’re eating). But animal data would be relevant, and many plausible candidates for therapeutic medications fail early in development because of this sort of toxicity.

Whether animals were used for toxicity testing or not, it would still be necessary to test in humans to find the appropriate dose and the psychoactive effects in people. Depending on the regulations, it might well also be necessary to test moderate overdoses in humans — especially as it appears most of the adverse effects of the synthetic cannabis products are in people taking quite high doses.  That’s the sort of data that might be required in an application for approval of a psychoactive substance.

Labour’s proposal would mean that the animal test data could not be used for gaining approval, and would also mean that the regulations could not require animal data.  But I can’t see much reason it would discourage someone from using animals in initial toxicity testing, which is the only place animal testing would really be relevant.

Mammography ping-pong

Hilda Bastian at Scientific American

It’s like a lot of evidence ping-pong matches. There are teams with strongly held opinions at the table, smashing away at opposing arguments based on different interpretations of the same data.

Meanwhile, women are being advised to go to their doctors if they have questions. And their doctors may be just as swayed by extremist views and no more on top of the science than anyone else.

She explains where the different views  and numbers come from, and why the headlines keep changing.

How to fix academic press releases

In the ‘Rapid Responses’ (aka ‘rabid responses’) section of BMJ, Ben Goldacre has two suggestions:

Firstly, all press releases in all academic journals should be made publicly available online, alongside the academic journal article they relate to, so that everyone can see whether the press release contained misrepresentations or exaggerations. Secondly, all academic journal press releases should give named authors, who take full responsibility for the contents, including at least one significant author from the academic paper itself.

This isn’t a complete fix, because the culpable press releases are as likely to come from universities as journals, but it would be straightforward to implement, moderately effectively, and I can’t think of any good reason not to do it.

Excellent display of sampling error by New York Times


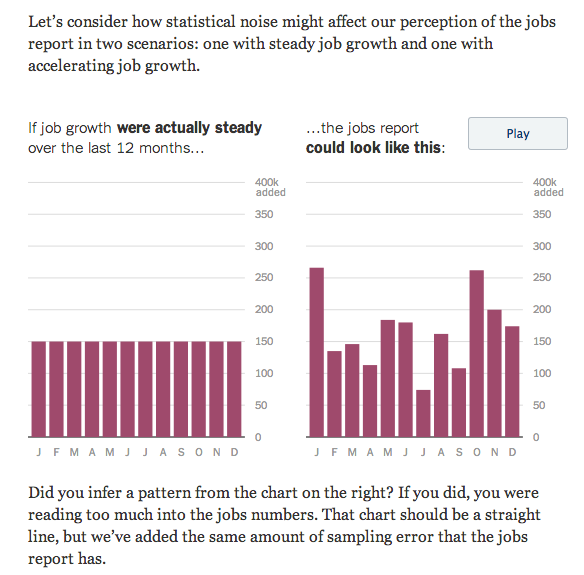
To help with interpreting trends in unemployment, the New York Times has two animated bar charts showing the impact of sampling uncertainty. Here’s a snapshot of one of them (click for the real thing)

jobs


There’s a lot of uncertainty in ‘job growth’ figures from a single month, and a lot more uncertainty in month to month changes in estimates of job growth.

May 1, 2014

Overstating income inequality

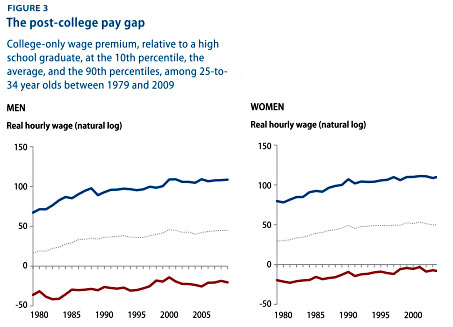
The graph below is from Kevin Drum at Mother Jones, and is supposed to show US income inequality among college graduates (giving the mean and 10th and 90th percentiles) and between college graduates and people with only a high school education (the zero line). The graph is originally from a report by the Center for American Progress (page 7).  Look at the labelling of the y-axis.

blog_college_premium_distribution


As Chad Orzel points out, there is no way these numbers can be right. The blue lines for both men and women cross 100. That should mean the logarithm of the ratio of 90th percentile college-graduate income to high-school graduate income is 100; the top 10% of college graduates would have to earn at least 25 million trillion trillion trillion times more than the average for people with only  a high-school education.

Even in the US, income inequality isn’t that bad.

April 29, 2014

Briefly

Justice edition

  • From the BBC, a historical story about DNA evidence incriminating someone who had been dead for three weeks at the time of the crime.  Even with modern techniques, the upper bound on the strength of DNA evidence is incompetence or fraud (which has happened) rather than random false matches (which may not ever have happened with good samples)


  • A new research paper argues that 4% of those sentenced to death in the US would have their convictions overturned if they waited long enough.  That’s not the same as 4% of them being innocent, but it’s still a problem.


  • It’s hard to estimate the role of luck in success, because luck isn’t controllable. Ed Yong writes about a new paper where researchers experimentally randomised people to be lucky, and how much it mattered.
April 28, 2014

Income inequality perception

If you ask people in the US to estimate the income of someone at the 80th percentile, they underestimate it, thus underestimating income inequality (PDF).

However, if you specify a dollar amount and ask how many people have income above that amount, you get an underestimate of high incomes.

The take-home message? It’s hard to design good survey questions.

Sibling rivalry

The Herald’s story on birth order and education was nominated for Stat of the Week, which is perhaps a bit harsh.   Here’s the particular sentence (in bold) that attracted criticism, in its context

Eldest children were 7 per cent more likely to aspire to stay on in education than younger siblings and first-born girls were 13 per cent more ambitious than first-born boys, findings from the Institute for Social and Economic Research at the UK’s University of Essex show.

The ‘more ambitious’ is just elongated-yellow-fruit syndrome — it means exactly the same as the ‘more likely to aspire to stay on in education’ earlier in the sentence — not that I’m in a strong position when it comes to criticizing elegance of writing. The researchers used survey data where British kids had been asked at age 13 whether they planned to go into tertiary education, and related their answer to family structure and other variables (PDF).

The sentence in bold is not quite correct — the 13% difference is in the report, but it’s the difference between all girls and all boys averaged over birth order, not between first-born girls and boys. Because of the way probabilities are limited at 100%, the difference between first-born girls and boys will be somewhat smaller, though that’s a pretty technical consideration.  What the figures do make clear is that the difference between first-born and later-born children is quite a bit smaller than the difference between boys and girls.

The Guardian has a similar story, with very similar phrasing, though it’s not clear who borrowed from whom. Where the Herald is different is that the illustrative examples are better. The Herald‘s examples look as though they were chosen, appropriately, from famous Kiwis without regard to birth order; the Guardian has gone in for confirmation bias, choosing famous first-borns.