Olympic and Paralympic success (per capita)
From Stats New Zealand
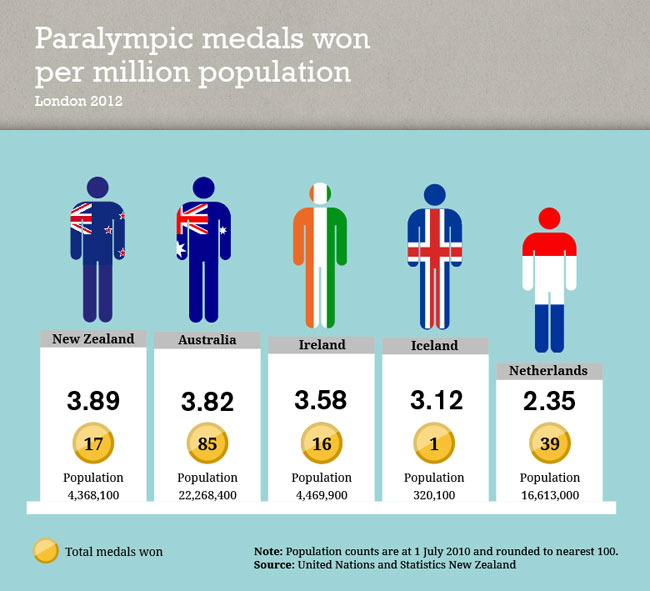
Paralympic medals per capita
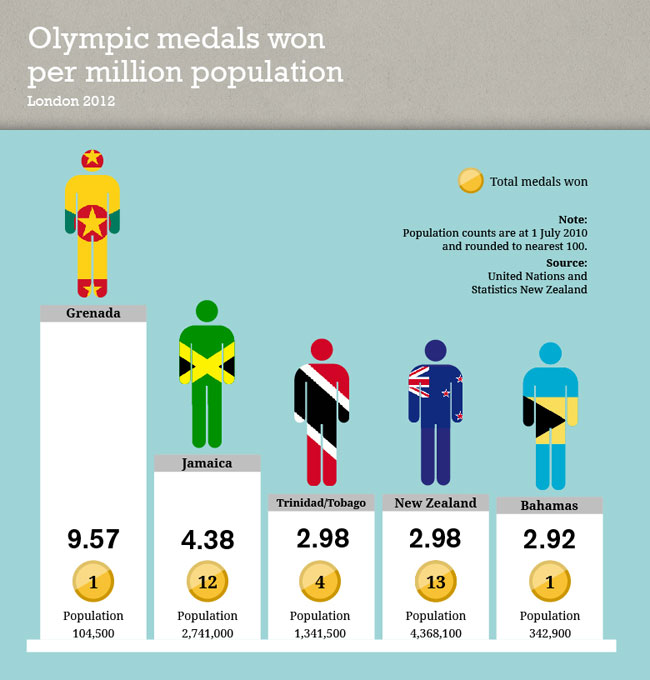
and (you’ve seen this before) Olympic medals per capita
Congratulations to the athletes.
This being StatsChat, I will note that it’s not obvious where the bars begin and end in these plots (is the white pedestal included? Is the grey top included? How about the flag-wrapped athlete?), and however I try to do it, the Grenada bar seems to measure less than twice the length of the Jamaica bar, which shouldn’t be the case.
Thomas Lumley (@tslumley) is Professor of Biostatistics at the University of Auckland. His research interests include semiparametric models, survey sampling, statistical computing, foundations of statistics, and whatever methodological problems his medical collaborators come up with. He also blogs at Biased and Inefficient See all posts by Thomas Lumley »
It looks like each white bar (not counting dias) has had ~20 pixels added to it (based on counting the pixels of the first three bars and relating their ratios to 9.57/4.38 and 9.57/2.98). I would guess it was added to make room for the text/graphic on the bar.
13 years ago
From @StatisticsNZ “The bar lengths are just rough representations rather than exact differences”.
⟨disappointed look⟩
13 years ago