Posts written by Thomas Lumley (2645)

avatar

Thomas Lumley (@tslumley) is Professor of Biostatistics at the University of Auckland. His research interests include semiparametric models, survey sampling, statistical computing, foundations of statistics, and whatever methodological problems his medical collaborators come up with. He also blogs at Biased and Inefficient

April 13, 2018

Briefly

An ‘insufficient data’ edition

  • Data quality matters: the high rate of death reported for women giving birth in Texas seems to have been partly a data entry error.  Researchers say Approximately half (50.3%) of obstetric-coded deaths showed no evidence of pregnancy within 42 days, and a large majority of these incorrectly indicated pregnancy at the time of death. That is, these were real deaths, but not related to pregnancy. The research paper also says “Texas’ current electronic death registration system displays pregnancy status options as a dropdown list. The “pregnant at the time of death” option is directly below the “not pregnant within the past year” option”  Via Ars Technica.
  • The new cancer drug pembrolizumab (Keytruda) is spectacularly effective across a wide range of tumours, but typically for a minority of patients. In the US, the FDA has approved its marketing for any tumour with a particular defect in DNA repair, but testing for that defect is not as reliable as one would like. The story in Nature News focuses on false negatives: people who would benefit but aren’t found by the test.  In New Zealand, false positives are also important: these new drugs would be more cost-effective and so more likely to be subsidised if you could avoid giving them to people who wouldn’t benefit.
  • There’s a new claim that kumara got to the Pacific Islands before people did, in the New York Timesbased on this research. Basically, the DNA from samples collected by the first European botanists in Polynesia has quite a lot of minor differences from modern sweet potatoes in the Americas, suggesting that its ancestors had been separated from the rest of the sweet potato lineage for over 100,000 years.  However, Lisa Matisoo-Smith and Michael Knapp from Otago argue that the samples are old enough — nearly 250 years — that the DNA will have been degraded and needs to be analysed with special obsessively-detailed protocols for old DNA.  That is, the evidence isn’t nearly strong enough to overturn the other reasons for thinking kumara were brought from South America by humans.
April 10, 2018

Algorithmic Impact Assessments

There’s a new report from New York University’s AI Now Institute, giving recommendations for algorithmic impact assessments (PDF). Worth reading for anyone who is or should be interested in criteria for automated decision systems. As the researchers say:

AIAs will not solve all of the problems that automated decision systems might raise, but they do provide an important mechanism to inform the public and to engage policymakers and researchers in productive conversation. With this in mind, AIAs are designed to achieve four key policy goals:

  1. Respect the public’s right to know which systems impact their lives by publicly listing and describing automated decision systems that signi cantly a ect individuals and communities;
  2. Increase public agencies’ internal expertise and capacity to evaluate the systems they build or procure, so they can anticipate issues that might raise concerns, such as disparate impacts or due process violations;
  3. Ensure greater accountability of automated decision systems by providing a meaningful and ongoing opportunity for external researchers to review, audit, and assess these systems using methods that allow them to identify and detect problems; and
  4. Ensure that the public has a meaningful opportunity to respond to and, if necessary, dispute the use of a given system or an agency’s approach to algorithmic accountability.

(via Harkanwal Singh)

The Immigration NZ model: recap

Original post

To begin with: Yes, everyone being evaluated was already eligible for deportation.

There were two main categories of feedback on this point: the ‘Manus Island’ tendency, arguing they’re all guilty and so it doesn’t matter how you treat them, and the people pointing out that a model could perhaps make better decisions that an individual immigration officer.  The first group have, I think, missed an important issue: the arguments given by Immigration NZ for this model being a good thing would apply anywhere else in the immigration system or the justice system where there is currently discretion — eg, police discretion to prosecute.

The second group do have a good point (which is why it’s a point I made in my original post), but only if the model is constructed well and, ideally, audited.  As I said, it didn’t look like we had that sort of model. Today, we got more information about the model, thanks to Radio NZ’s Morning Report. Here’s a PDF of the spreadsheet and the briefing document (dated April 6, so potentially cleaned up after the initial publicity).  It’s a spreadsheet, simply adding up points for a bunch of categories, with minimal scaling for importance based on Immigration NZ’s expert knowledge or fitting to empirical data.

It’s not especially surprising that the harm model is a bit crap. What is surprising is that the Minister thinks this is a good thing

He said he was concerned about misconceptions around the pilot programme.

“Some people were talking about a sophisticated algorithm some people were talking about racial profiling, both of those are incorrect and I think it’s very important that the public know exactly what this is, and what it isn’t,” he said.

“This is not modelling or a predictive tool – this is a spreadsheet that they put some information into and they rank people based on that information.”

That’s not a defence; it’s an indictment.

April 9, 2018

Briefly

In a 2003 study, 19 percent of teens who claimed to be adopted actually weren’t, according to follow-up interviews with their parents. When you excluded these kids (who also gave extreme responses on other items), the study no longer found a significant difference between adopted children and those who weren’t on behaviors like drug use, drinking and skipping school


April 5, 2018

Immigration NZ and the harm model

Immigration NZ, by and large, has been good at transparency in the past– you may think some of their policies are inhumane or arbitrary, but you can easily find out what their policies are.  That’s a pleasant contrast to the other place I’ve lived as an immigrant. Even their operational manual is available online. So, when you hear in this morning’s Radio NZ story “Immigration NZ using data system to predict likely troublemakers”, you might want to give them the benefit of the doubt and assume they are just taking more steps to make their decision procedures explicit.

But then you get to the quotes

“We will model the data sets we have available to us and look at who or what’s the demographic here that we’re looking at around people who are likely to commit harm in the immigration system or to New Zealand,” he said.

“Things like who’s incurring all the hospital debt or the debt to this country in health care, they’re not entitled to free healthcare, they’re not paying for it.

“So then we might take that demographic and load that into our harm model and say even though person A is doing this is there any likelihood that someone else that is coming through the system is going to behave in the same way and then we’ll move to deport that person at the first available opportunity so they don’t have a chance to do that type of harm.

At the very least, they are saying that you can have two people with the same record of what they’ve done in New Zealand, in the same circumstances, and one of them will be deported and the other not deported based on, say, country of origin or age.  It’s true that to be deported you have to have done something that gives them a justification — but “at the first available opportunity” is fairly broad when you’re Immigration NZ. And if  they’re talking about people who are “not entitled to free health care”, then “immigrants” is the wrong term. [update: Radio NZ have now changed the first word of the story from “Immigrants” to “Overstayers”. Apart from that issue of terminology the same comments still apply]

So, how does this differ from, say, the IRD using statistical models to target people with higher probability of having committed tax fraud for auditing? There are two important differences in principle. The first is that the IRD is interested in auditing people who have already committed tax fraud, not people who might do so in the future. The second is that the consequences of being caught don’t depend on the predicted probability. Immigration NZ, on the other hand, seems to be interested in treating people differently based on things they haven’t done but might do in the future.

Now, Immigration NZ has to deport some people. It has to make decisions about who to let into the country in the first place, and who to give extensions of visas, or grant residency. That’s what it’s for. These decisions will have serious impacts on the lives of would-be immigrants — ranging from those who have an application for residency denied to those who don’t even bother applying because there’s no hope.

Since Immigration NZ does make these sorts of decisions, do we want them to do it based on a statistical model? That’s actually a serious question. It depends. There are at least three issues with the model: the ‘transparency‘ issue, the ‘audit‘ issue and the ‘allowable information‘ issue. All of these are also a problem with decisions made by humans.

The ‘allowable information‘ issue is ‘racial profiling’. As a society, we’ve decided that some information just should not be used to make certain types of decisions — regardless of whether it’s genuinely predictive. For anyone other than Immigration NZ, country of origin would be in that category. Invoking a statistical model — essentially, writing it down in a flowchart — wouldn’t be a justification. To some extent Immigration NZ is required to treat prospective immigrants differently based on their country of origin; the question is how far they can go. The Human Rights Commission is likely to have an opinion here, and it’s quite possible they’ll say Immigration NZ has gone too far.

The ‘transparency‘ issue is that the model should be public.  Voters should be able to find out their government’s policy on deportations; people trying to immigrate should know their chances. The tax office have an argument for keeping their model secret; they don’t want people to be able to tweak their accounts to escape detection. The immigration office don’t.

The ‘audit‘ issue is related but more complicated.  Immigration NZ need to know (and should have independent verification, and should tell us) how accurate the model is and what inputs it’s sensitive to, and how reliable the data are. How many of the deported people does the model say would have committed serious crimes? How much unnecessary government expenditure does it predict they will require? How well do these predictions match up to reality? Are there relevant groups of people for whom the model is importantly less accurate — people from particular countries, people with or without family in NZ, etc — so that the costs of automated decision making aren’t justified by benefits.  And to what extent do the inputs to the model suffer from self-reinforcing bias?

The classic problem of self-reinforcing bias comes from a different context, predictions of future offences by convicted criminals. We don’t have data on who commits crimes, only on who is arrested, charged, or convicted.  To the extent that people from particular demographic groups are more likely to attract the notice of the justice system, it will look as if they are more likely to commit crime, and this will lead to more targeted enforcement. And so on, round and round.

In the immigration setting, we’d be concerned about any of the criteria that can be affected by current immigration enforcement practice — if people are currently more likely to be deported or more likely to have applications refused based subjectively on country of origin, this will tend to show up in the new models.  Healthcare costs, on the other hand, aren’t directly affected by Immigration NZ decisions and so don’t have the same self-reinforcing vicious circle — though failing to pay the bills might.

Having a statistical model isn’t necessarily a bad thing, just like having a formal flowchart or points system isn’t necessarily a bad thing.  The model can have various sorts of bias, but so can actual human immigration officers.  In contrast to some of the social policy models, this model isn’t being used to make new distinctions in a setting where everyone used to be treated uniformly — the immigration system has always made individual decisions about visas and deportations.

In principle, a model  could be developed with care to include only the right sorts of inputs, to predict outputs that aren’t subject to vicious circles,  to have clear and reliably estimated costs and benefits associated with decisions, and to be open to independent audit. Such a model would be more accountable to the Minister, Parliament, and the nation than the decisions of individual immigration officers.

The fact that we, and the incoming Minister, only found out about the system this morning doesn’t suggest we’ve got that sort of model. Neither does the disappearance of data from their website, where they’ve just discovered privacy problems (without all that much effect, since the data are still up at archive.org). Nor the explicit use of country of origin. Nor the spokesperson’s complete lack of reference to safeguards in the modelling process, or the argument that they can’t be doing racial profiling because they also use gender, age and type of visa in the model.

March 28, 2018

Cycling for work or play

Auckland Transport publish data from cycle counters on various bike paths. They’re most interested in trends over time (increasing) and perhaps in seasonal variation (more in summer).

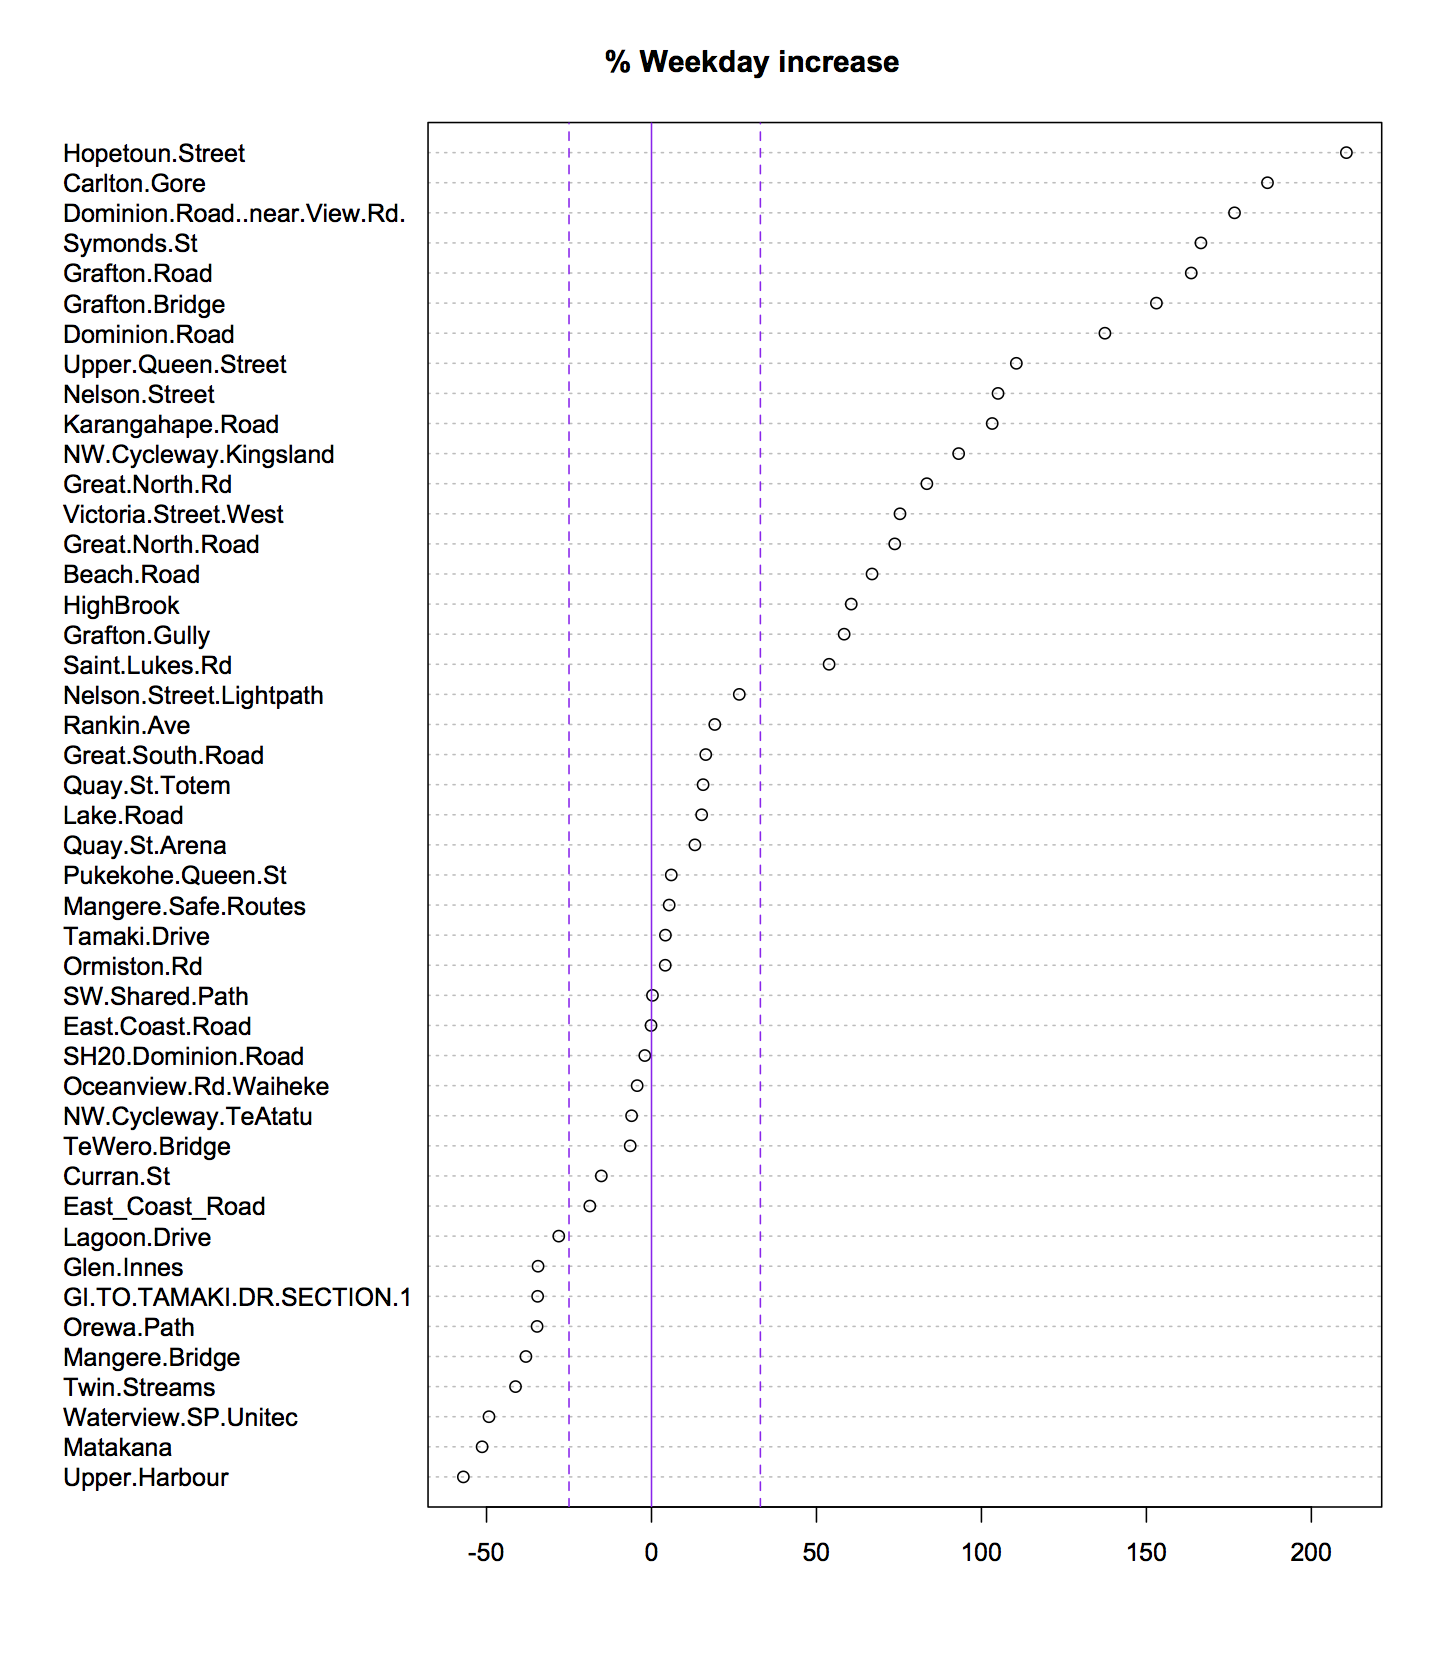
Here’s a look at weekday vs weekend counts using data from the start of 2016 to now (click to embiggen).

There are some paths that are clearly used primarily by commuters, with more than twice the average traffic on a weekday vs weekend. There are also some that are mostly used at the weekend, such as Matakana, Upper Harbour, and Mangere Bridge.  And some, like the Lightpath, that get used all the time.

Note: while it’s great that Auckland Transport publishes these data, the data would be easier to reuse if the names they used for each counter were consistent over time (eg: “Tamaki Dr” vs “Tamaki Drive”, or “Nelson Street Lightpath Counter Cyclists” vs “Nelson Street Lightpath Cyclists”)


March 26, 2018

Accurate graphical rhetoric

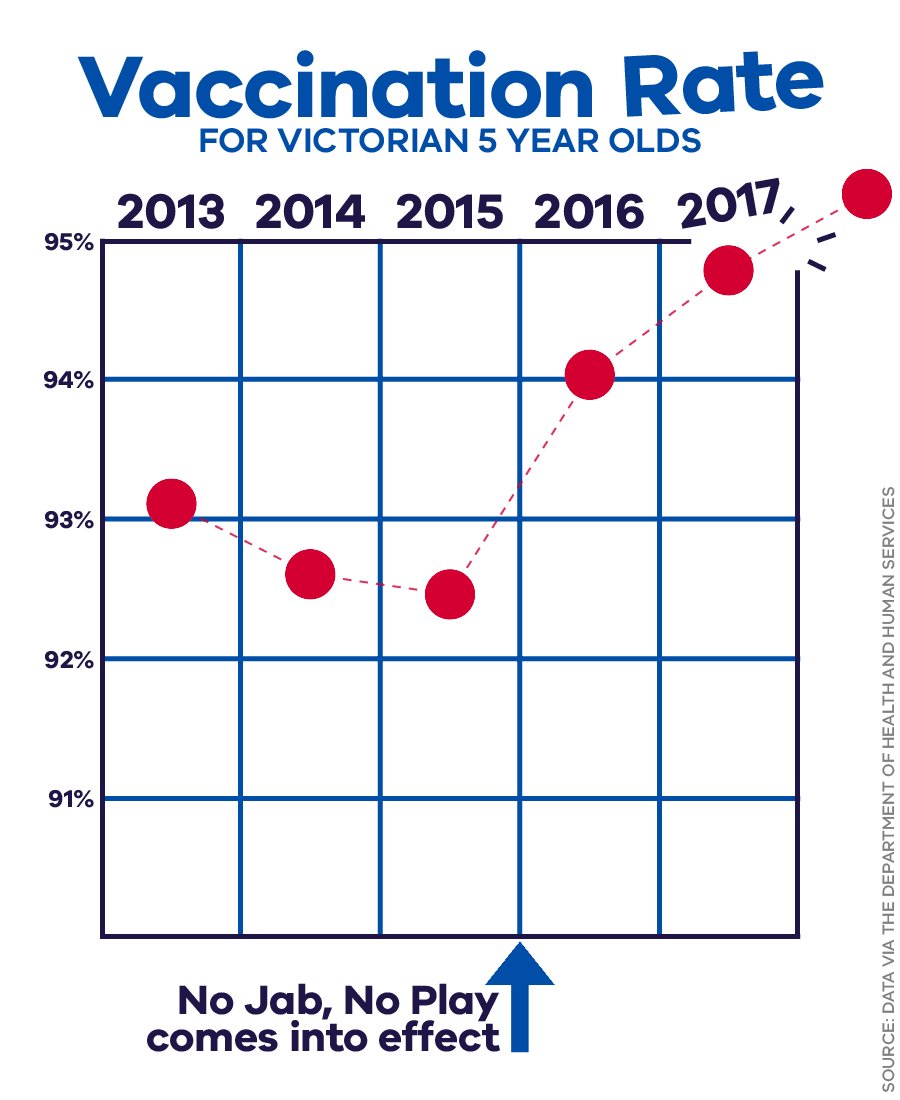
This graph comes from the Twitter account of Jill Hennessy, Victoria’s Minister for Health.  It’s obviously intended to make a particular point — and one that’s politically supportive to her.  However, it’s actually a pretty good graph.

The baseline isn’t zero, but this is clearly an example where a zero baseline would be silly: zero is not a relevant value of the vaccination rate.  The 95% top line is also not arbitrary: it’s the government target for vaccination, chosen because it’s thought to be high enough for herd immunity even to measles.  Having the line break out of the box is done without distorting the numerical values.   I might want some earlier data than 2013 to see the trends under the previous government, but that’s not a terrible omission.

The causal attribution of the increase to the “No Jab No Play” laws — restricting kindergarten, preschool, and daycare attendance for kids who are missing vaccinations — is obviously less solid, but it’s not implausible.  And there are some regions of Victoria where rates are still low. And there’s obviously room to argue about whether the laws denying benefits and restricting preschool/kindergarten/daycare enrolment are worth it even if they were responsible. But the graph itself, unusually for something from a minister, isn’t bad.

The data speak for themselves?

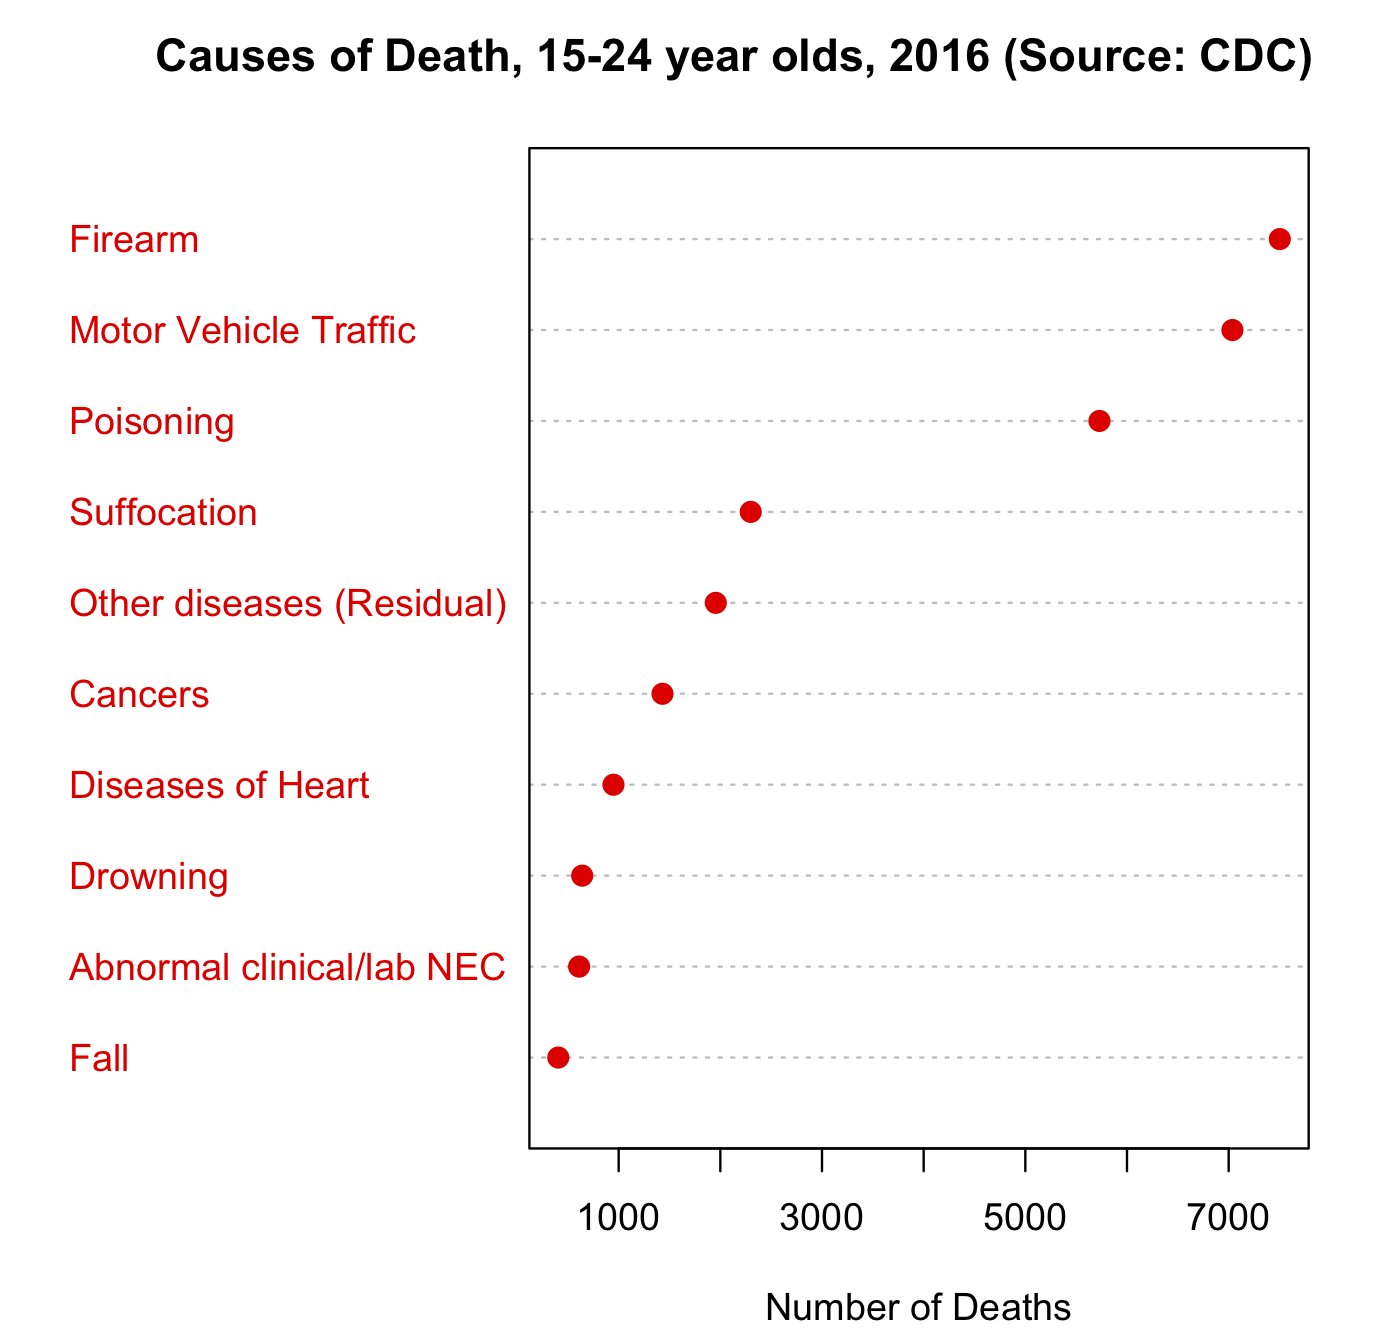
This graph was on Twitter this morning. There’s nothing wrong with the graph: good data, clear presentation, but it does provide a nice illustration of the difficulties in official statistics — you have to decide what categories to use, and it makes a difference.

The second leading cause, motor vehicles, is straightforward enough.  The first, firearms, is more complicated. A majority of the firearm deaths are suicides, and it’s controversial whether firearm access increases the suicide rate or just affects the method.  Poisoning is also complicated: you might well want to treat both suicide and accidental recreational-drug overdose separately. And so on.

Sometimes you want to break down the data by intent, sometimes by physical cause, sometimes by medical type of injury or damage. You can’t define the ‘correct’ answer in the absence of a question.

March 17, 2018

Briefly

March 16, 2018

Low-flying rocks

This is starting to look like a series. The Herald today has Warning: Doomsday asteroid taller than Empire State building cannot be stopped by Nasa. They go on to say

The consequences would be “dire” experts have warned, and the asteroid has sparked fears that it could even wipe out life for good.

Stuff has the less-exciting headline Nasa draws up plans for huge eight-ton spacecraft to blow up doomsday asteroid. You might be able to guess which one is more accurate.

If you follow the link from the Herald to the Daily Mail, and then from the Daily Mail to the scientific research paper, and then get past the paywall, you find the research is about the best ways to handle an asteroid like this one if it turns out to be a threat. As the Stuff story says, the scientists think they could manage a deflection given enough notice; with less warning than that they might need to blow it up with a big nuke.

So, how much warning do we have? The Herald says

Based on observational data, Bennu has a 1 in 2,700-chance of striking Earth on Sept. 25, 2135.

That’s quite a long time in the future — if scientists think they’ve got a good chance of deflecting it even with today’s technology, we should be ok even without Bruce Willis.

That’s if we believe the numbers in the story. Let’s check them. The research paper points to a lovely website from NASA that lists all the object we know about that could get scarily close to Earth at some point in the future.  Here’s their entry for Doomsday Asteroid 101955 Bennu.

Bennu has a cumulative impact probability of 3.7×10⁻⁴, ie, 1/2,700.  That’s added up over the entire foreseeable future. There are 78 potential impact dates listed. The first is 25th September 2175, with a probability of 4.1×10⁻⁵, or about 1/25,000.  The remainder of the 1/2700 probability is spread over the following 25 years.  So, the date is wrong, and the probability is misleading. Since it looks like the Daily Mail got the numbers from Buzzfeed, that’s a bit disappointing.

The NASA site also lists 101955 Bennu as -1.71 on the “Palermo scale.” The Palermo scale compares the risk of being hit by a specific asteroid over a period of time to the expected risk of being hit by all the other asteroids of the same size that we don’t know about yet. Bennu’s -1.71 means the risk from Bennu is 10-1.71 times lower than the background risk — about 50 times lower. Dealling with Bennu would lower our risk over the next couple of centuries for asteroids of that size by a few percent. It’s worth doing — but mostly as a test of the technology.

Also, it would be interesting to know who is actually afraid the asteroid “could wipe out life for good”. It’s presumably not the “experts” from earlier in the sentence: the impact is estimated as having the energy of a 1.15 gigaton explosion.  That’s not something you want in your school zone, but it’s tiny compared to, say, the Taupo eruption roughly 2000 years ago. It’s about of the order of magnitude of the Tarawera explosion in 1886.  An impact in the worst possible place — maybe on top of Shanghai —  could kill a lot of people even with the best evacuation efforts but it wouldn’t wipe out industrial civilisation, let alone all life.


(hat tip: Mark Hanna)