Infographic meh.
The Herald has produced this Stat of the Week nomination
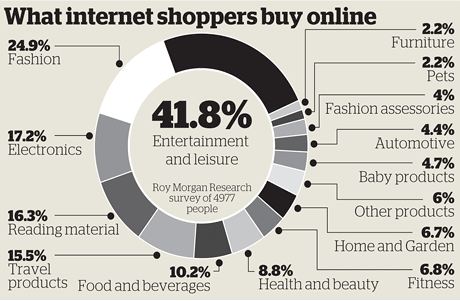
The obvious problem is that the percentages add up to about 170%, not 100%. That’s why the bar labelled “41.8%” is only about 1/4 of the circle.These are not mutually exclusive categories, and in fact someone who is in one of these categories is actually more likely to be in others.
The most interesting results from the underlying data would be about which purchases go together. Is there an more-or-less consistent ordering of things so that someone who buys food and beverages online will also buy reading materials and electronics online, or is it more complicated? That’s probably the sort of information that Roy Morgan Research would like to sell you, with the overall proportions as a teaser — selling detailed survey reports is their business.
On the other hand, while the ribbon adding up to a full circle is irrelevant because there isn’t a meaningful total, it’s hard to get very worked up about it. A table, or a ‘forest plot’ of points and margin of error would be a bit more informative — it’s not clear what the margin of error in the smaller categories is like.
I’m slightly more worried about the fact that reading isn’t counted as leisure, somewhat more worried that it’s news that more people use the internet now than ten years ago, and much more worried that the graph says it refers to 4977 people but the text of the story says 12000 people.
Thomas Lumley (@tslumley) is Professor of Biostatistics at the University of Auckland. His research interests include semiparametric models, survey sampling, statistical computing, foundations of statistics, and whatever methodological problems his medical collaborators come up with. He also blogs at Biased and Inefficient See all posts by Thomas Lumley »
Perhaps the 4977 people were the ones who said “yes” to at least one category, leaving 7023 who answered “no” to everything or whose answers were not counted?
(Assuming the “12000” was an exact number, there would have to be at least 139 whose answers were not counted, otherwise 41.8% (who bought entertainment & leisure) would exceed 4977 as a percentage of the number of counted answers.)
From which we can infer that few respondents answered “yes” to just one question; most respondents either: answered “yes” to multiple questions, or answered “no” to all questions, or refused to answer, or gave an informal (unclassifiable) answer.
13 years ago