What are you trying to do?
There’s a new ‘perspectives’ piece (paywall) in the journal Science, by Jeff Leek and Roger Peng (of Simply Statistics), arguing that the most common mistake in data analysis is misunderstanding the type of question. Here’s their flowchart
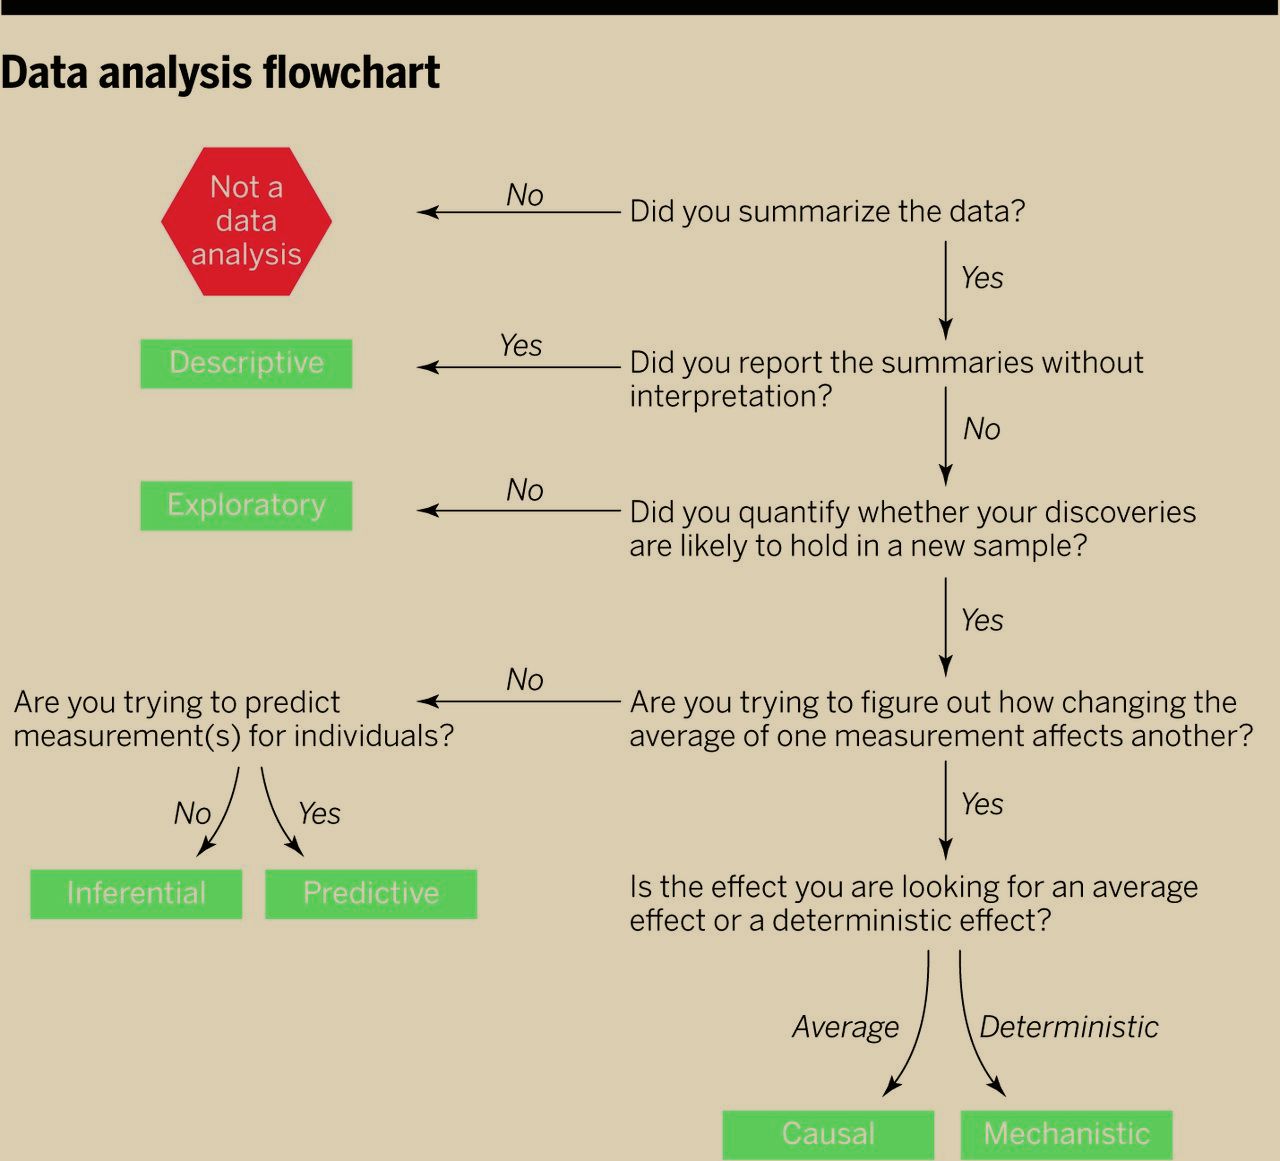
The reason this is relevant to StatsChat is that you can use the flowchart on stories in the media. If there’s enough information in the story to follow the flowchart you can see how the claims match up to the type of analysis. If there isn’t enough information in the story, well, you know that.
Thomas Lumley (@tslumley) is Professor of Biostatistics at the University of Auckland. His research interests include semiparametric models, survey sampling, statistical computing, foundations of statistics, and whatever methodological problems his medical collaborators come up with. He also blogs at Biased and Inefficient See all posts by Thomas Lumley »
I don’t understand the first part. Summarising the data is usually destructive and should be avoided in principle: why would not doing it mean you’re “not doing data analysis”?
11 years ago
Summarising in the sense that you don’t just end up with the data or a subset of it as the output.
A posterior distribution is still a summary.
11 years ago