Crime reports in NZ
The Herald Insights section has a multi-day exploration of police burglary reports, starting with a map at the Census meshblock level.
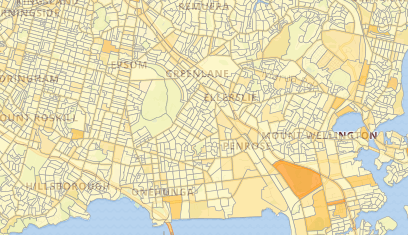
When you have counts of things on a map there’s always an issue of denominators and areas. There’s the “one cow, one vote” phenomenon where rural areas dominate the map, and also the question of whether to show the raw count, the fraction of the population, or something else. Burglaries are especially tricky in this context, because the crime location need not be a household, and the perpetrator need not live nearby, so the meshblock population really isn’t the right denominator. The Herald hasn’t standardised, which I think is a reasonable default.
It’s also an opportunity to link again to Graeme Edgeler’s discussions of why ‘burglary’ is a wider category than most people realise.
Thomas Lumley (@tslumley) is Professor of Biostatistics at the University of Auckland. His research interests include semiparametric models, survey sampling, statistical computing, foundations of statistics, and whatever methodological problems his medical collaborators come up with. He also blogs at Biased and Inefficient See all posts by Thomas Lumley »
Meshblocks are only somewhat proportional to resident population, with very high variance, to the point where they’re largely arbitrary units of varying resolution area by area. So what does the absolute number *mean* in this context?
If the purpose of journalism is to interpret the data and tell a story, then I think this falls short. It leans on the consumer to interpret the data correctly (how many people know how Meshblocks are created?) and their contextual knowledge of an area (“Oh, that’s an industrial area”). The result, for 90% of consumers, is going to be completely misleading.
So, what could be done? A raw per/area comparison could provide a simple way to look at rates, with overlays of urban, residential and rural area to add context for the user to interpret the differences. Or you they could normalize by the number of property parcels in the meshblock, which gives you a fairly intuitive view on the burglary rate per property.
10 years ago
Property parcels would be a good choice. My main point was just that normalizing by meshblock population would have a good chance of being worse than nothing. It’s certainly worse in my neighbourhood.
10 years ago