Posts from July 2018 (20)

July 17, 2018

Super 15 Predictions for the Qualifiers

Team Ratings for the Qualifiers

The basic method is described on my Department home page.
Here are the team ratings prior to this week’s games, along with the ratings at the start of the season.

Current Rating Rating at Season Start Difference
Crusaders 17.04 15.23 1.80
Hurricanes 11.03 16.18 -5.10
Chiefs 8.84 9.29 -0.40
Lions 8.50 13.81 -5.30
Highlanders 4.94 10.29 -5.40
Waratahs 1.98 -3.92 5.90
Sharks 1.19 1.02 0.20
Jaguares 0.06 -4.64 4.70
Brumbies -0.06 1.75 -1.80
Stormers -0.33 1.48 -1.80
Blues -3.20 -0.24 -3.00
Bulls -3.81 -4.79 1.00
Rebels -7.97 -14.96 7.00
Reds -8.63 -9.47 0.80
Sunwolves -16.98 -18.42 1.40


Performance So Far

So far there have been 120 matches played, 84 of which were correctly predicted, a success rate of 70%.
Here are the predictions for last week’s games.

Game Date Score Prediction Correct
1 Chiefs vs. Hurricanes Jul 13 28 – 24 0.90 TRUE
2 Reds vs. Sunwolves Jul 13 48 – 27 11.20 TRUE
3 Highlanders vs. Rebels Jul 14 43 – 37 18.40 TRUE
4 Crusaders vs. Blues Jul 14 54 – 17 21.90 TRUE
5 Waratahs vs. Brumbies Jul 14 31 – 40 7.50 FALSE
6 Lions vs. Bulls Jul 14 38 – 12 14.40 TRUE
7 Sharks vs. Jaguares Jul 14 20 – 10 4.50 TRUE


Predictions for the Qualifiers

Here are the predictions for the Qualifiers. The prediction is my estimated expected points difference with a positive margin being a win to the home team, and a negative margin a win to the away team.

Game Date Winner Prediction
1 Hurricanes vs. Chiefs Jul 20 Hurricanes 5.70
2 Crusaders vs. Sharks Jul 21 Crusaders 19.80
3 Waratahs vs. Highlanders Jul 21 Waratahs 1.00
4 Lions vs. Jaguares Jul 21 Lions 12.40


NRL Predictions for Round 19

Team Ratings for Round 19

The basic method is described on my Department home page.
Here are the team ratings prior to this week’s games, along with the ratings at the start of the season.


Current Rating Rating at Season Start Difference
Storm 9.63 16.73 -7.10
Rabbitohs 4.86 -3.90 8.80
Raiders 3.96 3.50 0.50
Sharks 3.86 2.20 1.70
Roosters 3.70 0.13 3.60
Panthers 2.86 2.64 0.20
Dragons 1.94 -0.45 2.40
Broncos 0.92 4.78 -3.90
Warriors -1.07 -6.97 5.90
Cowboys -1.96 2.97 -4.90
Sea Eagles -2.81 -1.07 -1.70
Bulldogs -3.93 -3.43 -0.50
Wests Tigers -4.00 -3.63 -0.40
Eels -5.60 1.51 -7.10
Titans -6.01 -8.91 2.90
Knights -8.66 -8.43 -0.20


Performance So Far

So far there have been 136 matches played, 81 of which were correctly predicted, a success rate of 59.6%.
Here are the predictions for last week’s games.


Game Date Score Prediction Correct
1 Panthers vs. Sharks Jul 13 12 – 24 4.30 FALSE
2 Knights vs. Eels Jul 13 18 – 16 -0.40 FALSE
3 Bulldogs vs. Rabbitohs Jul 14 6 – 24 -3.80 TRUE
4 Sea Eagles vs. Storm Jul 14 13 – 14 -10.80 TRUE
5 Raiders vs. Cowboys Jul 14 38 – 12 6.10 TRUE
6 Broncos vs. Warriors Jul 15 6 – 26 10.80 FALSE
7 Dragons vs. Wests Tigers Jul 15 16 – 20 11.00 FALSE
8 Titans vs. Roosters Jul 15 12 – 20 -6.50 TRUE


Predictions for Round 19

Here are the predictions for Round 19. The prediction is my estimated expected points difference with a positive margin being a win to the home team, and a negative margin a win to the away team.


Game Date Winner Prediction
1 Eels vs. Bulldogs Jul 19 Eels 1.30
2 Sharks vs. Raiders Jul 20 Sharks 2.90
3 Broncos vs. Panthers Jul 20 Broncos 1.10
4 Knights vs. Titans Jul 21 Knights 0.30
5 Wests Tigers vs. Rabbitohs Jul 21 Rabbitohs -5.90
6 Cowboys vs. Dragons Jul 21 Dragons -0.90
7 Warriors vs. Storm Jul 22 Storm -6.20
8 Sea Eagles vs. Roosters Jul 22 Roosters -3.50


July 11, 2018

Super 15 Predictions for Round 19

Team Ratings for Round 19

The basic method is described on my Department home page.
Here are the team ratings prior to this week’s games, along with the ratings at the start of the season.

Current Rating Rating at Season Start Difference
Crusaders 16.14 15.23 0.90
Hurricanes 11.21 16.18 -5.00
Chiefs 8.65 9.29 -0.60
Lions 7.81 13.81 -6.00
Highlanders 5.68 10.29 -4.60
Waratahs 2.97 -3.92 6.90
Sharks 0.86 1.02 -0.20
Jaguares 0.39 -4.64 5.00
Stormers -0.33 1.48 -1.80
Brumbies -1.05 1.75 -2.80
Blues -2.29 -0.24 -2.10
Bulls -3.12 -4.79 1.70
Rebels -8.72 -14.96 6.20
Reds -9.22 -9.47 0.30
Sunwolves -16.39 -18.42 2.00


Performance So Far

So far there have been 113 matches played, 78 of which were correctly predicted, a success rate of 69%.
Here are the predictions for last week’s games.

Game Date Score Prediction Correct
1 Crusaders vs. Highlanders Jul 06 45 – 22 12.70 TRUE
2 Reds vs. Rebels Jul 06 37 – 23 1.50 TRUE
3 Chiefs vs. Brumbies Jul 07 24 – 19 14.90 TRUE
4 Hurricanes vs. Blues Jul 07 42 – 24 16.90 TRUE
5 Waratahs vs. Sunwolves Jul 07 77 – 25 19.50 TRUE
6 Bulls vs. Jaguares Jul 07 43 – 34 -0.70 FALSE
7 Stormers vs. Sharks Jul 07 27 – 16 1.10 TRUE


Predictions for Round 19

Here are the predictions for Round 19. The prediction is my estimated expected points difference with a positive margin being a win to the home team, and a negative margin a win to the away team.

Game Date Winner Prediction
1 Chiefs vs. Hurricanes Jul 13 Chiefs 0.90
2 Reds vs. Sunwolves Jul 13 Reds 11.20
3 Highlanders vs. Rebels Jul 14 Highlanders 18.40
4 Crusaders vs. Blues Jul 14 Crusaders 21.90
5 Waratahs vs. Brumbies Jul 14 Waratahs 7.50
6 Lions vs. Bulls Jul 14 Lions 14.40
7 Sharks vs. Jaguares Jul 14 Sharks 4.50


NRL Predictions for Round 18

Team Ratings for Round 18

The basic method is described on my Department home page.
Here are the team ratings prior to this week’s games, along with the ratings at the start of the season.

Current Rating Rating at Season Start Difference
Storm 10.32 16.73 -6.40
Panthers 4.00 2.64 1.40
Rabbitohs 3.87 -3.90 7.80
Roosters 3.60 0.13 3.50
Broncos 3.08 4.78 -1.70
Dragons 2.99 -0.45 3.40
Sharks 2.72 2.20 0.50
Raiders 2.56 3.50 -0.90
Cowboys -0.57 2.97 -3.50
Bulldogs -2.94 -3.43 0.50
Warriors -3.22 -6.97 3.80
Sea Eagles -3.50 -1.07 -2.40
Wests Tigers -5.06 -3.63 -1.40
Eels -5.43 1.51 -6.90
Titans -5.90 -8.91 3.00
Knights -8.83 -8.43 -0.40


Performance So Far

So far there have been 128 matches played, 77 of which were correctly predicted, a success rate of 60.2%.
Here are the predictions for last week’s games.

Game Date Score Prediction Correct
1 Storm vs. Dragons Jul 05 52 – 30 8.40 TRUE
2 Panthers vs. Warriors Jul 06 36 – 4 8.40 TRUE
3 Bulldogs vs. Raiders Jul 07 28 – 32 -2.30 TRUE
4 Titans vs. Broncos Jul 08 0 – 34 -1.40 TRUE


Predictions for Round 18

Here are the predictions for Round 18. The prediction is my estimated expected points difference with a positive margin being a win to the home team, and a negative margin a win to the away team.

Game Date Winner Prediction
1 Panthers vs. Sharks Jul 13 Panthers 4.30
2 Knights vs. Eels Jul 13 Eels -0.40
3 Bulldogs vs. Rabbitohs Jul 14 Rabbitohs -3.80
4 Sea Eagles vs. Storm Jul 14 Storm -10.80
5 Raiders vs. Cowboys Jul 14 Raiders 6.10
6 Broncos vs. Warriors Jul 15 Broncos 10.80
7 Dragons vs. Wests Tigers Jul 15 Dragons 11.00
8 Titans vs. Roosters Jul 15 Roosters -6.50


July 6, 2018

Showing uncertainty with colour

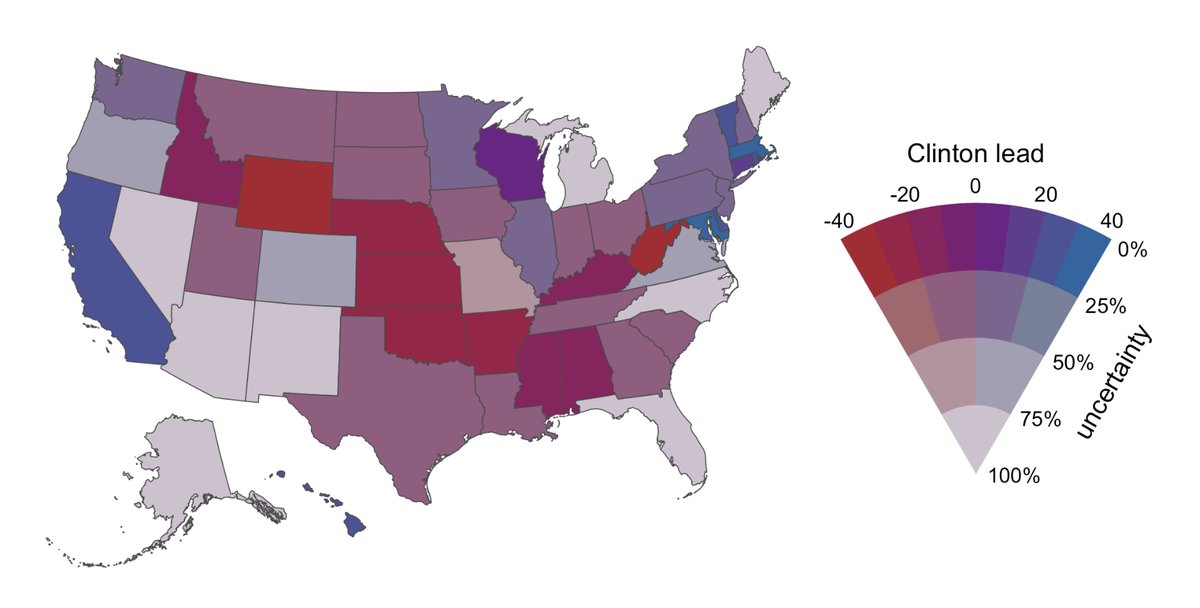
From Claus Wilke on Twitter, using color to indicate uncertainty, based on data from before the 2016 US election.

The red:blue scale indicates who is ahead, and the grey:coloured scale indicates confidence.  There was lots of discussion about whether this is graying out the differences too much or not enough, and so on, but it’s an interesting idea.

July 5, 2018

Salary distributions

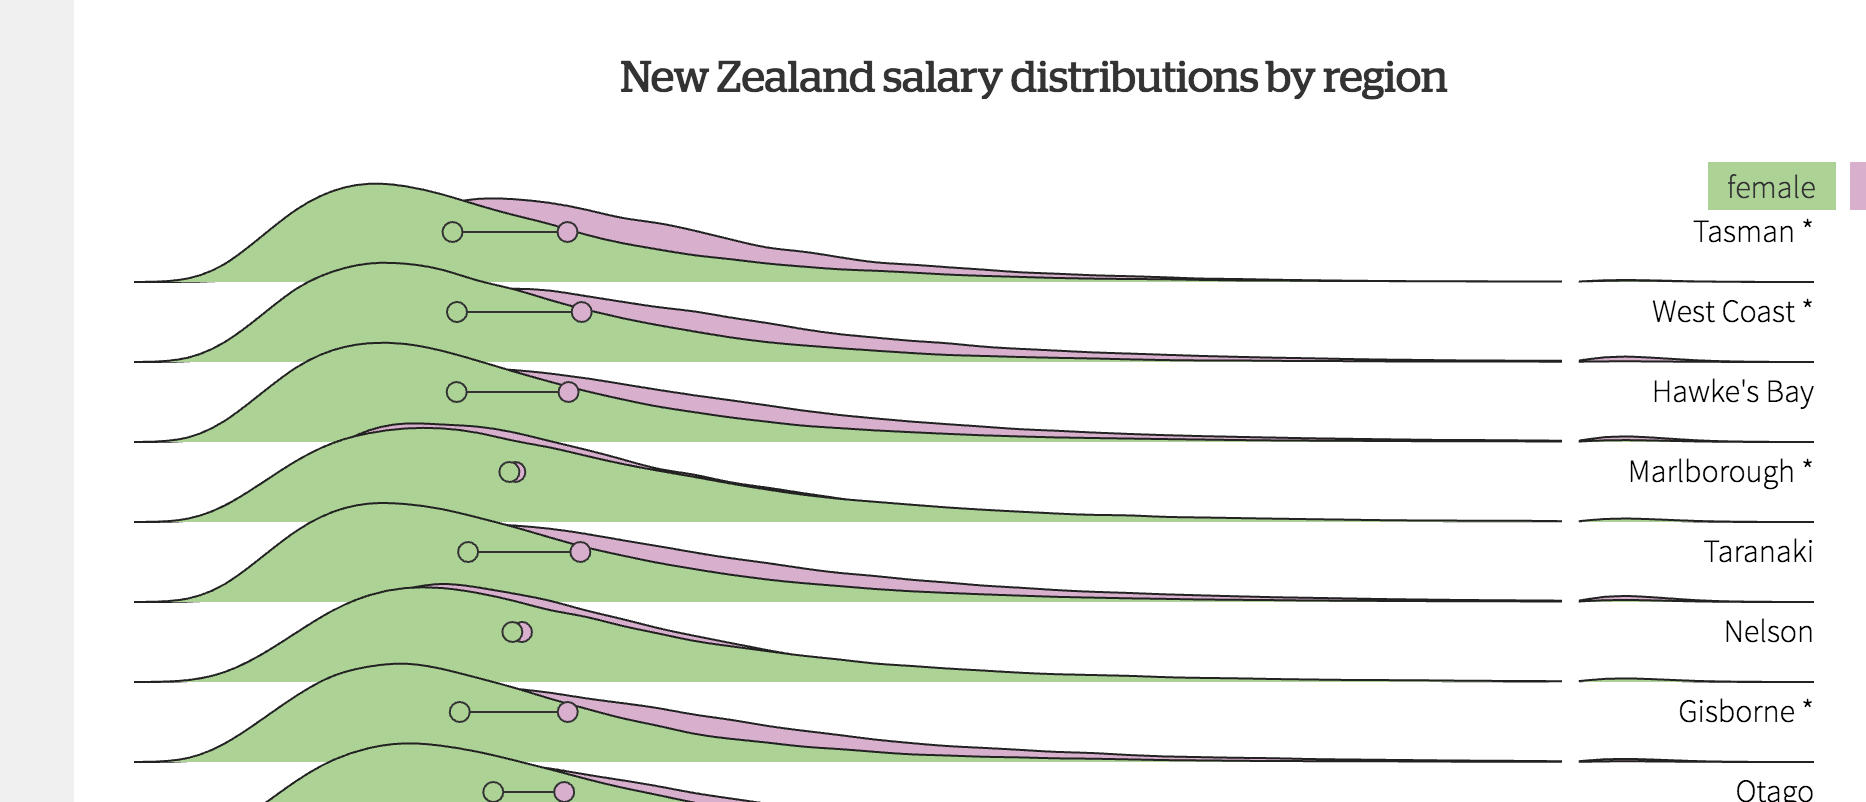
Chris Knox at the Herald has a very nice visualisation of salary distributions and gender differences by age, industry, region, and sector. 

These are tidier than you’d expect from a relatively small survey, because they are predictions from a model, rather than raw survey data.

The good thing about using a model like this is that you can get somewhat realistic pictures from a much smaller survey than you’d otherwise need. The model is expanding the real data for each individual into a smooth distribution on the graph.

The bad thing is there’s a bit of distortion: for example, a graph of a large enough set of raw data would show spikes where multiple people have the same round-number income, and probably a sharper cutoff at the bottom end rather than a smooth tail down to zero.

The graph shows very little difference between private-sector and public-sector workers.  That surprised me, because public sector employees on average have substantially higher wage/salary income — as Keith Ng separately writes in the Herald. The difference doesn’t, of course, represent higher pay for comparable jobs; it’s because the public sector is increasingly biased towards educated professionals.  Also, government bodies (like other large organisations) will often contract out their lowest-paying jobs rather than using their own employees. Keith showed, using StatsNZ data, that public-sector employees tend to earn slightly less than private-sector employees within the same occupation type.

But if it takes comparisons within an occupation to correct the misleading public-private comparison in StatsNZ data, why doesn’t it take comparisons within an occupation in the visualisation?  After some Twitter conversation we worked out that it’s because the visualisation is of salaries, and the other comparison is of salaries and wages. Restricting to salaried employees, while cruder than doing comparisons within occupation types, is enough to remove the bulk of the bias.

‘Foreign’ buyers

From the Listener this week, and now on noted.co.nz

This week, new data emerged from the ASB Bankshowing that foreign buyers are a much more significant part of the overheated housing market than had previously been established; that is, between 11% and 20% rather than the piffling 3.3% nationally – and 7.3% in the Auckland market, ground zero for our property frenzy – previously reported by Statistics New Zealand.

As I wrote last week

  1. It’s not new data – it comes from exactly the same StatsNZ report (if either the ASB report or the StatsNZ report had been linked, this would have been easier for the reader to find out)
  2. Not foreign buyers. The 11% includes 8% of New Zealand residents who aren’t citizens at the time they buy the house.  The 11-21% range includes 0-10% of buyers who are foreign commercial entities. Because ASB didn’t have any new data, they don’t know what proportion of the commercial entities are local, but they were guessing it was at the low end. So, ASB’s figure for foreign buyers is 3-13%, with a guess that it’s towards the low end.
  3. In fact, even the 3% counts people on work visas buying a house or apartment to live in as foreign buyers. You could maybe argue that people on work visas should be driving up rental costs instead, but it’s not that obvious a case.


July 3, 2018

Super 15 Predictions for Round 18

Team Ratings for Round 18

The basic method is described on my Department home page.
Here are the team ratings prior to this week’s games, along with the ratings at the start of the season.

Current Rating Rating at Season Start Difference
Crusaders 15.52 15.23 0.30
Hurricanes 11.14 16.18 -5.00
Chiefs 9.25 9.29 -0.00
Lions 7.81 13.81 -6.00
Highlanders 6.30 10.29 -4.00
Sharks 1.45 1.02 0.40
Waratahs 1.02 -3.92 4.90
Jaguares 0.97 -4.64 5.60
Stormers -0.93 1.48 -2.40
Brumbies -1.64 1.75 -3.40
Blues -2.23 -0.24 -2.00
Bulls -3.70 -4.79 1.10
Rebels -7.97 -14.96 7.00
Reds -9.97 -9.47 -0.50
Sunwolves -14.44 -18.42 4.00


Performance So Far

So far there have been 106 matches played, 72 of which were correctly predicted, a success rate of 67.9%.
Here are the predictions for last week’s games.

Game Date Score Prediction Correct
1 Blues vs. Reds Jun 29 39 – 16 10.20 TRUE
2 Rebels vs. Waratahs Jun 29 26 – 31 -5.60 TRUE
3 Highlanders vs. Chiefs Jun 30 22 – 45 3.80 FALSE
4 Brumbies vs. Hurricanes Jun 30 24 – 12 -11.60 FALSE
5 Sunwolves vs. Bulls Jun 30 42 – 37 -8.30 FALSE
6 Sharks vs. Lions Jun 30 31 – 24 -4.20 FALSE
7 Jaguares vs. Stormers Jun 30 25 – 14 5.20 TRUE


Predictions for Round 18

Here are the predictions for Round 18. The prediction is my estimated expected points difference with a positive margin being a win to the home team, and a negative margin a win to the away team.

Game Date Winner Prediction
1 Crusaders vs. Highlanders Jul 06 Crusaders 12.70
2 Reds vs. Rebels Jul 06 Reds 1.50
3 Chiefs vs. Brumbies Jul 07 Chiefs 14.90
4 Hurricanes vs. Blues Jul 07 Hurricanes 16.90
5 Waratahs vs. Sunwolves Jul 07 Waratahs 19.50
6 Bulls vs. Jaguares Jul 07 Jaguares -0.70
7 Stormers vs. Sharks Jul 07 Stormers 1.10


NRL Predictions for Round 17

Team Ratings for Round 17

The basic method is described on my Department home page.
Here are the team ratings prior to this week’s games, along with the ratings at the start of the season.

Current Rating Rating at Season Start Difference
Storm 9.37 16.73 -7.40
Dragons 3.94 -0.45 4.40
Rabbitohs 3.87 -3.90 7.80
Roosters 3.60 0.13 3.50
Sharks 2.72 2.20 0.50
Raiders 2.44 3.50 -1.10
Panthers 2.35 2.64 -0.30
Broncos 0.79 4.78 -4.00
Cowboys -0.57 2.97 -3.50
Warriors -1.57 -6.97 5.40
Bulldogs -2.82 -3.43 0.60
Sea Eagles -3.50 -1.07 -2.40
Titans -3.62 -8.91 5.30
Wests Tigers -5.06 -3.63 -1.40
Eels -5.43 1.51 -6.90
Knights -8.83 -8.43 -0.40


Performance So Far

So far there have been 124 matches played, 73 of which were correctly predicted, a success rate of 58.9%.
Here are the predictions for last week’s games.

Game Date Score Prediction Correct
1 Dragons vs. Eels Jun 28 20 – 18 14.10 TRUE
2 Warriors vs. Sharks Jun 29 15 – 18 0.70 FALSE
3 Roosters vs. Storm Jun 29 8 – 9 -3.10 TRUE
4 Panthers vs. Sea Eagles Jun 30 10 – 18 11.60 FALSE
5 Knights vs. Bulldogs Jun 30 16 – 36 -0.20 TRUE
6 Broncos vs. Raiders Jun 30 26 – 22 0.90 TRUE
7 Wests Tigers vs. Titans Jul 01 12 – 30 4.70 FALSE
8 Rabbitohs vs. Cowboys Jul 01 21 – 20 8.50 TRUE


Predictions for Round 17

Here are the predictions for Round 17. The prediction is my estimated expected points difference with a positive margin being a win to the home team, and a negative margin a win to the away team.

Game Date Winner Prediction
1 Storm vs. Dragons Jul 05 Storm 8.40
2 Panthers vs. Warriors Jul 06 Panthers 8.40
3 Bulldogs vs. Raiders Jul 07 Raiders -2.30
4 Titans vs. Broncos Jul 08 Broncos -1.40


Briefly

  • False positives: people who think they are allergic to penicillin (but aren’t, or aren’t anymore) are at higher risk of getting nasty antibiotic-resistant infections.
  • RadioNZ interview with the new Chief Science Advisor, Juliet Gerrard. Also, see the official chief sciencely instagram
  • As I point out each year, the Q&A list for the NZ Garden Bird survey has some well-written, simple principles of research design
  • There’s a story Americans vote Taco Bell as the ‘Best Mexican Restaurant of 2018’.  Of course it’s not true — and it’s a good example of where voting isn’t going to work.  Most of the good Mexican restaurants in the US will be unknown outside their local area, and any with nationwide recognition will have to be large chains.  The true story is that Taco Bell came top in ‘Brand Equity’ in the Harris poll, which basically means lots of people have heard of it and would be willing to eat there.
  • Why People Make Bad Charts (and What to Do When it Happens) from Flowing Data