Posts from May 2019 (27)

May 17, 2019

Briefly

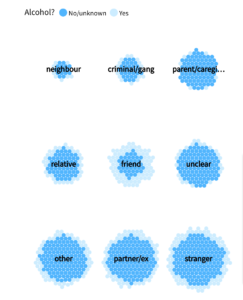
  • From Stuff, an interactive visualisation of homicides in New Zealand, which also lets you do your own comparisons. For example, this one shows that alcohol is most often involved when people are killed by a friend
  • From the LA Times, a visualisation mapping the settlements of the Tongva, who lived in Los Angeles before it was colonised.
  • Previously the questions raised about mining in Foulden Maar haven’t been StatsChat-relevant, but this from Newsroom is. It says animal nutrition specialists are skeptical that the diatomaceous earth is actually of any benefit as an animal food, and there doesn’t appear to be any published research supporting its use. The story also says one of the selling points of the earth is that it contains fulvic acid, which I can recognise as a popular pseudoscience topic (when consumed; it’s a perfectly good soil component).
  • Sometimes researchers do try to fight back when their work is exaggerated in the media: here’s an example on Twitter
  • A well-sourced Twitter thread from Russell Brown, on how saliva testing to see if drivers are impaired by cannabis is nowhere near ready for use. Note that it’s not even fit for purpose if you’re trying to detect cannabis use, let alone for detecting impairment.
  • Epidemic simulations on a network, letting you fiddle with various characteristics of the disease/meme/whatever
May 15, 2019

Updated NRL Predictions for Round 10

Team Ratings for Round 10

The basic method is described on my Department home page.

Round 9 games all being played in Brisbane caused problems for me again. I had changed the order of the teams for the Sea Eagles versus Broncos game to give them home ground advantage which then impacted my routines for webscraping results and adding them to my database. I thought I had corrected the resulting errors but missed one. Since that affected the updated ratings and the predictions for Round 10, I have updated the whole post.

Thanks to Chad James for advising me of the error.

Here are the team ratings prior to this week’s games, along with the ratings at the start of the season.

Current Rating Rating at Season Start Difference
Roosters 10.91 8.72 2.20
Storm 9.71 6.03 3.70
Rabbitohs 7.04 3.89 3.20
Raiders 3.89 1.81 2.10
Sharks 1.41 3.90 -2.50
Broncos 0.82 2.63 -1.80
Dragons -0.72 0.06 -0.80
Sea Eagles -2.42 -5.61 3.20
Warriors -2.69 -0.27 -2.40
Cowboys -2.80 0.15 -3.00
Wests Tigers -3.54 -5.57 2.00
Eels -3.85 -6.17 2.30
Knights -4.31 -8.51 4.20
Bulldogs -4.91 -0.61 -4.30
Panthers -5.20 0.93 -6.10
Titans -5.33 -3.36 -2.00


Performance So Far

So far there have been 72 matches played, 52 of which were correctly predicted, a success rate of 72.2%.
Here are the predictions for last week’s games.

Game Date Score Prediction Correct
1 Titans vs. Sharks May 09 18 – 26 -6.50 TRUE
2 Wests Tigers vs. Panthers May 10 30 – 4 -2.30 FALSE
3 Broncos vs. Sea Eagles May 10 26 – 10 4.60 TRUE
4 Bulldogs vs. Knights May 11 10 – 22 1.30 FALSE
5 Warriors vs. Dragons May 11 26 – 18 -3.60 FALSE
6 Storm vs. Eels May 11 64 – 10 7.00 TRUE
7 Roosters vs. Raiders May 12 30 – 24 7.20 TRUE
8 Rabbitohs vs. Cowboys May 12 32 – 16 8.80 TRUE


Predictions for Round 10

Here are the predictions for Round 10. The prediction is my estimated expected points difference with a positive margin being a win to the home team, and a negative margin a win to the away team.

Game Date Winner Prediction
1 Storm vs. Wests Tigers May 16 Storm 16.30
2 Panthers vs. Warriors May 17 Panthers 2.00
3 Broncos vs. Roosters May 17 Roosters -7.10
4 Titans vs. Bulldogs May 18 Titans 2.60
5 Cowboys vs. Eels May 18 Cowboys 4.00
6 Raiders vs. Rabbitohs May 18 Rabbitohs -0.10
7 Dragons vs. Knights May 19 Dragons 6.60
8 Sharks vs. Sea Eagles May 19 Sharks 6.80


May 14, 2019

Super Rugby Predictions for Round 14

Team Ratings for Round 14

The basic method is described on my Department home page.
Here are the team ratings prior to this week’s games, along with the ratings at the start of the season.

Current Rating Rating at Season Start Difference
Crusaders 17.86 17.67 0.20
Hurricanes 8.33 9.43 -1.10
Highlanders 4.68 4.01 0.70
Chiefs 2.83 8.56 -5.70
Lions 1.75 8.28 -6.50
Jaguares 1.48 -0.26 1.70
Sharks 1.40 0.45 1.00
Brumbies 0.68 0.00 0.70
Waratahs -0.15 2.00 -2.20
Stormers -0.45 -0.39 -0.10
Bulls -1.56 -3.79 2.20
Blues -1.87 -3.42 1.60
Rebels -3.11 -7.26 4.10
Reds -5.54 -8.19 2.60
Sunwolves -15.31 -16.08 0.80


Performance So Far

So far there have been 85 matches played, 57 of which were correctly predicted, a success rate of 67.1%.
Here are the predictions for last week’s games.

Game Date Score Prediction Correct
1 Blues vs. Hurricanes May 10 12 – 22 -6.20 TRUE
2 Rebels vs. Reds May 10 30 – 24 5.90 TRUE
3 Bulls vs. Crusaders May 10 13 – 45 -13.20 TRUE
4 Highlanders vs. Jaguares May 11 32 – 27 7.50 TRUE
5 Chiefs vs. Sharks May 11 29 – 23 5.40 TRUE
6 Lions vs. Waratahs May 11 29 – 28 6.60 TRUE
7 Brumbies vs. Sunwolves May 12 33 – 0 18.20 TRUE


Predictions for Round 14

Here are the predictions for Round 14. The prediction is my estimated expected points difference with a positive margin being a win to the home team, and a negative margin a win to the away team.

Game Date Winner Prediction
1 Hurricanes vs. Jaguares May 17 Hurricanes 10.80
2 Blues vs. Chiefs May 18 Chiefs -1.20
3 Rebels vs. Bulls May 18 Rebels 2.40
4 Reds vs. Waratahs May 18 Waratahs -1.90
5 Lions vs. Highlanders May 18 Lions 1.10
6 Stormers vs. Crusaders May 18 Crusaders -14.30


NRL Predictions for Round 10

Team Ratings for Round 10

The basic method is described on my Department home page.
Here are the team ratings prior to this week’s games, along with the ratings at the start of the season.

Current Rating Rating at Season Start Difference
Roosters 10.91 8.72 2.20
Storm 9.71 6.03 3.70
Rabbitohs 7.04 3.89 3.20
Raiders 3.89 1.81 2.10
Sharks 1.41 3.90 -2.50
Broncos 0.82 2.63 -1.80
Dragons -0.72 0.06 -0.80
Sea Eagles -2.42 -5.61 3.20
Warriors -2.69 -0.27 -2.40
Cowboys -2.80 0.15 -3.00
Bulldogs -2.95 -0.61 -2.30
Wests Tigers -3.54 -5.57 2.00
Eels -3.85 -6.17 2.30
Panthers -5.20 0.93 -6.10
Titans -5.33 -3.36 -2.00
Knights -6.27 -8.51 2.20


Performance So Far

So far there have been 72 matches played, 53 of which were correctly predicted, a success rate of 73.6%.
Here are the predictions for last week’s games.

Game Date Score Prediction Correct
1 Titans vs. Sharks May 09 18 – 26 -6.50 TRUE
2 Wests Tigers vs. Panthers May 10 30 – 4 -2.30 FALSE
3 Broncos vs. Sea Eagles May 10 26 – 10 4.60 TRUE
4 Bulldogs vs. Knights May 11 32 – 16 1.30 TRUE
5 Warriors vs. Dragons May 11 26 – 18 -5.10 FALSE
6 Storm vs. Eels May 11 64 – 10 7.00 TRUE
7 Roosters vs. Raiders May 12 30 – 24 7.20 TRUE
8 Rabbitohs vs. Cowboys May 12 32 – 16 8.80 TRUE


Predictions for Round 10

Here are the predictions for Round 10. The prediction is my estimated expected points difference with a positive margin being a win to the home team, and a negative margin a win to the away team.

Game Date Winner Prediction
1 Storm vs. Wests Tigers May 16 Storm 16.30
2 Panthers vs. Warriors May 17 Panthers 2.00
3 Broncos vs. Roosters May 17 Roosters -7.10
4 Titans vs. Bulldogs May 18 Titans 0.60
5 Cowboys vs. Eels May 18 Cowboys 4.00
6 Raiders vs. Rabbitohs May 18 Rabbitohs -0.10
7 Dragons vs. Knights May 19 Dragons 8.50
8 Sharks vs. Sea Eagles May 19 Sharks 6.80


May 13, 2019

Briefly

  • Some very good science reporting from Dylan Cleaver (traditionally a sports reporter) in the NZ$ Herald, on what’s known and what’s controversial in sports brain injury. The last of the three-part series is here.
  • And explaining colds and flu and the immune system in The Age (Melbourne), co-written by a PhD student and the newspaper’s science reporter.
  • Twitter bot @BeehiveBanter gives daily summaries of the most common words used in Parliament
  • This went moderately viral on Twitter

    There’s obviously something wrong with these numbers — in fact, food is one of the things that’s gotten cheaper in real terms.  Some follow-up shows that the income is inflation-adjusted and the bread prices aren’t.
  • From StatsNZ How wealthy are you compared with households like you? Find out with our new app: statisticsnz.shinyapps.io/wealth/
  • Good explanation from the Grattan Institute on a misleading Australian housing statistic that keeps recurring
May 12, 2019

Other uses for wine

Q: Did you see that drinking wine could prevent colds?

A: <skeptical look>

Q: It’s on Newshub. Feel a winter cold coming? News study shows wine could be antibacterial

A: And how would it help if wine was antibacterial?

Q: It could kill the bacteria that….. oh… viruses?

A: Viruses. And where do you think the cold viruses live?

Q: Um. In your nose?

A: Ever got wine up your nose?

Q: Ok. Point. But later in the story it says “it’s not the alcohol or the acid that kill the bugs but rather the antibacterial properties of both red and white wine that help fight off both tooth plaque and sore throats.” So at least they’ve shown it works for plaque and sore throats

A: Not exactly

Q: In mice?

A: Not even.

Q: It’s bacteria in a dish in the lab, then?

A: Yes.

Q: Do bacteria even have teeth? And where did you find the research?

A: Basically same story was in the Edinburgh News and Maxim and Metro UK, and they all linked. Compounds in the wine kill some of the same bacteria that cause plaque and sore throats.

Q: That could be useful. How long did it take?

A: An hour.

Q: That’s a long time to gargle wine. Do they know what compounds in the wine have the effect? Is it these polyphenols and antioxidants we keep hearing about

A: They say it’s succinic, malic, lactic, tartaric, citric, and acetic acids, and that the polyphenols didn’t show any effect.

Q: But wasn’t it supposed to not be the acids?

A: It’s not just the acidity: the equivalent acidity from hydrochloric acid didn’t kill the bacteria.

Q: So it might not be directly useful, and it’s not a good reason to drink wine, but it’s still interesting new research?

A: The research was published in 2007. I’ve got no idea why it has resurfaced. Maybe that’s why the Newshub headline says “news study”, not “new study”

Q: Seems to reinforce the official StatsChat policy on wine, though.

A: If you’re drinking it primarily for the health benefits, you’re doing it wrong.
May 9, 2019

Updated NRL Predictions for Round 9

Team Ratings for Round 9

The basic method is described on my Department home page.

This is an unusual round in that all games are being played at Suncorp Stadium which is the home ground of the Brisbane Broncos. Hence they have been assigned home ground advantage. All other games are treated as being played at a neutral ground. The exception is the Warriors versus the Dragons where I have penalised the Warriors because they are playing overseas.

Thanks to Ben Frank for alerting me to this unusual situation.

Here are the team ratings prior to this week’s games, along with the ratings at the start of the season.


Current Rating Rating at Season Start Difference
Roosters 11.00 8.72 2.30
Rabbitohs 6.54 3.89 2.70
Storm 6.42 6.03 0.40
Raiders 3.81 1.81 2.00
Sharks 1.30 3.90 -2.60
Dragons 0.09 0.06 0.00
Broncos 0.03 2.63 -2.60
Eels -0.56 -6.17 5.60
Sea Eagles -1.62 -5.61 4.00
Cowboys -2.30 0.15 -2.50
Panthers -3.21 0.93 -4.10
Warriors -3.50 -0.27 -3.20
Bulldogs -3.98 -0.61 -3.40
Titans -5.22 -3.36 -1.90
Knights -5.24 -8.51 3.30
Wests Tigers -5.53 -5.57 0.00


Performance So Far

So far there have been 64 matches played, 47 of which were correctly predicted, a success rate of 73.4%.
Here are the predictions for last week’s games.


Game Date Score Prediction Correct
1 Rabbitohs vs. Broncos May 02 38 – 6 5.80 TRUE
2 Cowboys vs. Titans May 03 28 – 14 4.60 TRUE
3 Sharks vs. Storm May 03 20 – 18 -2.80 FALSE
4 Raiders vs. Panthers May 04 30 – 12 8.70 TRUE
5 Sea Eagles vs. Bulldogs May 04 18 – 10 4.90 TRUE
6 Roosters vs. Wests Tigers May 04 42 – 12 17.80 TRUE
7 Warriors vs. Knights May 05 18 – 36 10.20 FALSE
8 Eels vs. Dragons May 05 32 – 18 0.50 TRUE


Predictions for Round 9

Here are the predictions for Round 9. The prediction is my estimated expected points difference with a positive margin being a win to the home team, and a negative margin a win to the away team.


Game Date Winner Prediction
1 Titans vs. Sharks May 09 Sharks -6.50
2 Wests Tigers vs. Panthers May 10 Panthers -2.30
3 Broncos vs. Sea Eagles May 10 Broncos 4.60
4 Bulldogs vs. Knights May 11 Bulldogs 1.30
5 Warriors vs. Dragons May 11 Dragons -5.10
6 Storm vs. Eels May 11 Storm 7.00
7 Roosters vs. Raiders May 12 Roosters 7.20
8 Rabbitohs vs. Cowboys May 12 Rabbitohs 8.80


Do the numbers make sense?

From USA Today, via Twitter

These figures don’t make a lot of sense.

Firstly, that’s a really high proportion of median income.  You can easily find median household income in the US as just over $60,000.  If a typical household had two members who each spent $18,000 on “nonessentials”, that’s more than half their total income, which is hard to believe.  [We’re just doing obvious credibility checks here, but from more detailed data (table H-15)  the median per-person household income is $34,000]

It’s still possible that the figures are true, but really are means and have nothing to do with the “typical American”.  But consider the numbers for subscription boxes and rideshares. If these are means for adults in the US, we can multiply by 250 million to get the corresponding totals of just under and just over $290 billion per year. A quick Google search finds that Uber’s gross income from bookings was about $14 billion last year (which I think includes Uber Eats as well as rideshare). Uber is the largest rideshare company, and there’s no way it’s only 5% of the total market.

It’s harder to find data for e-commerce subscription boxes, but McKinsey says total revenue for the companies in that category that are on a list of the top 500 internet retailers was $2.6 billion in 2016, and whatever people say about long-tail e-commerce, I don’t believe those top companies have less than 1% of the market.

If you click through to look for the data source, there’s nothing there that gives any information. Nothing about the questions asked; nothing about how the people were selected; nothing about how representative the sample ended up being.

Chris Knox (of the NZ Herald) pointed me to a twitter thread where Kate Rabinowitz (of the Washington Post) compared the numbers to the Bureau of Labor Statistics’ Consumer Expenditure (CE) Survey.  Clearly some reporters understand the issue.  But it shouldn’t be possible for a life insurance company to report a dubious survey as a way to get advertising in a major newspaper. Make them buy an ad instead.


May 7, 2019

Super Rugby Predictions for Round 13

Team Ratings for Round 13

The basic method is described on my Department home page.
Here are the team ratings prior to this week’s games, along with the ratings at the start of the season.

Current Rating Rating at Season Start Difference
Crusaders 16.73 17.67 -0.90
Hurricanes 8.10 9.43 -1.30
Highlanders 4.83 4.01 0.80
Chiefs 2.79 8.56 -5.80
Lions 2.08 8.28 -6.20
Sharks 1.44 0.45 1.00
Jaguares 1.33 -0.26 1.60
Brumbies -0.21 0.00 -0.20
Bulls -0.43 -3.79 3.40
Stormers -0.45 -0.39 -0.10
Waratahs -0.49 2.00 -2.50
Blues -1.65 -3.42 1.80
Rebels -3.12 -7.26 4.10
Reds -5.53 -8.19 2.70
Sunwolves -14.43 -16.08 1.60


Performance So Far

So far there have been 78 matches played, 50 of which were correctly predicted, a success rate of 64.1%.
Here are the predictions for last week’s games.

Game Date Score Prediction Correct
1 Crusaders vs. Sharks May 03 21 – 21 21.90 FALSE
2 Reds vs. Sunwolves May 03 32 – 26 13.80 TRUE
3 Hurricanes vs. Rebels May 04 29 – 19 15.90 TRUE
4 Highlanders vs. Chiefs May 04 31 – 31 6.30 FALSE
5 Brumbies vs. Blues May 04 26 – 21 5.50 TRUE
6 Bulls vs. Waratahs May 04 28 – 21 3.70 TRUE
7 Jaguares vs. Stormers May 04 30 – 25 5.90 TRUE


Predictions for Round 13

Here are the predictions for Round 13. The prediction is my estimated expected points difference with a positive margin being a win to the home team, and a negative margin a win to the away team.

Game Date Winner Prediction
1 Blues vs. Hurricanes May 10 Hurricanes -6.20
2 Rebels vs. Reds May 10 Rebels 5.90
3 Bulls vs. Crusaders May 10 Crusaders -13.20
4 Highlanders vs. Jaguares May 11 Highlanders 7.50
5 Chiefs vs. Sharks May 11 Chiefs 5.40
6 Lions vs. Waratahs May 11 Lions 6.60
7 Brumbies vs. Sunwolves May 12 Brumbies 18.20


Rugby Premiership Predictions for Round 22

Team Ratings for Round 22

The basic method is described on my Department home page.
Here are the team ratings prior to this week’s games, along with the ratings at the start of the season.

Current Rating Rating at Season Start Difference
Saracens 11.03 11.19 -0.20
Exeter Chiefs 9.05 11.13 -2.10
Northampton Saints 5.44 3.42 2.00
Gloucester Rugby 4.01 1.23 2.80
Bath Rugby 3.18 3.11 0.10
Wasps 2.08 8.30 -6.20
Harlequins 2.07 2.05 0.00
Sale Sharks 1.37 -0.81 2.20
Leicester Tigers -0.03 6.26 -6.30
Worcester Warriors -1.76 -5.18 3.40
Bristol -1.85 -5.60 3.80
Newcastle Falcons -3.00 -3.51 0.50


Performance So Far

So far there have been 126 matches played, 86 of which were correctly predicted, a success rate of 68.3%.
Here are the predictions for last week’s games.

Game Date Score Prediction Correct
1 Bath Rugby vs. Wasps May 04 29 – 17 5.40 TRUE
2 Bristol vs. Sale Sharks May 04 20 – 20 2.80 FALSE
3 Gloucester Rugby vs. Newcastle Falcons May 04 28 – 19 13.30 TRUE
4 Harlequins vs. Leicester Tigers May 04 23 – 19 8.40 TRUE
5 Northampton Saints vs. Worcester Warriors May 04 38 – 10 11.20 TRUE
6 Saracens vs. Exeter Chiefs May 04 38 – 7 5.40 TRUE


Predictions for Round 22

Here are the predictions for Round 22. The prediction is my estimated expected points difference with a positive margin being a win to the home team, and a negative margin a win to the away team.

Game Date Winner Prediction
1 Exeter Chiefs vs. Northampton Saints May 18 Exeter Chiefs 9.10
2 Leicester Tigers vs. Bath Rugby May 18 Leicester Tigers 2.30
3 Newcastle Falcons vs. Bristol May 18 Newcastle Falcons 4.40
4 Sale Sharks vs. Gloucester Rugby May 18 Sale Sharks 2.90
5 Wasps vs. Harlequins May 18 Wasps 5.50
6 Worcester Warriors vs. Saracens May 18 Saracens -7.30