Posts from December 2019 (14)

December 31, 2019

Pro14 Predictions for Round 10

Team Ratings for Round 10

The basic method is described on my Department home page.
Here are the team ratings prior to this week’s games, along with the ratings at the start of the season.

Current Rating Rating at Season Start Difference
Leinster 15.18 12.20 3.00
Munster 8.55 10.73 -2.20
Glasgow Warriors 6.06 9.66 -3.60
Ulster 4.35 1.89 2.50
Edinburgh 3.98 1.24 2.70
Scarlets 3.04 3.91 -0.90
Connacht 1.38 2.68 -1.30
Cheetahs 0.90 -3.38 4.30
Cardiff Blues 0.84 0.54 0.30
Ospreys -2.91 2.80 -5.70
Treviso -3.41 -1.33 -2.10
Dragons -9.12 -9.31 0.20
Southern Kings -13.18 -14.70 1.50
Zebre -15.66 -16.93 1.30


Performance So Far

So far there have been 61 matches played, 48 of which were correctly predicted, a success rate of 78.7%.
Here are the predictions for last week’s games.

Game Date Score Prediction Correct
1 Cardiff Blues vs. Dragons Dec 27 16 – 12 16.00 TRUE
2 Scarlets vs. Ospreys Dec 27 44 – 0 8.80 TRUE
3 Ulster vs. Connacht Dec 28 35 – 3 6.20 TRUE
4 Treviso vs. Zebre Dec 28 36 – 25 18.60 TRUE
5 Edinburgh vs. Glasgow Warriors Dec 29 29 – 19 1.40 TRUE
6 Munster vs. Leinster Dec 29 6 – 13 -0.50 TRUE


Predictions for Round 10

Here are the predictions for Round 10. The prediction is my estimated expected points difference with a positive margin being a win to the home team, and a negative margin a win to the away team.

Game Date Winner Prediction
1 Cardiff Blues vs. Scarlets Jan 04 Cardiff Blues 2.80
2 Ulster vs. Munster Jan 04 Ulster 0.80
3 Treviso vs. Glasgow Warriors Jan 04 Glasgow Warriors -3.00
4 Dragons vs. Ospreys Jan 05 Ospreys -1.20
5 Zebre vs. Cheetahs Jan 05 Cheetahs -10.10
6 Leinster vs. Connacht Jan 05 Leinster 18.80
7 Edinburgh vs. Southern Kings Jan 05 Edinburgh 23.70


Rugby Premiership Predictions for Round 8

Team Ratings for Round 8

The basic method is described on my Department home page.
Here are the team ratings prior to this week’s games, along with the ratings at the start of the season.

Current Rating Rating at Season Start Difference
Saracens 9.72 9.34 0.40
Exeter Chiefs 7.74 7.99 -0.30
Northampton Saints 2.30 0.25 2.00
Gloucester 1.84 0.58 1.30
Sale Sharks 1.73 0.17 1.60
Bath 0.99 1.10 -0.10
Harlequins -1.32 -0.81 -0.50
Wasps -2.12 0.31 -2.40
Bristol -2.40 -2.77 0.40
Worcester Warriors -2.71 -2.69 -0.00
Leicester Tigers -3.89 -1.76 -2.10
London Irish -5.67 -5.51 -0.20


Performance So Far

So far there have been 42 matches played, 31 of which were correctly predicted, a success rate of 73.8%.
Here are the predictions for last week’s games.

Game Date Score Prediction Correct
1 Bristol vs. Wasps Dec 28 21 – 26 5.40 FALSE
2 Northampton Saints vs. Gloucester Dec 29 33 – 26 4.60 TRUE
3 Bath vs. Sale Sharks Dec 29 16 – 14 4.10 TRUE
4 Worcester Warriors vs. London Irish Dec 29 20 – 6 6.60 TRUE
5 Harlequins vs. Leicester Tigers Dec 29 30 – 30 8.00 FALSE
6 Exeter Chiefs vs. Saracens Dec 30 14 – 7 1.90 TRUE


Predictions for Round 8

Here are the predictions for Round 8. The prediction is my estimated expected points difference with a positive margin being a win to the home team, and a negative margin a win to the away team.

Game Date Winner Prediction
1 Sale Sharks vs. Harlequins Jan 04 Sale Sharks 7.60
2 Gloucester vs. Bath Jan 05 Gloucester 5.30
3 Leicester Tigers vs. Bristol Jan 05 Leicester Tigers 3.00
4 Saracens vs. Worcester Warriors Jan 05 Saracens 16.90
5 London Irish vs. Exeter Chiefs Jan 06 Exeter Chiefs -8.90
6 Wasps vs. Northampton Saints Jan 06 Wasps 0.10


December 27, 2019

Pro14 Predictions for Round 9

My apologies for the late publication of these predictions. I was too distracted by Christmas.

Team Ratings for Round 9

The basic method is described on my Department home page.
Here are the team ratings prior to this week’s games, along with the ratings at the start of the season.

Current Rating Rating at Season Start Difference
Leinster 14.59 12.20 2.40
Munster 9.14 10.73 -1.60
Glasgow Warriors 6.84 9.66 -2.80
Ulster 3.47 1.89 1.60
Edinburgh 3.20 1.24 2.00
Connacht 2.26 2.68 -0.40
Scarlets 1.95 3.91 -2.00
Cardiff Blues 1.35 0.54 0.80
Cheetahs 0.90 -3.38 4.30
Ospreys -1.82 2.80 -4.60
Treviso -2.73 -1.33 -1.40
Dragons -9.63 -9.31 -0.30
Southern Kings -13.18 -14.70 1.50
Zebre -16.34 -16.93 0.60


Performance So Far

So far there have been 55 matches played, 42 of which were correctly predicted, a success rate of 76.4%.
Here are the predictions for last week’s games.

Game Date Score Prediction Correct
1 Leinster vs. Ulster Dec 21 54 – 42 17.00 TRUE
2 Zebre vs. Treviso Dec 22 8 – 13 -9.40 TRUE
3 Connacht vs. Munster Dec 22 14 – 19 -1.20 TRUE
4 Dragons vs. Scarlets Dec 22 22 – 20 -7.40 FALSE
5 Glasgow Warriors vs. Edinburgh Dec 22 20 – 16 9.70 TRUE
6 Ospreys vs. Cardiff Blues Dec 22 16 – 19 2.90 FALSE


Predictions for Round 9

Here are the predictions for Round 9. The prediction is my estimated expected points difference with a positive margin being a win to the home team, and a negative margin a win to the away team.

Game Date Winner Prediction
1 Cardiff Blues vs. Dragons Dec 27 Cardiff Blues 16.00
2 Scarlets vs. Ospreys Dec 27 Scarlets 8.80
3 Ulster vs. Connacht Dec 28 Ulster 6.20
4 Treviso vs. Zebre Dec 28 Treviso 18.60
5 Edinburgh vs. Glasgow Warriors Dec 29 Edinburgh 1.40
6 Munster vs. Leinster Dec 29 Leinster -0.50


Rugby Premiership Predictions for Round 7

Team Ratings for Round 7

The basic method is described on my Department home page.
Here are the team ratings prior to this week’s games, along with the ratings at the start of the season.

Current Rating Rating at Season Start Difference
Saracens 10.04 9.34 0.70
Exeter Chiefs 7.42 7.99 -0.60
Northampton Saints 2.11 0.25 1.90
Gloucester 2.03 0.58 1.40
Sale Sharks 1.57 0.17 1.40
Bath 1.16 1.10 0.10
Harlequins -0.85 -0.81 -0.00
Bristol -1.82 -2.77 1.00
Wasps -2.71 0.31 -3.00
Worcester Warriors -3.15 -2.69 -0.50
Leicester Tigers -4.36 -1.76 -2.60
London Irish -5.23 -5.51 0.30


Performance So Far

So far there have been 36 matches played, 27 of which were correctly predicted, a success rate of 75%.
Here are the predictions for last week’s games.

Game Date Score Prediction Correct
1 Gloucester vs. Worcester Warriors Dec 21 36 – 3 7.10 TRUE
2 Leicester Tigers vs. Exeter Chiefs Dec 22 22 – 31 -7.00 TRUE
3 Sale Sharks vs. Northampton Saints Dec 22 22 – 10 2.90 TRUE
4 Saracens vs. Bristol Dec 22 47 – 13 14.30 TRUE
5 Wasps vs. Harlequins Dec 22 22 – 28 3.80 FALSE
6 London Irish vs. Bath Dec 23 10 – 38 0.90 FALSE


Predictions for Round 7

Here are the predictions for Round 7. The prediction is my estimated expected points difference with a positive margin being a win to the home team, and a negative margin a win to the away team.

Game Date Winner Prediction
1 Bristol vs. Wasps Dec 28 Bristol 5.40
2 Northampton Saints vs. Gloucester Dec 29 Northampton Saints 4.60
3 Bath vs. Sale Sharks Dec 29 Bath 4.10
4 Worcester Warriors vs. London Irish Dec 29 Worcester Warriors 6.60
5 Harlequins vs. Leicester Tigers Dec 29 Harlequins 8.00
6 Exeter Chiefs vs. Saracens Dec 30 Exeter Chiefs 1.90


December 25, 2019

Before their light / The stars grew dim

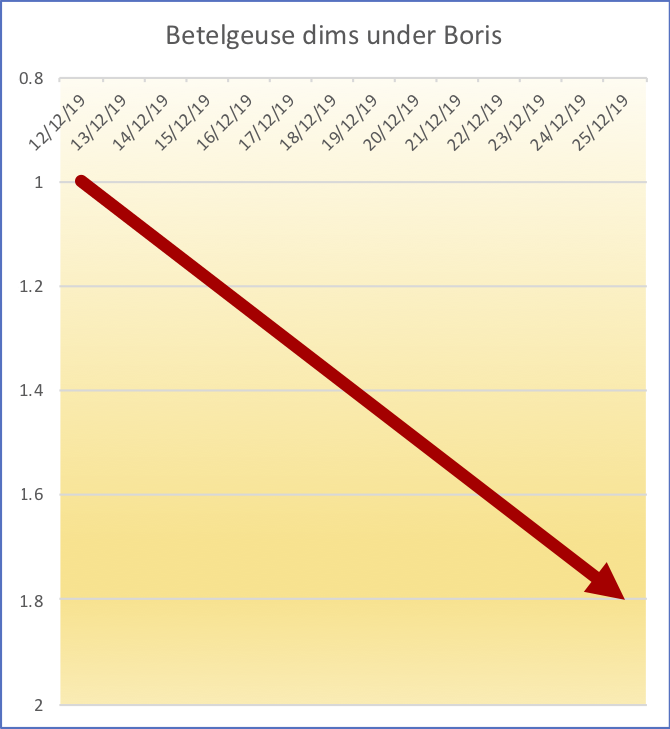
Betelgeuse, the bright red star at the base1 of Orion, has suddenly dimmed, enough that people who aren’t astronomers may be able to tell by looking at it.

Here’s a simple graph. Yes, the y-axis goes down rather than up.  Astronomers are weird that way.

Here’s a more detailed version of the same thing, from the AAVSO website, which includes all the available observations. You can see that the latest dimming did pretty much coincide with the UK election2

As StatsChat readers will know, it’s unwise to draw strong conclusions from a short time series if a longer one is available.  I asked the AAVSO webserver for all its Betelgeuse data. I trimmed off some clearly outlying values (if it weren’t Christmas I would have asked an astronomer first).

Here’s the graph for this year

The gap in autumn/winter is because Betelgeuse is out during the day at that time of year, and so isn’t visible except in Antarctica.

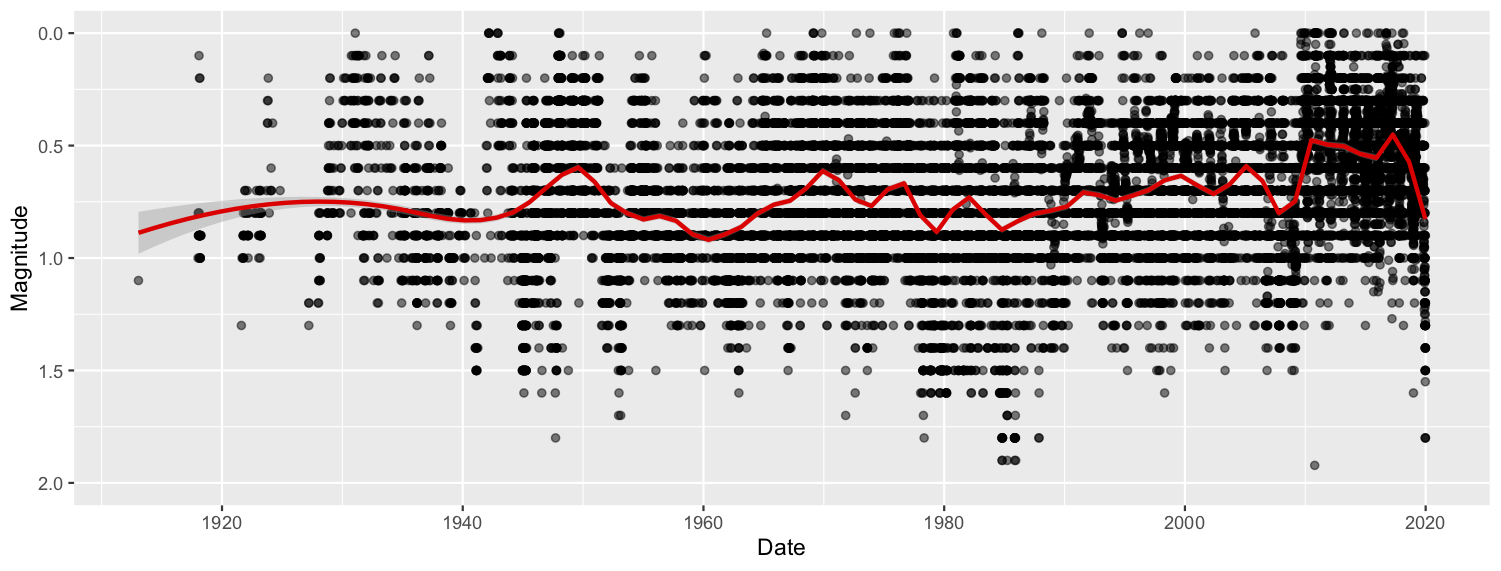
Here’s all the values between 2 and -1 magnitude, back as far as AAVSO collects. There’s been a decrease since


So, while the current dimming is extreme,  it also looks like this is a thing Betelgeuse does.  That’s what astronomy twitter is saying.

There’s been media coverage of the dimming, including speculation that the star is about to go supernova.  Mostly, the reports have been good: saying that it could go any time, but pointing out that ‘any time’ on astronomical time scales means any time between 700 years ago and 100,000 or so years in the future.


1. StatsChat is in the southern hemisphere

2. Well, except for the time lag of about 700 years in the light getting here. They must have very good long-range polling on Betelgeuse. They probably use MRP.

December 24, 2019

Grandma got run over by a reindeer

The Accident Compensation Corporation, a wonderful NZ institution, always takes advantage of the season to try to get coverage of Christmas accident risks. There are two popular angles, and this year our newspaper sites have one each.

The NZ Herald writes about the total cost of Christmas claims.  These, according to the story, are steadily increasing: $448k in 2014, $497k last year. The increase, of nearly 11%, needs to be compared to the population increase of about 8.4% (June 2014 to June 2018) and to inflation of about 5%.  Christmas accident claims have increased very slightly per capita in nominal dollars, and decreased very slightly per capita in constant dollars.  And, as the story admits, Christmas Day is not a particularly high-risk day — it’s compared there to New Year’s Day, but it actually has lower ACC costs than a typical day.

On Stuff, the story is about holiday-specific accidents. Here we’re on stronger ground.   The Christmas tree, pavlova, and turkey injuries are reliably attributable to Christmas; we’re talking causation, not just correlation.  If I were feeling pickier than is appropriate for the season, I might complain about “Turkey was a slightly safer option”  comparing turkey and ham-related injuries: we don’t know that turkey was safer, since we’d need the number of people at risk from turkey and ham to draw that conclusion.

The song referenced in the title makes clear the difference between injuries occurring at Christmas and those caused by the season — “she had hoof-prints on her forehead / And incriminating Claus marks on her back”.  Even though there are fewer injuries on Christmas Day, we can still tell that some of them are Christmas injuries. It makes sense for ACC to try to reduce these, especially given the reduced competition for news coverage at this time of year.


December 17, 2019

More political graphics

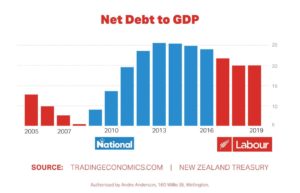
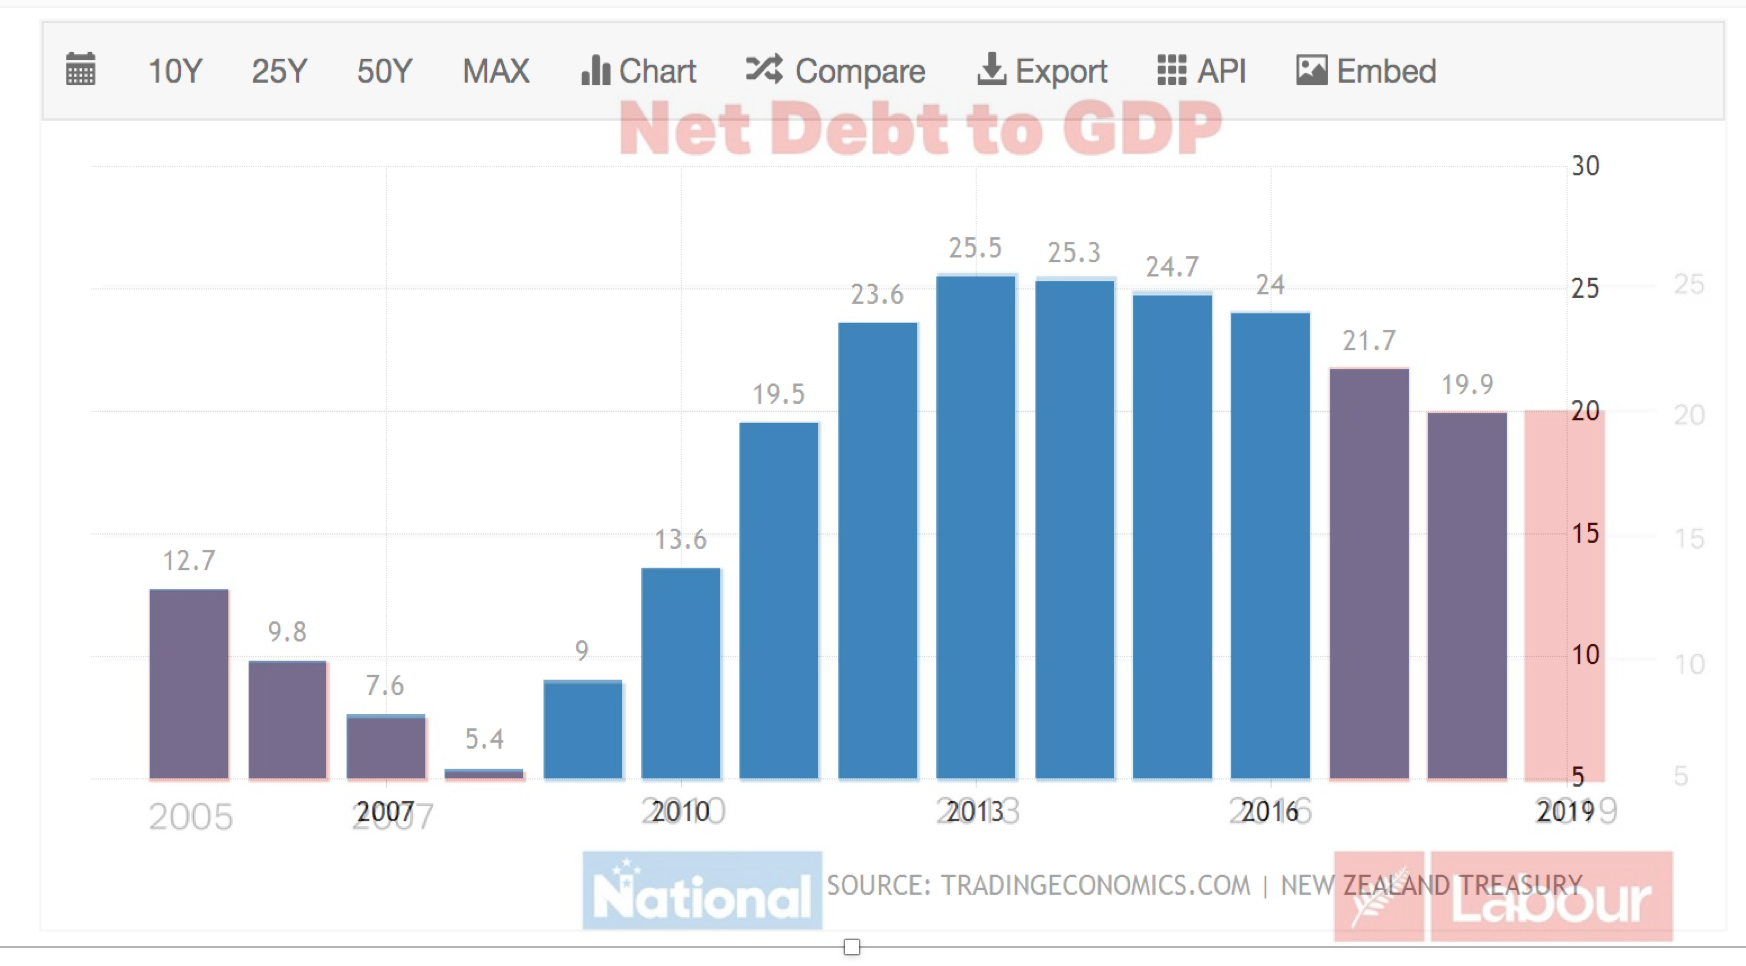
This one is from Young Labour, and as with the previous examples it was retweeted  into my Twitter feed. It’s a useful contrast to the previous, since it’s misleading only in the standard ways you expect from political graphs; it’s not an outright distortion.

Good points: there is a reasonable data range, which is important for time-series comparisons. The vertical axis is labelled, and the labels match the quantities they are supposed to match.

From an economic point of view, there’s a problem.  The increase in debt under John Key’s government was largely due to the Great Recession.  Labour, one would hope, would also have run deficits during a major recession — that’s what you do — and there’s no way that the Great Recession can be blamed on the NZ National Party.  So, as is often the case, there are important confounding factors in the time series.  The numbers are right, but they don’t really support the obvious causal conclusion.

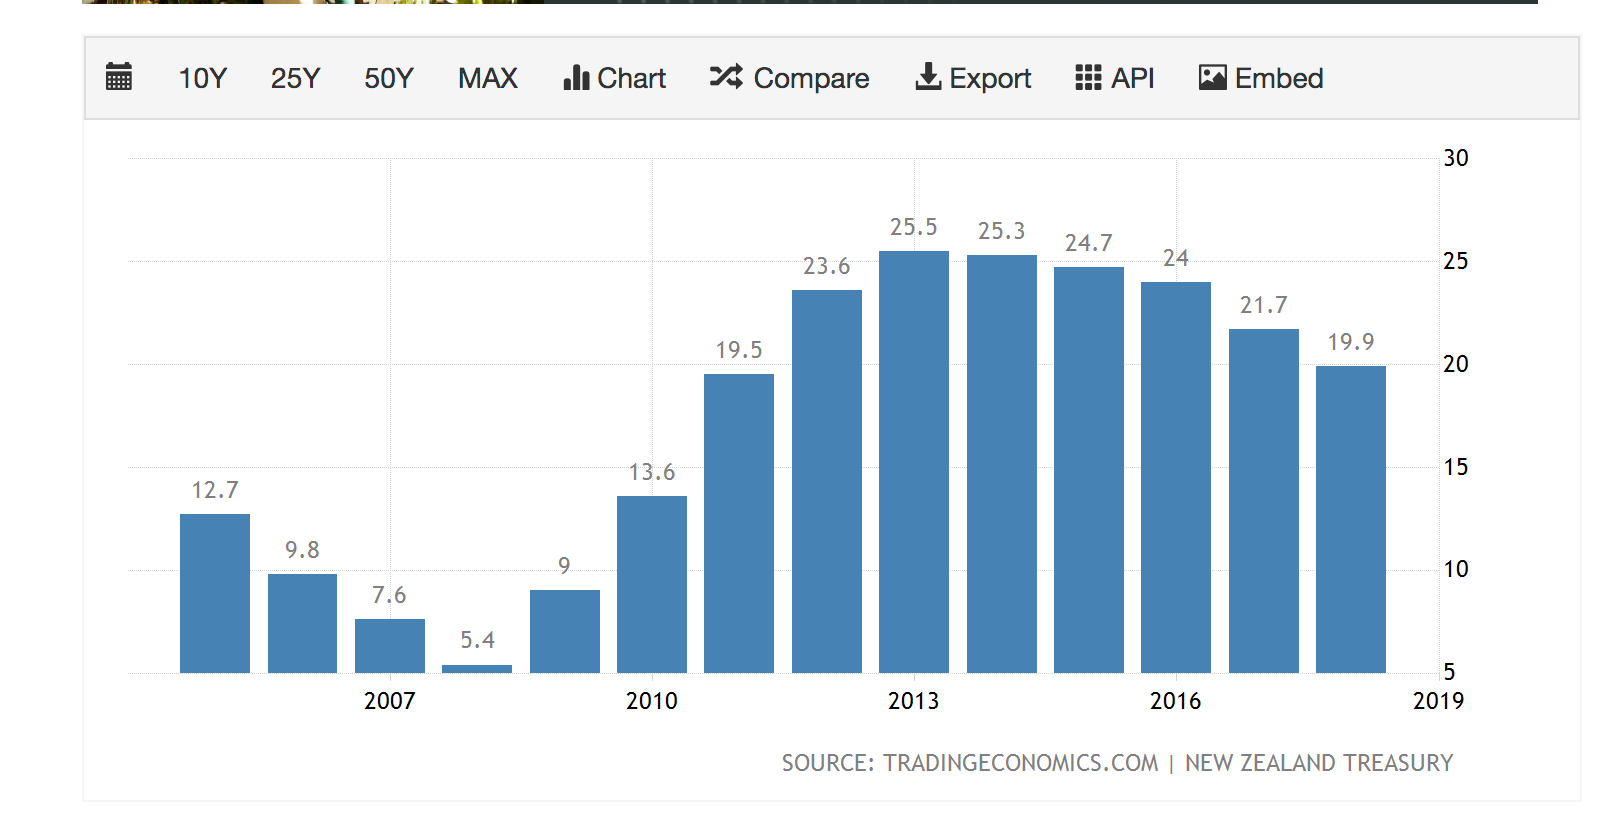
The graphical criticism: the vertical axis begins at 5% rather than at 0.  While for line graphs there are a range of  views about when zero needs to be included and how, there really aren’t for bar graphs. The area of the bar is supposed to convey information.

If you look up the data source, you find that it truncates the vertical axis in exactly the same way, which is presumably the reason (though hardly an excuse)

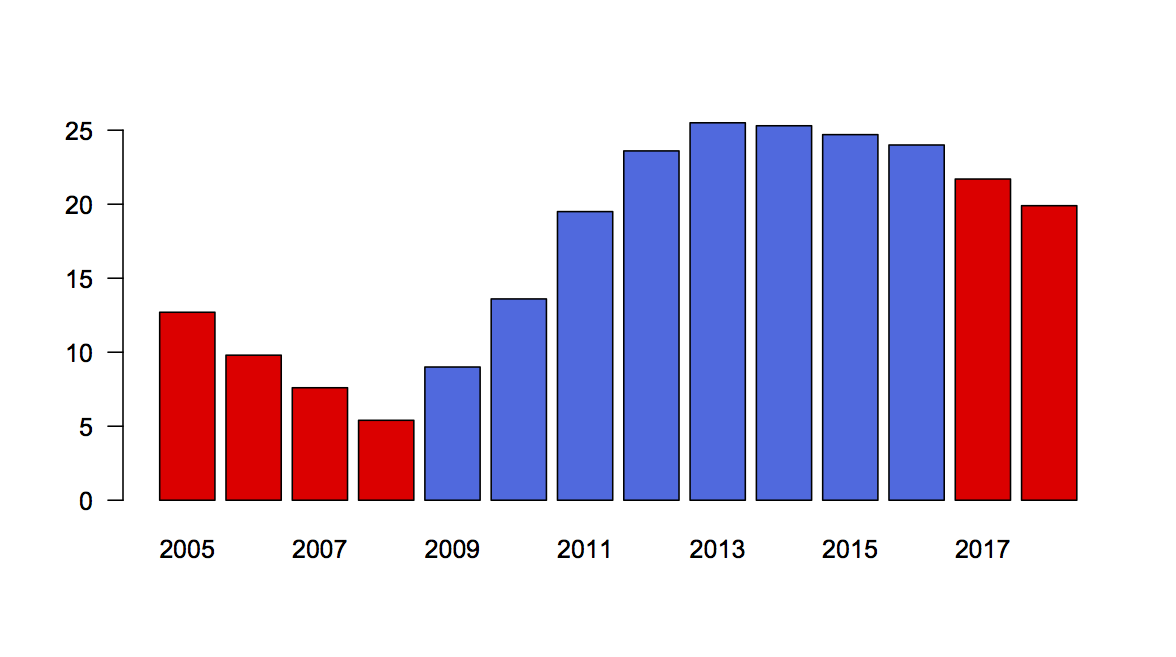
Redrawing, we can see what the graph should have looked like; I think the distorting effect is real but relatively small, especially for the last decade (which, again, not an excuse)

And, in fact, using the wonders of PowerPoint and image transparency, I found that the Young Labour graphic and the one from the TradingEconomics.com can be exactly superimposed — which I suppose argues against the vertical distortion being deliberate.

There’s just one more thing.

You will have noticed, perhaps, that my redrawn graphic has two red bars on the right-hand end, but Young Labour’s has three, with the last two at about the same height. If I hadn’t gone to the effort of superimposing the two versions I would have thought it was probably due to different divisions of the time axis or something.  But it’s not. An extra bar has been added. That’s a bit suspicious.

Or, it would be if it weren’t about the same height as the previous bar.  It turns out, if you go to the Treasury’s  Interim Financial Statements for the four months ending 2019-10-31, you find a figure of 20.2%, which seems to be the height for the last bar. On the one hand, that’s not precisely comparable to the rest of the graph; on the other hand, it’s probably the best that could be done, and shows a reasonable degree of care.

Briefly

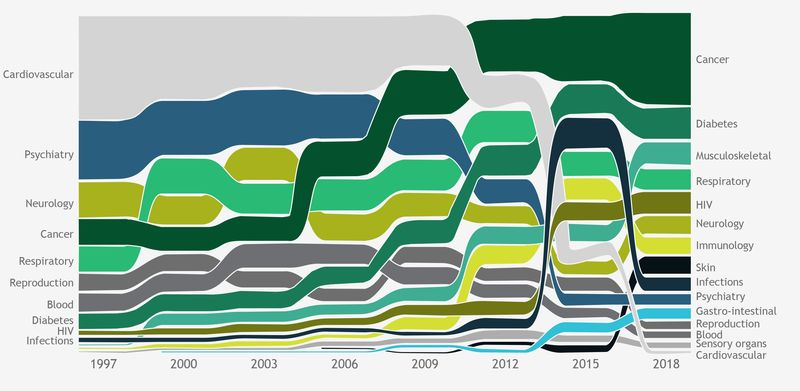
  • Bloomberg News writes about drug prices.  Their point is expensive cancer drugs, but their graph also shows how drugs for heart disease have become much, much less expensive as they go off patent (the light-grey area)
  • Census 2018 small-area data now available.  These go down to SA1, the smallest area unit for published results now.  About two-thirds of SA1s are a single meshblock, but some are multiple meshblocks to get the population size higher. Read the footnotes (always, but especially with the 2018 census)
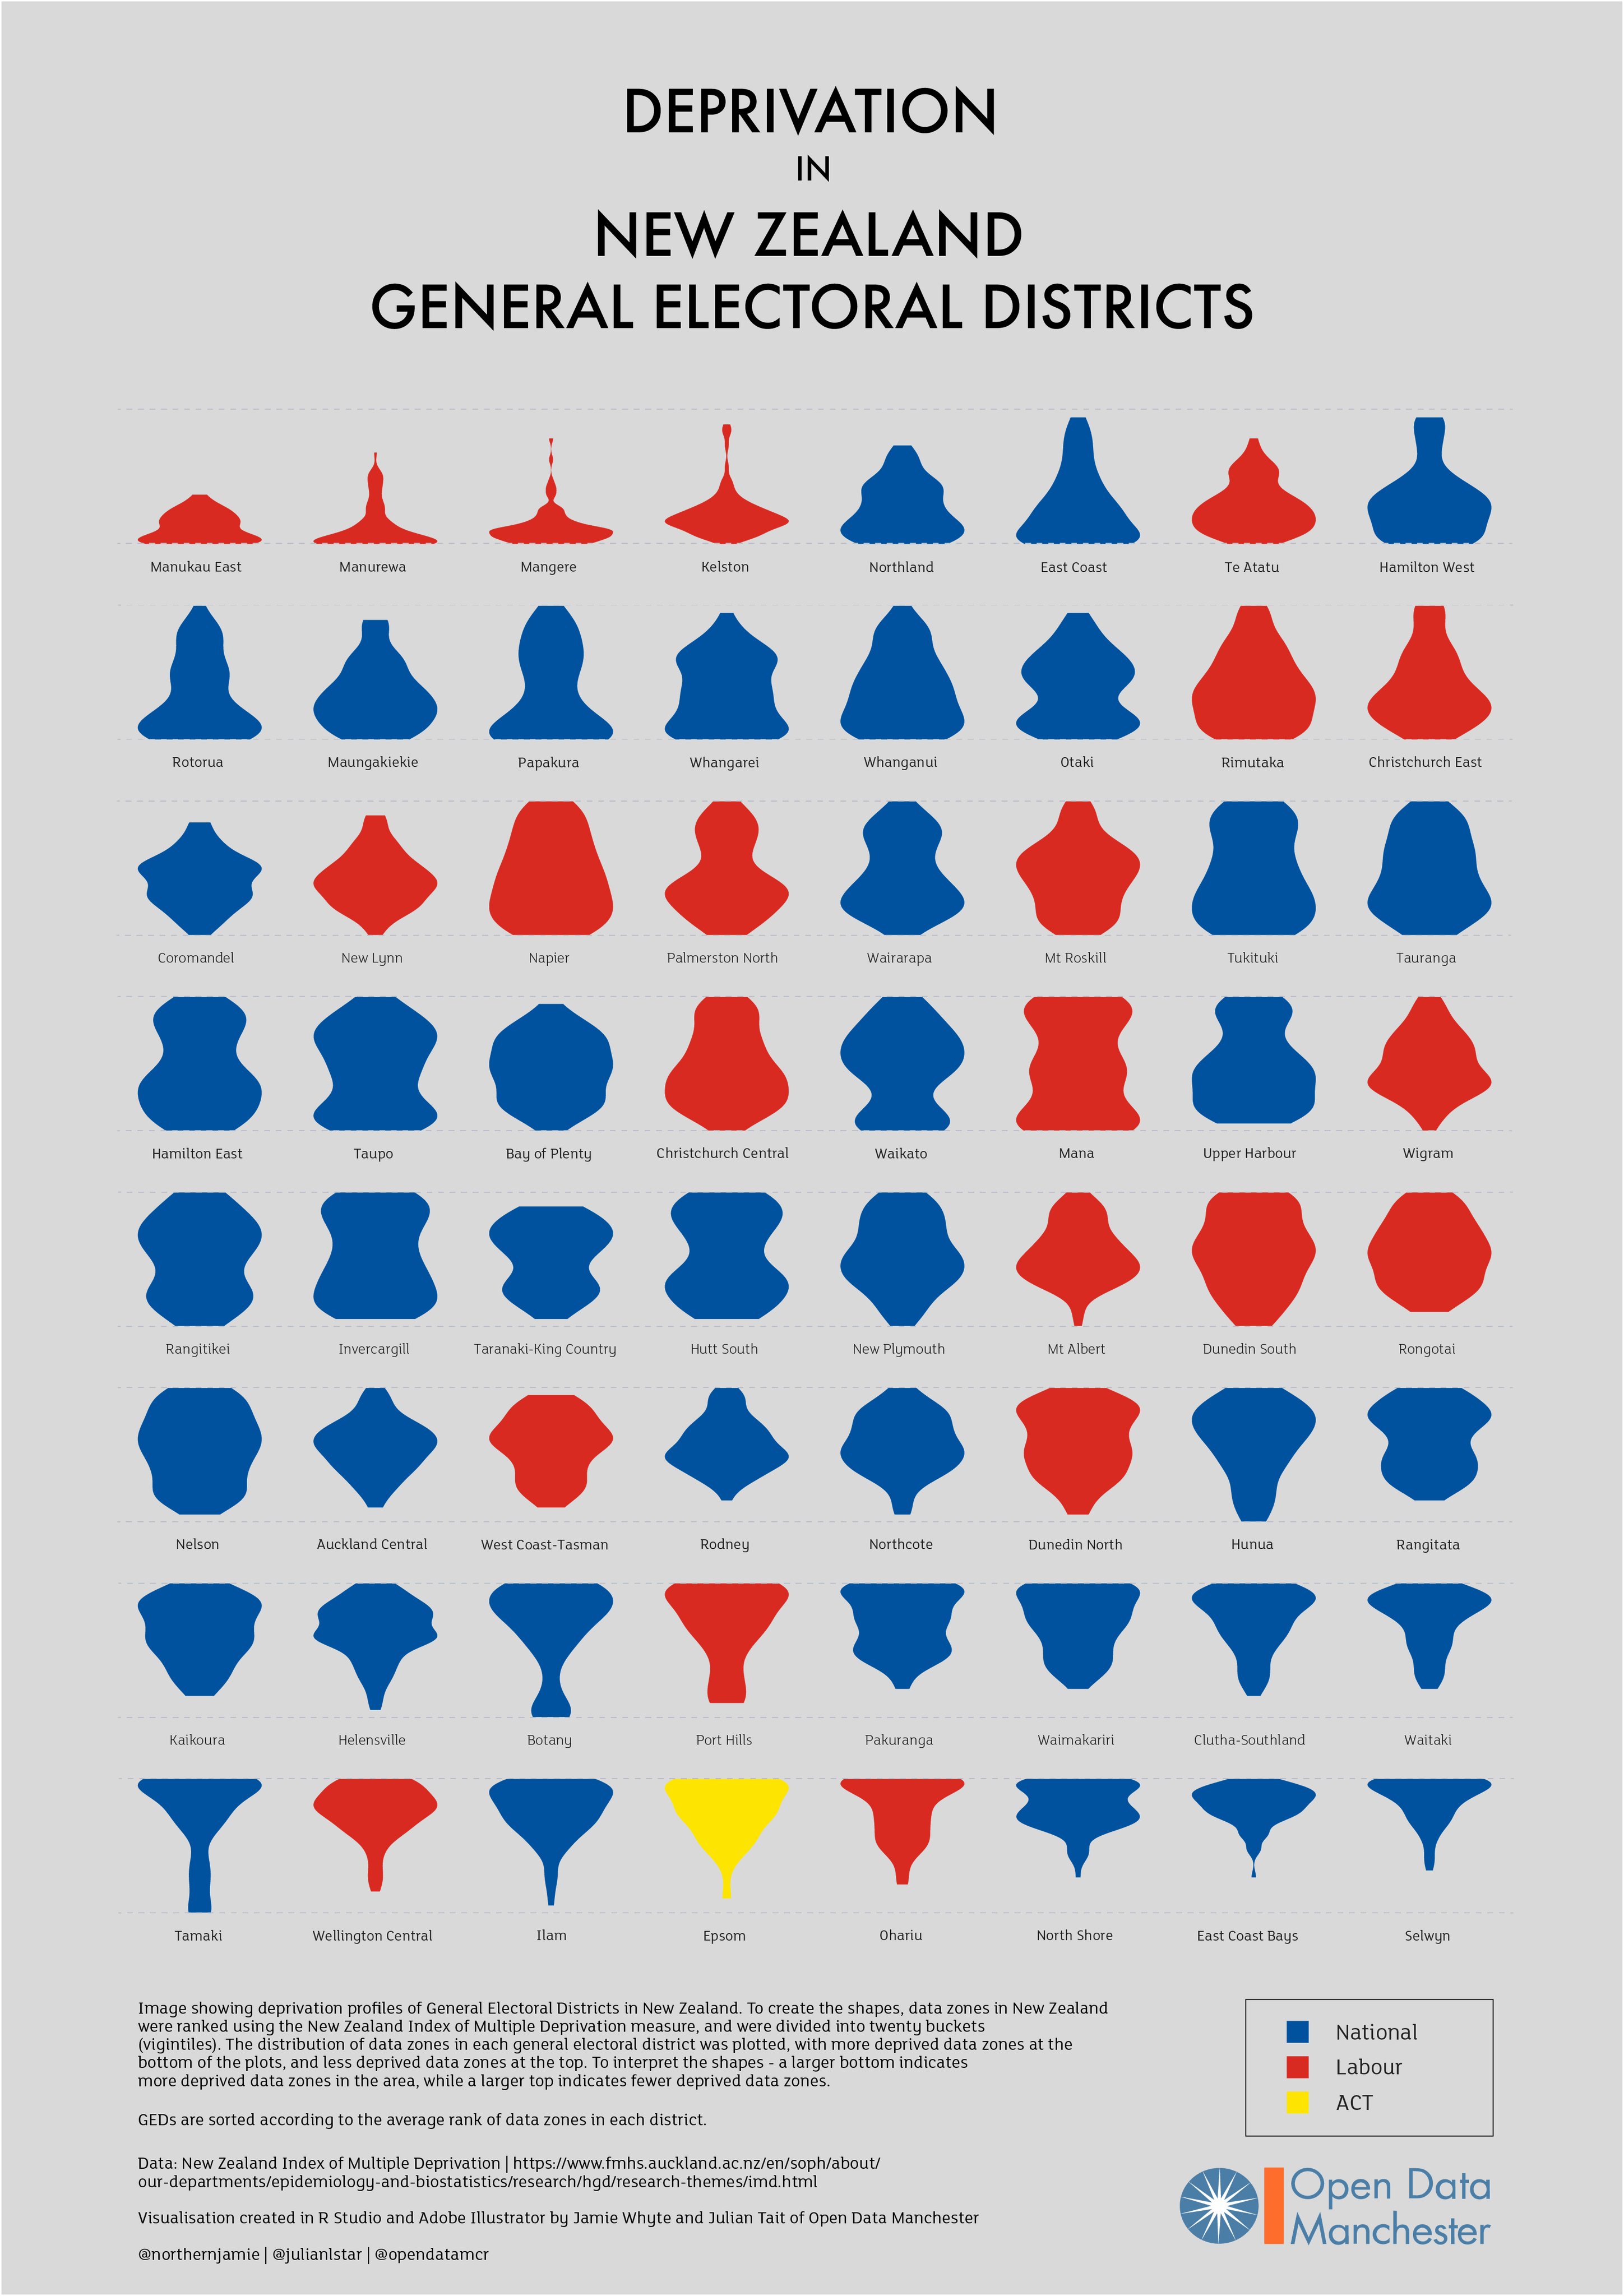
  • Jamie Whyte of Open Data Manchester has extended his inequality graphs to NZ (click to embiggen). Each blob shows a general electorate, and the width of the blob shows the proportion of people at various levels of the Index of Multiple Deprivation. So, for example, Manurewa is mostly high-deprivation, Selwyn (bottom right) is low. In the middle of the graphic, Hutt South and New Plymouth have opposite shapes: one has most people in the middle, the other has more people at the bottom and the top. There are two important caveats here compared to the UK version: this is based on everyone living in a general electorate regardless of which roll they are on, so it misses the Māori electoral roll and it misses the impact of List MPs.
  • Twitter thread from Peter Aldhous (of Buzzfeed), on DNA testing and media coverage over the past decade
  • NZ is still under-vaccinated for measles. At the moment there’s still a shortage of vaccine, but at some convenient point in the future you should make sure you’ve had your two shots.
  • Figure.NZ is seven years old — 44,000 graphs of NZ data
  • ‘Even if Kāinga Ora’s intentions were good, she was still concerned about “a creeping, increasing type of surveillance capacity being built … without mechanisms that allow communities to be really engaged in the process”‘.  Donna Cormack on the plans to put lots of sensors in state houses. There are obvious good uses of this sort of data, and bad uses, and the project would be better off with more information about how the data would be restricted to good uses (if that’s the plan).
December 12, 2019

Say something nice about a journalist

Alex Brae, who writes The Spinoff’s  daily news summary  (which you should sign up for), is having “Say something nice about a journalist” week.

As a site that mostly specialises in not saying nice things about journalists, we should probably do the same. Here’s a selection: I’ve probably forgotten some.

  • Kirsty Johnston has had a wide range of important stories this year, and is a good reason for subscribing to the Herald.
  • The Herald data journalism team: Chris Knox and Keith Ng (Keith also did some non-data-journalism in Hong Kong)
  • Jamie Morton, the Herald science reporter, has reported a lot of interesting and important science.
  • Farah Hancock has written some very good environmental and health stories for newsroom:  most recently, on the claims that a secret lab had found huge amounts of 1080 in some dead rats when Landcare didn’t, but also on pharmacies pushing homeopathic non-remedies, and on the measles outbreak
  • Eloise Gibson, also of newsroom, for her coverage of Sir Ray Avery and how some of his inventions are progressing and being evaluated, and for stories about radiata pine (big carbon sink) and about water-quality modelling
  • Joel MacManus had a very good piece at Stuff about algorithmic inputs to parole and sentencing
December 10, 2019

More misleading trends

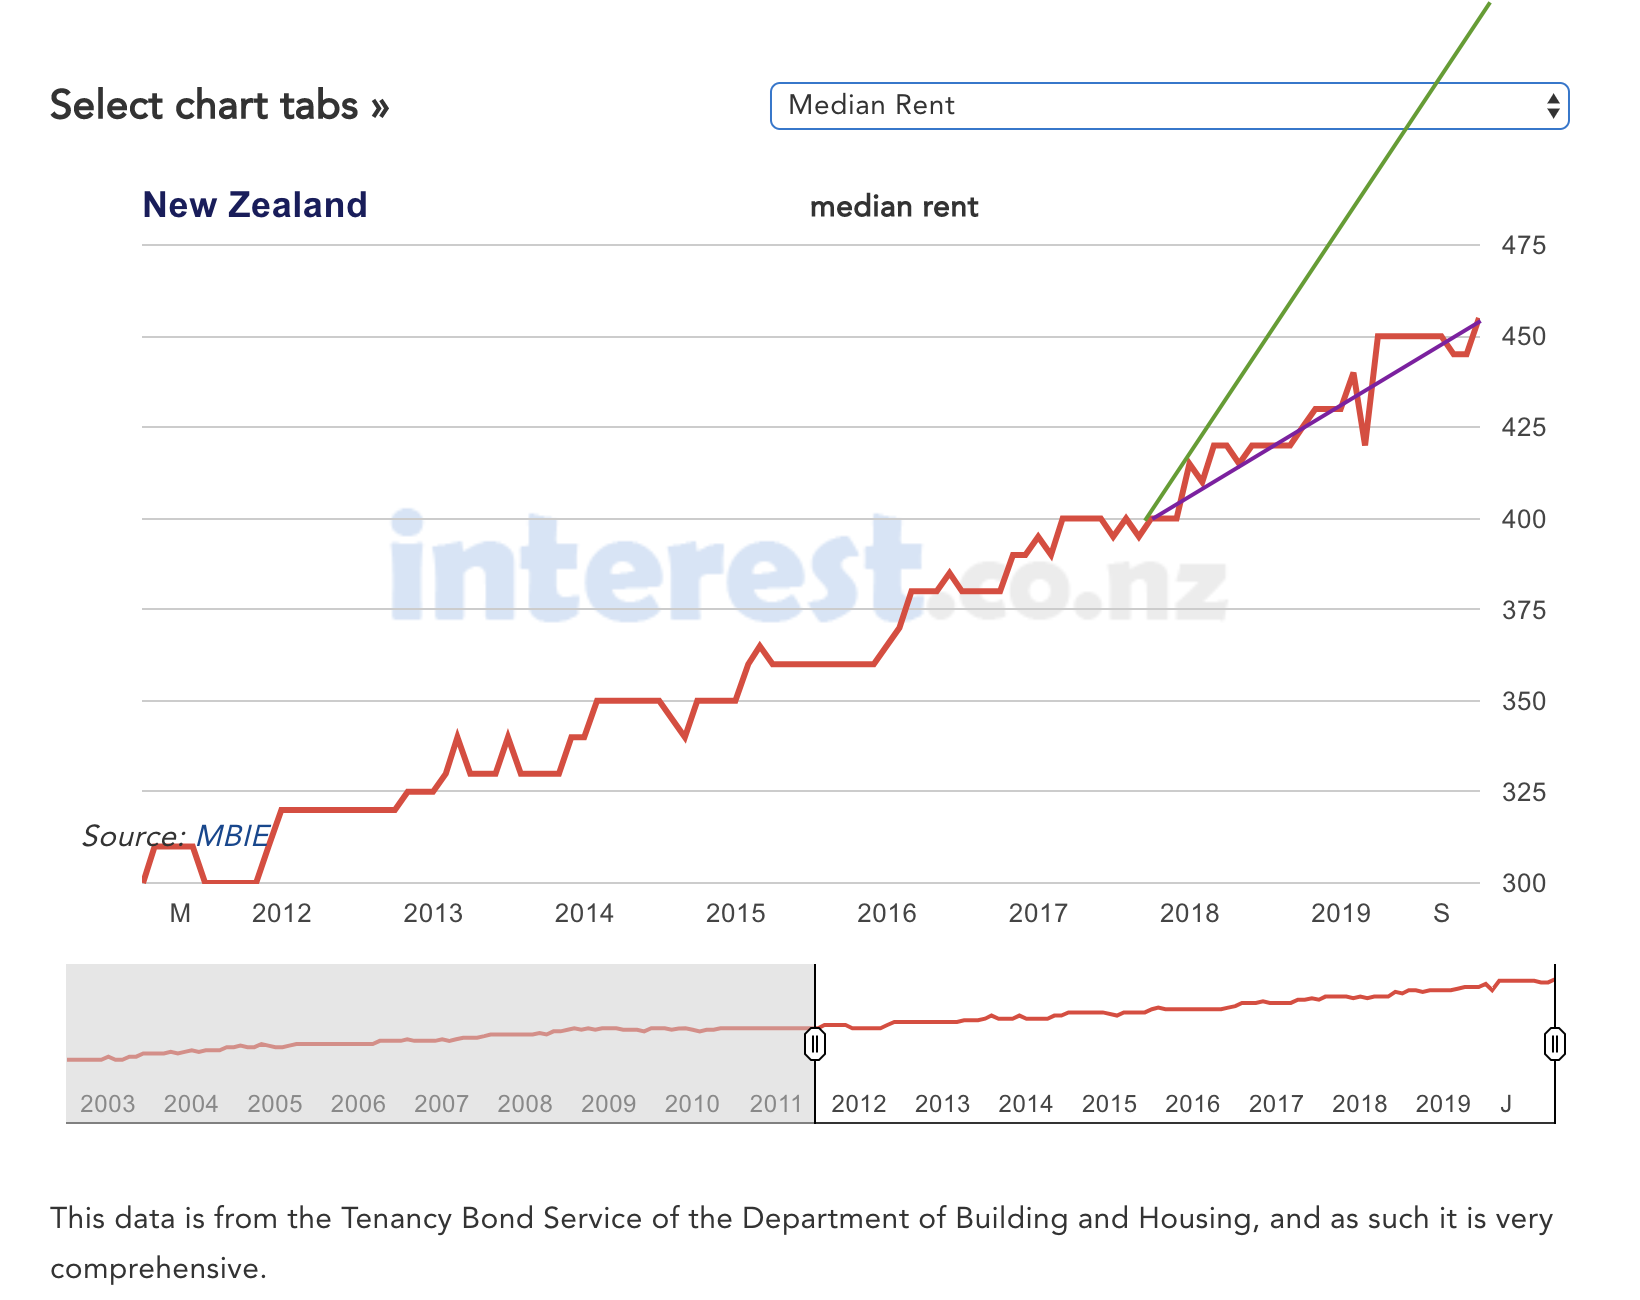
There’s another badly-distorted bar chart being circulated, approved by Simon Bridges. It purports to show median rents in September 2017 and now.  I’m not actually going to reproduce the chart. Instead, look at this chart from interest.co.nz for the period covering the time since the 2011 election (the red line).

Over this time, rents have increased.  The trend is reasonably consistent, not far from 5.5%/year; it might be accelerating a bit.

The purple line shows the trend from September 2017 to now; you can see for yourself how it compares to the previous trend, and decide whether that’s good or bad, and who is to blame.  Presenting just the purple line, without the context, would clearly be a bit misleading.

The green line shows the trend from September 2017 to now more as the latest National Party bar chart depicts it: the bar corresponding to current rents is 39% longer than the bar corresponding to 2017 rents, which would be correct if the current median rent were $556.  Presenting the green line as the trend is more than a bit misleading.

(PS: I don’t want to get heavily into the political fact-checking business, but if the other parties are circulating graphs like these ones I’d be happy annoyed enough to write about them, too)