Posts filed under Just look it up (285)

July 6, 2012

Where does it all go?

In yesterday’s Herald story about alcohol consumption the superficial flaws hid a much more important inaccuracy.

The survey says:

“Of the 113,345,000 glasses of alcohol consumed in New Zealand between February last year and January this year, 28 per cent were drunk by men older than 50,”

Now, Stats New Zealand reports alcohol sales each year, and they say we bought 300 million litres of beer, 100 million litres of wine, and 70 million litres of spirits last year, totalling 33 million litres of pure alcohol.  To make the numbers add up, there would need to be about 290ml of pure alcohol (over 24 standard drinks) in each glass. At most two standard drinks per glass might be realistic as an average, so that’s off by a factor of more than 10  (in a statistic given to six significant figures).

Some of the alcohol would have been consumed by people under 18, who weren’t in the survey, but if they drink 90% of the alcohol sold in NZ we aren’t panicking nearly enough.  Some of it would have been sold to foreigners, and some discarded, but again there’s no way that adds up to 90%.

In fact, the number is implausible on its face: there’s 4.5 million people in NZ, and there must be at least 3 million over 18. That would give an average of only three drinks per month for adult Kiwis.

Even other survey data doesn’t agree. As I pointed out last week, the NZ  Alcohol and Drug Use Survey finds 26% of the adult population drinks more than twice per week. Just those people must rack up more than 113 million glasses per year.

Either someone has lost a decimal place somewhere, or survey respondents lie to Roy Morgan even more than they lie to government researchers.
July 5, 2012

Denominators yet again

Tony Cooper, in a Stat of the Week nomination, point us to the Herald’s headline

“Men over 50 nation’s biggest drinkers”

When you look at the body of the text, though, the data only say that men over 50, in aggregate, drank more than the other subgroups of the population.  That’s somewhat relevant if you are planning a sales campaign, in which case the Roy Morgan report might be useful.  It doesn’t tell you which group are the biggest drinkers, because that depends on per-person alcohol consumption.

As two of the experts actually quoted in the story said, men over 50 accounted for the largest chunk of the booze because there are a lot of men over 50, not because they are the heaviest drinkers.  A little simple arithmetic shows that, per person, men over 50 drank less than men 35-50, and less than men 25-34.  Not doing the arithmetic is one thing, but it really doesn’t look good when the headline also directly contradicts what your sources are quoted as telling you.

June 30, 2012

Drug statistics

As you will have heard, the UN says that Kiwis smoke more pot than anyone else.  The figure quoted, eg, by the Herald is 9.1%-14.6% (they don’t say what the range means).  It’s useful to look at the actual survey data, the NZ Alcohol and Drug Use survey, which is conveniently available online.

The proportion of New Zealanders who used cannabis at least weekly in the past year is about 5.6%, and the proportion who used it more than 1-2 times/week is 3.8%.  For tobacco, the corresponding figure for more than 1-2 times per week is about 20% and for alcohol, 26%.

You can find statistics broken down by age, sex, ethnicity, frequency of use, and indicators of dependency (yes, people do get addicted to cannabis, just like to other drugs).

June 28, 2012

Open data discussions

The political/social science/etc blog Crooked Timber is having a seminar on Open Data, which is highly recommended.  In one of the posts, Steven Berlin Johnson writes about the mid-19th century efforts of William Farr to publish more information on causes of death, information later used by John Snow in attributing cholera to contaminated water.

He concludes:

Yes, information abundance meant that the newspapers lost their local advertising monopolies to Craigslist and Groupon, but it also means that the crucial data they used to have to unearth by hanging around City Hall for months is now available to anyone with a Web browser or an API key. We may well have fewer investigative journalists on the payroll of newspapers, but if we play our Open Data cards right, we might well end up with more investigations.


[Update: these are now all collected in a post and PDF and epub]

June 8, 2012

How dare you measure our air pollution!

For some time, the US Embassy in Beijing has been sending out measurements of local air pollution on Twitter.  These have not always been entirely in agreement with the official readings.  Subsequently, the  Guangzhou and Shanghai consulates have done the same thing.

The government of the People’s Republic of China has formally objected.  They claim that readings from just a few locations are too unreliable to report (a problem that doesn’t seem to affect other nations), and “not only doesn’t abide by the spirits of the Vienna Convention on Diplomatic Relations and Vienna Convention on Consular Relations, but also violates relevant provisions of environmental protection.” 

(via)

Fractional companies or fractional women?

We have a Stat of the Week submission, for the NZ Herald’s claim that

Of Australia’s top 200 listed companies, 12.7 per cent had female directors by the beginning of August, compared to 9.3 per cent for the top 100 listed companies here.

That is, 25.4 of the Australian companies and 9.3 of the NZ companies have female directors.  Perhaps the 0.3 is either only partly a company or partly female.

Or perhaps, since the story mentions earlier that about 9% of all private-sector directors are female, you might guess that 9.3% is the proportion of females among all directors of the NZ 100.  That implies the proportion of companies with at least one female director is almost certainly higher than 9%.

A little Googling confirms this: 43% of the NZ 100 companies (that’s 43 companies, for those of you playing along at home) have at least one female director. 13% have more than one.

June 7, 2012

In real terms

Auckland’s housing prices just hit a new record, says Stuff.  The average (?median, ?mean) price in May according to Barfoot & Thompson was $582285, higher than their reported 2007 peak of $538000. But the dollars are smaller than they were back in 2007.

If you bought a house for $538000 in 2007 dollars and sold it for $582285 in 2012 dollars, you would have made a loss of about $25000 2007 dollars before legal and bank costs.  And with 20% deposit and 6% interest, you’d be paying more than $2500 each month for the privilege (and nearly $4000 for the first couple of years, when interest rates were up at 10%)


May 25, 2012

Smoking taxes

As you will have heard, excises on smoking are going up.  This will raise money (to the extent that smokers don’t quit) and reduce smoking (to the extent that they do quit).   If you’re interested in the modelling used to estimate the impact on these conflicting goals, the Treasury’s Regulatory Impact Statement is a well-written and detailed explanation.

It’s also interesting to note that Treasury agrees the excise costs are already probably higher than the costs to other people imposed by smoking, and since the smoking excise is probably a regressive tax, the only convincing motivation for smoking excise taxes is to stop people smoking and so improve population health in the long term.

In this light it’s interesting that the Herald’s bogus poll for today is on whether increasing costs will lead to fewer smokers: at the moment, only 11% of responders think it will.  Fortunately, there is strong evidence that the poll respondents are wrong.

May 6, 2012

Ranking universities

With the PBRF research assessments happening this year, there is sure to be another round next year of universities using the results in creative ways to make themselves look good.  When you have a large number of variables to take into account, it’s easy to come up with apparently-reasonable weightings that make one institution look better than another.

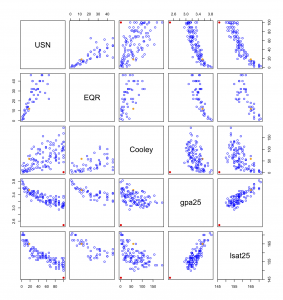
A dramatic example of this is ratings of US law schools.  The most widely-known rankings are from US News, and there’s another popular set from Brian Leiter, a professor at University of Texas, which aims to focus only on quality of education.  A third set is published by the slightly unusual Thomas J. Cooley School of Law.    There is definitely correlation in the top rankings: for example, Harvard tops the Cooley rankings and is second for the other two.   The graph below (click to embiggen) shows the three rankings and the lower quartile of GPA and LSAT results for some top colleges (I got the data from here, and added the Cooley rankings by hand)

You were wondering perhaps about the two colored dots?

The orange dot is University of Texas, Prof. Leiter’s employer.  His ranking for his own school is between the other two rankings.  The red dot is Thomas J. Cooley law school.  The US News rankings don’t  include them in the top 100 (they don’t quantify past the first 100), but their own ranking makes them second in the US, behind only Harvard.


May 4, 2012

US drinking age and road deaths

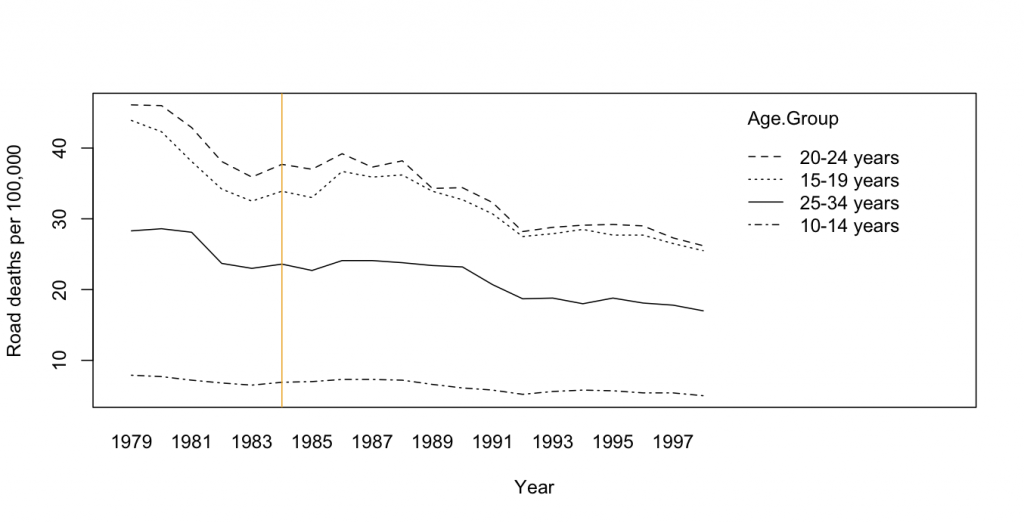
In an earlier post I looked at male youth suicide rates in the US before and after the drinking age was raised in July 1984, and said that expecting a decrease in road deaths made sense.  It does make sense, but it seems that it didn’t happen in the US.  The graph shows road deaths per 100,000 people by age group (from CDC), and there isn’t anything prominent that happens in 1984 or 1985.  The pattern is pretty much the same for ages 15-19, 20-24, and 25-34.  The younger two groups would have been affected by the law (with its supporters usually arguing that the youngest of the groups is the real target) and the oldest group would not have been affected.    You can think of all sorts of explanations for why a difference might not have been seen (for example, the US is bad at detecting and deterring drunk drivers), but the data has to be disappointing to people who want a change in the drinking age.


It’s interesting that there hasn’t been any real discussion in the NZ media of what happened when the US raised the drinking age.