Posts filed under Experiments (32)

April 17, 2016

Evil within?

The headlineSex and violence ‘normal’ for boys who kill women in video games: study. That’s a pretty strong statement, and the claim quotes imply we’re going to find out who made it. We don’t.

The (much-weaker) take-home message:

The researchers’ conclusion: Sexist games may shrink boys’ empathy for female victims.

The detail:

The researchers then showed each student a photo of a bruised girl who, they said, had been beaten by a boy. They asked: On a scale of one to seven, how much sympathy do you have for her?

The male students who had just played Grand Theft Auto – and also related to the protagonist – felt least bad for her. with an empathy mean score of 3. Those who had played the other games, however, exhibited more compassion. And female students who played the same rounds of Grand Theft Auto had a mean empathy score of 5.3.

The important part is between the dashes: male students who related more to the protagonist in Grand Theft Auto had less empathy for a female victim.  There’s no evidence given that this was a result of playing Grand Theft Auto, since the researchers (obviously) didn’t ask about how people who didn’t play that game related to its protagonist.

What I wanted to know was how the empathy scores compared by which game the students played, separately by gender. The research paper didn’t report the analysis I wanted, but thanks to the wonders of Open Science, their data are available.

If you just compare which game the students were assigned to (and their gender), here are the means; the intervals are set up so there’s a statistically significant difference between two groups when their intervals don’t overlap.

gtamean

The difference between different games is too small to pick out reliably at this sample size, but is less than half a point on the scale — and while the ‘violent/sexist’ games might reduce empathy, there’s just as much evidence (ie, not very much) that the ‘violent’ ones increase it.

Here’s the complete data, because means can be misleading

gtaswarm

The data are consistent with a small overall impact of the game, or no real impact. They’re consistent with a moderately large impact on a subset of susceptible men, but equally consistent with some men just being horrible people.

If this is an issue you’ve considered in the past, this study shouldn’t be enough to alter your views much, and if it isn’t an issue you’ve considered in the past, it wouldn’t be the place to start.

February 13, 2016

Just one more…

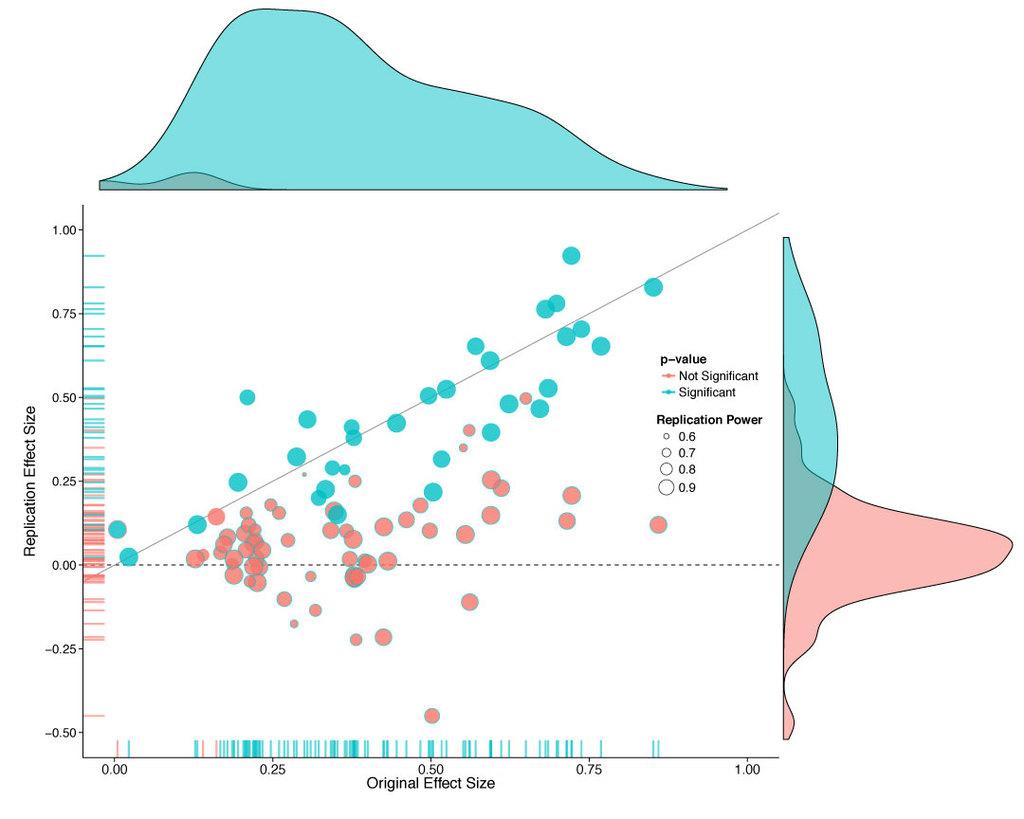
NPR’s Planet Money ran an interesting podcast in mid-January of this year. I recommend you take the time to listen to it.

The show discussed the idea that there are problems in the way that we do science — in this case that our continual reliance on hypothesis testing (or statistical significance) is leading to many scientifically spurious results. As a Bayesian, that comes as no surprise. One section of the show, however, piqued my pedagogical curiosity:

STEVE LINDSAY: OK. Let’s start now. We test 20 people and say, well, it’s not quite significant, but it’s looking promising. Let’s test another 12 people. And the notion was, of course, you’re just moving towards truth. You test more people. You’re moving towards truth. But in fact – and I just didn’t really understand this properly – if you do that, you increase the likelihood that you will get a, quote, “significant effect” by chance alone.

KESTENBAUM: There are lots of ways you can trick yourself like this, just subtle ways you change the rules in the middle of an experiment.

You can think about situations like this in terms of coin tossing. If we conduct a single experiment where there are only two possible outcomes, let us say “success” and “failure”, and if there is genuinely nothing affecting the outcomes, then any “success” we observe will be due to random chance alone. If we have a hypothetical fair coin — I say hypothetical because physical processes can make coin tossing anything but fair — we say the probability of a head coming up on a coin toss is equal to the probability of a tail coming up and therefore must be 1/2 = 0.5. The podcast describes the following experiment:

KESTENBAUM: In one experiment, he says, people were told to stare at this computer screen, and they were told that an image was going to appear on either the right site or the left side. And they were asked to guess which side. Like, look into the future. Which side do you think the image is going to appear on?

If we do not believe in the ability of people to predict the future, then we think the experimental subjects should have an equal chance of getting the right answer or the wrong answer.

The binomial distribution allows us to answer questions about multiple trials. For example, “If I toss the coin 10 times, then what is the probability I get heads more than seven times?”, or, “If the subject does the prognostication experiment described 50 times (and has no prognostic ability), what is the chance she gets the right answer more than 30 times?”

When we teach students about the binomial distribution we tell them that the number of trials (coin tosses) must be fixed before the experiment is conducted, otherwise the theory does not apply. However, if you take the example from Steve Lindsay, “..I did 20 experiments, how about I add 12 more,” then it can be hard to see what is wrong in doing so. I think the counterintuitive nature of this relates to general misunderstanding of conditional probability. When we encounter a problem like this, our response is “Well I can’t see the difference between 10 out of 20, versus 16 out of 32.” What we are missing here is that the results of the first 20 experiments are already known. That is, there is no longer any probability attached to the outcomes of these experiments. What we need to calculate is the probability of a certain number of successes, say x given that we have already observed y successes.

Let us take the numbers given by Professor Lindsay of 20 experiments followed a further 12. Further to this we are going to describe “almost significant” in 20 experiments as 12, 13, or 14 successes, and “significant” as 23 or more successes out of 32. I have chosen these numbers because (if we believe in hypothesis testing) we would observe 15 or more “heads” out of 20 tosses of a fair coin fewer than 21 times in 1,000 (on average). That is, observing 15 or more heads in 20 coin tosses is fairly unlikely if the coin is fair. Similarly, we would observe 23 or more heads out of 32 coin tosses about 10 times in 1,000 (on average).

So if we have 12 successes in the first 20 experiments, we need another 11 or 12 successes in the second set of experiments to reach or exceed our threshold of 23. This is fairly unlikely. If successes happen by random chance alone, then we will get 11 or 12 with probability 0.0032 (about 3 times in 1,000). If we have 13 successes in the first 20 experiments, then we need 10 or more successes in our second set to reach or exceed our threshold. This will happen by random chance alone with probability 0.019 (about 19 times in 1,000). Although it is an additively huge difference, 0.01 vs 0.019, the probability of exceeding our threshold has almost doubled. And it gets worse. If we had 14 successes, then the probability “jumps” to 0.073 — over seven times higher. It is tempting to think that this occurs because the second set of trials is smaller than the first. However, the phenomenon exists then as well.

The issue exists because the probability distribution for all of the results of experiments considered together is not the same as the probability distribution for results of the second set of experiments given we know the results of the first set of experiment. You might think about this as being like a horse race where you are allowed to make your bet after the horses have reached the half way mark — you already have some information (which might be totally spurious) but most people will bet differently, using the information they have, than they would at the start of the race.

January 25, 2016

Meet Statistics summer scholar Eva Brammen

photo_brammen
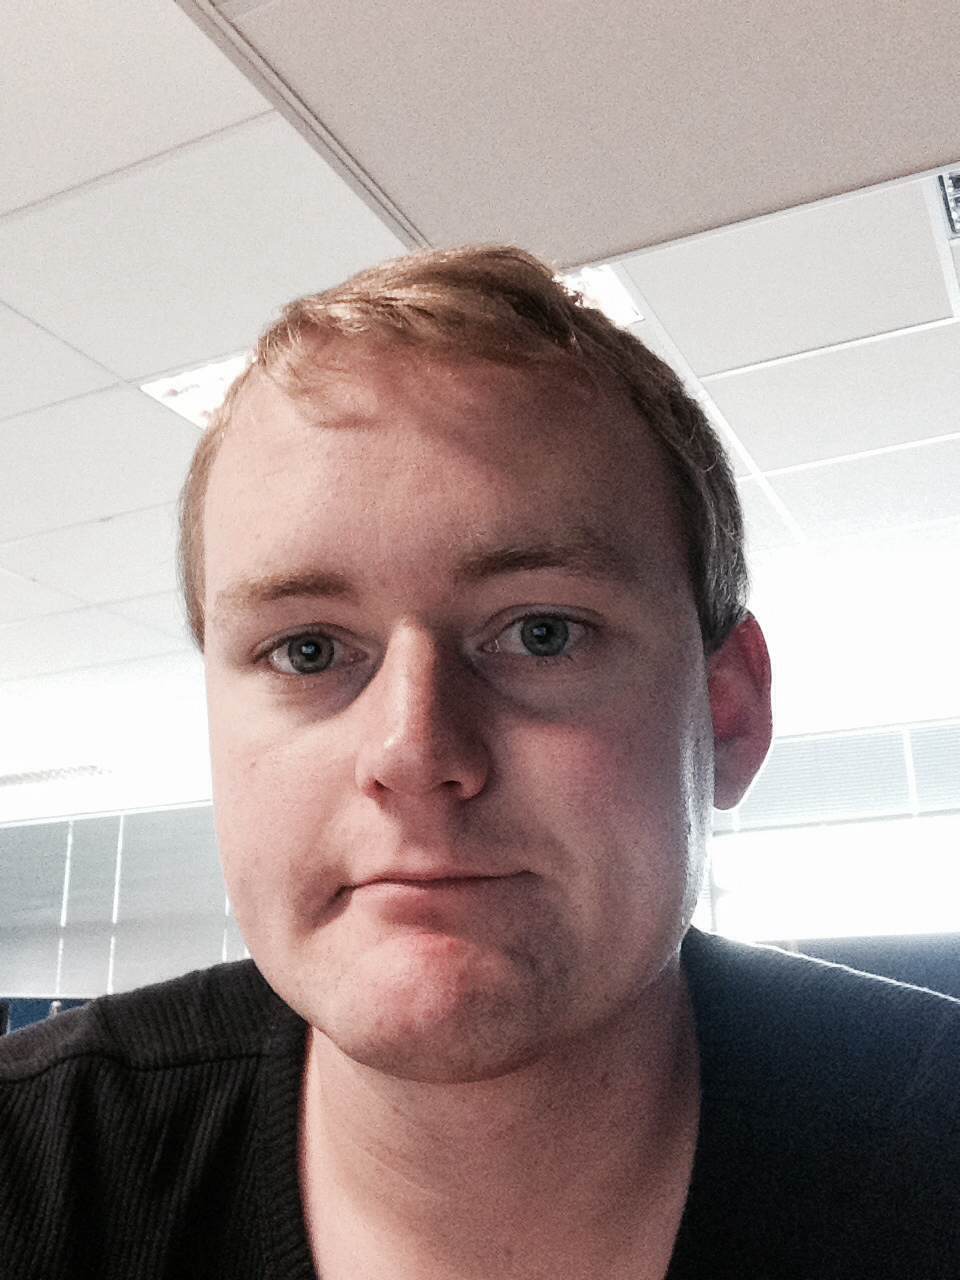
Every summer, the Department of Statistics offers scholarships to a number of students so they can work with staff on real-world projects. Eva, right, is working on a sociolinguistic study with Dr Steffen Klaere. Eva, right,  explains:

“How often do you recognise the dialect of a neighbour and start classifying them into a certain category? Sociolinguistics studies patterns and structures in spoken language to identify some of the traits that enable us to do this kind of classification.

“Linguists have known for a long time that this involves recognising relevant signals in speech, and using those signals to differentiate some speakers and group others. Specific theories of language predict that some signals will cluster together, but there are remarkably few studies that seriously explore the patterns that might emerge across a number of signals.

“The study I am working on was carried out on Bequia Island in the Eastern Caribbean. The residents of three villages, Mount Pleasant, Paget Farm and Hamilton, say that they can identify which village people come from by their spoken language. The aim of this study was to detect signals in speech that tied the speaker to a location.

“One major result from this project was that the data are sometimes insufficient to answer the researchers’ questions satisfactorily. So we are tapping into the theory of experimental design to develop sampling protocols for sociolinguistic studies that permit researchers to answer their questions satisfactorily.

“I am 22 and come from Xanten in Germany. I studied Biomathematics at the Ernst-Moritz-Arndt-University in Greifswald, and have just finished my bachelor degree.

“What I like most about statistics is its connection with mathematical theory and its application to many different areas. You can work with people who aren’t necessarily statisticians.

“This is my first time in New Zealand, so with my time off I am looking forward to travelling around the country. During my holidays I will explore Northland and the Bay of Islands. After I have finished my project, I want to travel from Auckland to the far south and back again.”

January 18, 2016

The buck needs to stop somewhere

From Vox:

Academic press offices are known to overhype their own research. But the University of Maryland recently took this to appalling new heights — trumpeting an incredibly shoddy study on chocolate milk and concussions that happened to benefit a corporate partner.

Press offices get targeted when this sort of thing happens because they are a necessary link in the chain of hype.  On the other hand, unlike journalists and researchers, their job description doesn’t involve being skeptical about research.

For those who haven’t kept up with the story: the research is looking at chocolate milk produced by a sponsor of the study, compared to other sports drinks. The press release is based on preliminary unpublished data. The drink is fat-free, but contains as much sugar as Coca-Cola. And the press release also says

“There is nothing more important than protecting our student-athletes,” said Clayton Wilcox, superintendent of Washington County Public Schools. “Now that we understand the findings of this study, we are determined to provide Fifth Quarter Fresh to all of our athletes.”

which seems to have got ahead of the evidence rather.

This is exactly the sort of story that’s very unlikely to be the press office’s fault. Either the researchers or someone in management at the university must have decided to put out a press release on preliminary data and to push the product to the local school district. Presumably it was the same people who decided to do a press release on preliminary data from an earlier study in May — data that are still unpublished.

In this example the journalists have done fairly well: Google News shows that coverage of the chocolate milk brand is almost entirely negative.  More generally, though, there’s the problem that academics aren’t always responsible for how their research is spun, and as a result they always have an excuse.

A step in the right direction would be to have all research press releases explicitly endorsed by someone. If that person is a responsible member of the research team, you know who to blame. If it’s just a publicist, well, that tells you something too.

August 28, 2015

Trying again

CNbxnQDWgAAXlKL

This graph is from the Open Science Framework attempt to replicate 100 interesting results in experimental psychology, led by Brian Nozek and published in Science today.

About a third of the experiments got statistically significant results in the same direction as the originals.  Averaging all the experiments together,  the effect size was only half that seen originally, but the graph suggests another way to look at it.  It seems that about half the replications got basically the same result as the original, up to random variation, and about half the replications found nothing.

Ed Yong has a very good article about the project in The Atlantic. He says it’s worse than psychologists expected (but at least now they know).  It’s actually better than I would have expected — I would have guessed that the replicated effects would average quite a bit smaller than the originals.

The same thing is going to be true for a lot of small-scale experiments in other fields.

August 17, 2015

How would you even study that?

From XKCD

every_seven_seconds

“How would you even study that?” is an excellent question to ask when you see a surprising statistic in the media. Often the answer is “they didn’t,” but sometimes you get to find out about some really clever research technique.

January 30, 2015

Meet Statistics summer scholar Ying Zhang

Ying Zhang Photo

Every year, the Department of Statistics offers summer scholarships to a number of students so they can work with staff on real-world projects. Ying, right, is working on a project called Service overview, client profile and outcome evaluation for Lifeline Aotearoa Face-to-Face Counselling Services  with the Department of Statistics’ Associate Professor David Scott and Christine Dong, research and clinical engagement manager, Lifeline and also an Honorary Research Fellow in the Department of Psychological Medicine at the University of Auckland. Ying explains:

“Lifeline New Zealand is a leading provider of dedicated community helpline services, face-to-face counselling and suicide prevention education. The project aims to investigate the client profile, the clinical effectiveness of the service and client experiences of, and satisfaction with, the face-to-face counselling service.

“In this project, my work includes three aspects: Data entry of client profiles and counselling outcomes; qualitative analysis of open-ended questions and descriptive analysis; and modelling for the quantitative variables using SAS.

“Very few research studies have been done in New Zealand to explore client profiles or find out clients’ experiences of, and satisfaction with, community face-to-face counselling services. Therefore, the study will add evidence in terms of both clinical effectiveness and client satisfaction. This study will also provide a systematic summary of the demographics and clinical characteristics of people accessing such services. It will help provide direction for strategies to improve the quality and efficiency of the service.

“I have just graduated from the University of Auckland with a Postgraduate Diploma in Statistics.  I got my bachelor and master degrees majoring in information management and information systems at Zhejiang University in China.

“My first contact with statistics was around 10 years ago when I was at university in China. It was an interesting but complex subject for me. After that, I did some internship work relating to data analysis. It helped me accumulate more experience about using data analysis to help inform business decisions.

“This summer, apart from participating in the project, I will spend some time expanding my knowledge of SAS – it’s a very useful tool and I want to know it better. I’m also hoping to find a full-time job in data analysis.”


January 21, 2015

Meet Statistics summer scholar Alexander van der Voorn

Alex van der VoornEvery year, the Department of Statistics offers summer scholarships to a number of students so they can work with staff on real-world projects. Alexander, right, is undertaking a statistics education research project with Dr Marie Fitch and Dr Stephanie Budgett. Alexander explains:

“Essentially, what this project involves is looking at how bootstrapping and re-randomisation being added into the university’s introductory statistics course have affected students’ understanding of statistical inference, such as interpreting P-values and confidence intervals, and knowing what can and can’t be justifiably claimed based on those statistical results.

“This mainly consists of classifying test and exam questions into several key categories from before and after bootstrapping and re-randomisation were added to the course, and looking at the change (if any) in the number of students who correctly answer these questions over time, and even if any common misconceptions become more or less prominent in students’ answers as well.

“This sort of project is useful as traditionally, introductory statistics education has had a large focus on the normal distribution and using it to develop ideas and understanding of statistical inference from it. This results in a theoretical and mathematical approach, which means students will often be restricted by the complexity of it and will therefore struggle to be able to use it to make clear inference about the data.

“Bootstrapping and re-randomisation are two techniques that can be used in statistical analysis and were added into the introductory statistics course at the university in 2012. They have been around for some time, but have only become prominent and practically useful recently as they require many repetitions of simulations, which obviously is better-suited to a computer rather than a person. Research on this emphasises how using these techniques allow key statistical ideas to be taught and understood without a lot of fuss, such as complicated assumptions and dealing with probability distributions.

“In 2015, I’ll be completing my third year of a BSc in Statistics and Operations Research, and I’ll be looking at doing postgraduate study after that. I’m not sure why statistics appeals to me, I just found it very interesting and enjoyable at university and wanted to do more of it. I always liked maths at school, so it probably stemmed from that.

“I don’t have any plans to go away anywhere so this summer I’ll just relax, enjoy some time off in the sun and spend time around home. I might also focus on some drumming practice, as well as playing with my two dogs.”

August 2, 2014

When in doubt, randomise

The Cochrane Collaboration, the massive global conspiracy to summarise and make available the results of clinical trials, has developed ‘Plain Language Summaries‘ to make the results easier to understand (they hope).

There’s nothing terribly noticeable about a plain-language initiative; they happen all the time.  What is unusual is that the Cochrane Collaboration tested the plain-language summaries in a randomised comparison to the old format. The abstract of their research paper (not, alas, itself a plain-language summary) says

With the new PLS, more participants understood the benefits and harms and quality of evidence (53% vs. 18%, P < 0.001); more answered each of the five questions correctly (P ≤ 0.001 for four questions); and they answered more questions correctly, median 3 (interquartile range [IQR]: 1–4) vs. 1 (IQR: 0–1), P < 0.001). Better understanding was independent of education level. More participants found information in the new PLS reliable, easy to find, easy to understand, and presented in a way that helped make decisions. Overall, participants preferred the new PLS.

That is, it worked. More importantly, they know it worked.

July 24, 2014

Weak evidence but a good story

An example from Stuff, this time

Sah and her colleagues found that this internal clock also affects our ability to behave ethically at different times of day. To make a long research paper short, when we’re tired we tend to fudge things and cut corners.

Sah measured this by finding out the chronotypes of 140 people via a standard self-assessment questionnaire, and then asking them to complete a task in which they rolled dice to win raffle tickets – higher rolls, more tickets.

Participants were randomly assigned to either early morning or late evening sessions. Crucially, the participants self-reported their dice rolls.

You’d expect the dice rolls to average out to around 3.5. So the extent to which a group’s average exceeds this number is a measure of their collective result-fudging.

“Morning people tended to report higher die-roll numbers in the evening than the morning, but evening people tended to report higher numbers in the morning than the evening,” Sah and her co-authors wrote.

The research paper is here.  The Washington Post, where the story was taken from, has a graph of the results, and they match the story. Note that this is one of the very few cases where starting a bar chart at zero is a bad idea. It’s hard to roll zero on a standard die.

larks-owls-wapost


The research paper also has a graph of the results, which makes the effect look bigger, but in this case is defensible as 3.5 really is “zero” for the purposes of the effect they are studying

lark-owl


Unfortunately,neither graph has any indication of uncertainty. The evidence of an effect is not negligible, but it is fairly weak (p-value of 0.04 from 142 people). It’s easy to imagine someone might do an experiment like this and not publish it if they didn’t see the effect they expected, and it’s pretty certain that you wouldn’t be reading about the results if they didn’t see the effect they expected, so it makes sense to be a bit skeptical.

The story goes on to say

These findings have pretty big implications for the workplace. For one, they suggest that the one-size-fits-all 9-to-5 schedule is practically an invitation to ethical lapses.

Even assuming that the effect is real and that lying about a die roll in a psychological experiment translates into unethical behaviour in real life, the findings don’t say much about the ‘9-to-5’ schedule. For a start, none of the testing was conducted between 9am and 5pm.