Posts filed under Probability (66)

September 17, 2013

Two drunk statisticians leave a bar ….

The below is posted on behalf of Mark Holmes from the Department of Statistics at The University of Auckland. Colleague James Curran read this piece on Wired Science  and challenged him to respond to the following:

Suppose that two drunk statisticians leave a bar (located in the middle of an infinite forest) together.  They stumble around at random and get lost.  Will they ever find each other again?

Mark, helpfully, rose to the bait (thanks, Mark!)  This is what he says:

Assuming 1) that the drunks will live (and stumble around drunk) forever, and that 2) the forest is two dimensional (i.e. there is infinite space to move in both N-S and E-W directions, and the drunks can’t climb infinitely high trees!)  then the answer is yes, they will meet each other again.

Perhaps the best way to explain this is to consider the difference between their locations.  If after n steps the first statistician is at position X_n and the second at position Y_n, then let’s look at D_n=X_n-Y_n.  The two drunks will meet at any time n when X_n=Y_n, which is the same as D_n=(0,0) (the position at time n has two coordinates since we are in two dimensions).

It turns out that D_n itself is essentially a simple random walk, and that the two drunks not only meet again, but they meet infinitely often, because D_n returns to (0,0) infinitely often.  The posh way of saying this is that “simple symmetric random walk in two dimensions is recurrent”.  It is perhaps not surprising that if instead of stumbling around an infinite forest they stumble along an infinite footpath (one dimensional), they will also meet each other infinitely often (“simple symmetric random walk in one dimension is recurrent”).  Note that if the bar is located instead in an infinitely high, wide and long mall they might never meet again (“simple symmetric random walk in three dimensions is not recurrent”).

If the above was good news for the drunks, there is some bad news.  Although they will meet each other again in finite time, the  “average” time it takes them to meet again is infinite.  This is true both in the forest and on the footpath.

If you are interested in the relevant calculations, ask a graduate student in probability (they should also be easy to find on the internet).  If you are satisfied that you understand that, try to solve the following:

 “A physicist, a probabilist and a statistician walk out of a bar…..”

Suppose that we have three independent random walkers instead of two.  The above discussion says that each PAIR of walkers will meet each other infinitely often (in two dimensions).  Will all three meet each other simultaneously?


… so, dear readers, let us have it!  Don’t be shy.
 

September 13, 2013

How dangerous are weddings?

According to the Herald, the ACC wants us to be careful about weddings — about getting injured at them, that is.

Weddings are supposed to be the happiest day of your life – try telling that to the hundreds of people who make ACC claims for injuries at ceremonies.

From tripping on the bride’s dress to swallowing the ring, nuptials can be surprisingly hazardous.

New figures show at least 600 people made claims to the ACC between 2010 and 2012.

So, how does the 600 claims over three years compare to what you’d expect from an average day?

The ACC accepted 1.7 million new claims last year, which gives about 0.4 claims per person per year, or about 0.001 per person per day.

There were about 20 000 marriages in New Zealand last year, so about 60 000 over 2010-2012, giving about 0.01 ACC claims per marriage.  The 600 reported claims would then be about what you’d expect if there were 10 person-days of exposure per marriage.

My experience is that wedding celebrations typically involve more than ten people, and, with setup and rehearsals, often more than one day.  It looks as though weddings, like Christmas, are actually safer than ordinary days.

August 23, 2013

Political polling

Two episodes to be noted

First, the GCSB bill.

We’ve had a nomination for Stat of the Week for the Campbell Live bogus poll finding 89% opposition to the bill: you just can’t draw that sort of conclusion from self-selected phone-in polls.  On the other hand, they did get over 50000 identified individuals voting, so as a petition it isn’t completely negligible — that’s a bit more than 1.5% of voters.

The Fairfax/Ipsos real poll found a bare majority who trusted the government to protect privacy and only about 30% who were seriously opposed to the bill.  The pollster or the papers fell down badly by not giving us a party breakdown of these figures.  If half the 30% were National voters, the government should have been concerned, but if, like me, they were mostly Labour/Greens voters already, there isn’t any political problem in ignoring them. It’s also a pity there wasn’t any polling relevant to the most obvious pressure point in the coalition – “Would you vote for ACT if they voted against the bill?” would have been an interesting and important thing to know.

Second, the West Island.

As you may have heard, they are having an election soon. In addition to the traditional election polls there are new automated ‘robopolls’ that are sufficiently cheaper that it’s possible to get a useful sample size in single electorates. Or perhaps not. The Sydney Morning Herald has an interesting report

Lonergan’s own national poll reports only a 2 per cent swing against Labor. Yet in the three seats it polled individually, it found an average swing of 10 per cent. That’s huge, far bigger than we have seen in any Federal election since 1943.


August 17, 2013

False positives

From a number of fields

So when one particular paper began to strain the servers, attracting hundreds if not thousands of downloads, the entire editorial board began to pay attention. “What,” they asked, “is so special about this paper on the ryanodine receptor of Caenorhabditis elegans?” (For those of you who don’t know, Caenorhabditis elegans is a very common and much-loved model animal—it’s a small, soil-living roundworm with some very useful features. Please don’t ask me what a ryanodine receptor is; I don’t know and I don’t really care.)

  • Along similar lines, someone reminded me of the problem the UK town of Scunthorpe has with text filtering.  There is an old joke that there are two other football teams whose names contain swear words (punchline)
August 16, 2013

Collateral damage

There’s a long tradition in law and ethics of thinking about how much harm to the innocent should be permitted in judicial procedures, and at what cost. The decision involves both uncertainty, since any judicial process will make mistakes, and consideration of what the tradeoffs would be in the absence of uncertainty. An old example of the latter is the story of Abraham bargaining with God over how many righteous people there would have to be in the notorious city of Sodom to save it from destruction, from a starting point of 50 down to a final offer of 10.

With the proposed new child protection laws, though, the arguments have mostly been about the uncertainty.  The bills have not been released yet, but Paula Bennett says they will provide for protection orders keeping people away from children, to be imposed by judges not only on those convicted of child abuse but also ‘on the balance of probabilities’ for some people suspected of being a serious risk.

We’ve had two stat-of-the-week nominations for a blog post about this topic (arguably not ‘in the NZ media’, but we’ll leave that for the competition moderator). The question at issue is how many innocent people would end up under child protection orders if 80 orders were imposed each year.

The ‘balance of probabilities’ standard theoretically says that an order can be imposed (?must be imposed) if the probability of being a serious risk is more than 50%.  The probability could be much higher than 50% — for example, if you were asked to decide on the balance of probabilities which of your friends are male, you will usually also be certain beyond reasonable doubt for most of them.  On the other hand, there wouldn’t be any point to the legislation unless it is applied mostly to people for whom the evidence isn’t good enough even to attempt prosecution under current law, so the typical probabilities shouldn’t be that high.

Even if we knew the distribution of probabilities, we still don’t have enough information to know how many innocent people will be subject to orders. The probability threshold here is the personal partly-subjective uncertainty of the judge, so even if we had an exact probability we’d only know how many innocent people the judge thought would be affected, and there’s no guarantee that judges have well-calibrated subjective probabilities on this topic.

In fact, the judicial system usually rules out statistical prior information about how likely different broad groups of people are to be guilty, so the judge may well be using a probability distribution that is deliberately mis-calibrated.  In particular, the judicial system is (for very good but non-statistical reasons) very resistant to using as evidence the fact that someone has been charged, even though people who have been charged are statistically much more likely to be guilty than random members of the population.

At one extreme, if the police were always right when they suspected people, everyone who turned up in court with any significant evidence against them would be guilty.  Even if the evidence was only up to the balance of probabilities standard, it would then turn out that no innocent people would be subject to the orders. That’s the impression that Ms Bennett seems to be trying to give — that it’s just the rules of evidence, not any real doubt about guilt.  At the other extreme, if the police were just hauling in random people off the street, nearly everyone who looked guilty on the balance of probabilities might actually just be a victim of coincidence and circumstance.

So, there really isn’t an a priori mathematical answer to the question of how many innocent people will be affected, and there isn’t going to be a good way to estimate it afterwards either. It will be somewhere between 0% and 100% of the orders that are imposed, and reasonable people with different beliefs about the police and the courts can have different expectations.

August 2, 2013

A tax on hope?

An excellent long piece about lotteries, from the online magazine Nautilus.  There are many viewpoints presented, including one from the president of the Tennessee lottery corporation

Hargrove has an intuitive understanding of what drives her customers to play the game. She has a preternatural sense of where their psychological buttons are located and how to push them. She responded in a flash to my comment about the logical futility of playing the lottery. “If you made a logical investment choice, you’d play a different game,” she said, leaning forward for emphasis. “It’s not an investment. It’s entertainment. For a very small amount of money you might change your life. For $2 you can spend the day dreaming about what you would do with half a billion dollars—half a billion dollars!”

When  both payoffs and odds that are beyond any conceptual understanding you could do a simple expected-value calculation and label government lotteries as a tax on stupidity, but that framing assumes lottery players are calculating the expected payoff and just getting it wrong. Empirically, it seems to be more complicated than that.

July 16, 2013

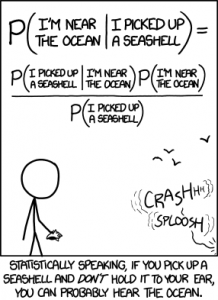
If you hold a seashell to your ear

From XKCD and Bayes’ Theorem

seashell


July 12, 2013

Is this a record?

In what may be the least accurate risk estimate ever published in a major newspaper, the Daily Mail said last week

  • Hormone replacement could cause meningioma in menopausal women
  • Those using HRT for a decade have a 70% chance of developing a tumour
  • Most are benign but 15% are malignant and all have damaging side effects

You don’t actually need to look up any statistics to know this is wrong, just ask yourself how many women you know who had brain surgery. Hormone replacement therapy was pretty common (until it was shown not to prevent heart disease), so if 70% of women who used it for a decade ended up with meningioma, you’d know, at a minimum, several women who had brain surgery for cancer.  Do you?

In fact, according to the British NHS, the lifetime risk of meningioma is about 0.07%. Since it’s more common in women, that might be as much as 0.1% lifetime risk for women. The research quoted by the Mail actually found a relative risk of 1.7, so the lifetime risk might be up to 0.17% in women who take a decade of hormone replacement therapy. That is, the story overestimates the risk by 69.8 percentage points, or a factor of more than 400.

While this may be a record so far, there’s still room for improvement, and I certainly wouldn’t bet on the record standing for ever.

(via @hildabast and @BoraZ on Twitter, and Paul Raeburn of the MIT science journalism program)

July 7, 2013

Who is on the (UK) front pages

From the inimitable Dan Davies, a post on how often you’d expect all the front-page photos in major UK newspapers to be of white people

So a while ago on Twitter, I saw this storify by @KateDaddie, talking about ethnic minority representation in the British media, in the context of this article by Joseph Harker in the British Journalism Review. As I am a notorious stats pedant and practically compulsive mansplainer, my initial reaction was to fire up the Pedantoscope and start nitpicking. On the face of it, it is not difficult to think up Devastating Critiques[1] of the idea of counting “#AllWhiteFrontPages” as an indicator of more or less anything. But if I’ve learned one thing from a working life dealing with numbers (and from reading all those Nassim Taleb and Anthony Stafford Beer books), it’s that the central limit theorem will not be denied, and that simple, robust metrics with a broad-brush correlation to the thing you’re trying to measure are usually better management tools than fragile customised metrics which look like they might in principle be better.

May 9, 2013

Counting signatures

A comment on the previous post about the asset-sales petition asked how the counting was done: the press release says

Upon receiving the petition the Office of the Clerk undertook a counting and sampling process. Once the signatures had been counted, a sample of signatures was taken using a methodology provided by the Government Statistician.

It’s a good question and I’d already thought of writing about it, so the commenter is getting a temporary reprieve from banishment for not providing a full name.  I don’t know for certain, and the details don’t seem to have been published, which is a pity — they would be interesting and educationally useful, and there doesn’t seem to be any need for confidentiality.

While I can’t be certain, I think it’s very likely that the Government Statistician provided the estimation methodology from Statistics New Zealand Working Paper No 10-04, which reviews and extends earlier research on petition counting.

There are several issues that need to be considered

  • removing signatures that don’t come with the required information
  • estimating the number of eligible vs ineligible signatures
  • estimating the number of duplicates
  • estimating the margin of error in the estimate
  • deciding what level of uncertainty is acceptable

The signatures without the required information are removed completely; that’s not based on sampling.  Estimating eligible vs ineligible signatures is fairly easy by checking a sufficiently-large random sample — in fact, they use a systematic sample, taking names at regular intervals through the petition list, which tends to give more precise results and to be more auditable.  

Estimating unique signatures is  tricky, because if you halve your sample size, you expect to see 1/4 as many duplicates, 1/8 as many triplicates, and so on. The key part of the working paper shows how to scale up the the sample data on eligible, ineligible, and duplicate, triplicate, etc, signatures to get the unique unbiased estimator of the number of valid signatures and its variance.

Once the level of uncertainty is specified, the formulas tell you what sample size to verify and what to do with the results.  I don’t know how the sample size is chosen, but it wouldn’t take a very large sample to get the uncertainty down to a few thousand, which would be good enough.   In fact, since the methodology is public and the parties have access to the electoral roll in electronic form, it’s a bit surprising that the petition organisers didn’t run a quick check themselves before submitting it.