Posts filed under Research (206)

July 28, 2015

Recreational genotyping: potentially creepy?

Two stories from this morning’s Twitter (via @kristinhenry)

  • 23andMe has made available a programming interface (API) so that you can access and integrate your genetic information using apps written by other people.  Someone wrote and published code that could be used to screen users based on sex and ancestry. (Buzzfeed, FastCompany). It’s not a real threat, since apps with more than 20 users need to be reviewed by 23andMe, and since users have to agree to let the code use their data, and since Facebook knows far more about you than 23andMe, but it’s not a good look.
  • Google’s Calico project also does cheap public genotyping and is combining their DNA data (more than a million people) with family trees from Ancestry.com. This is how genetic research used to be done: since we know how DNA is inherited, connecting people with family trees deep into the past provides a lot of extra information. On the other hand, it means that if a few distantly-related people sign up for Calico genotying, Google will learn a lot about the genomes of all their relatives.

It’s too early to tell whether the people who worry about this sort of thing will end up looking prophetic or just paranoid.

July 23, 2015

Diversity is (very slightly) good for you

This isn’t in the local news, but there are stories about it in the world media: a new paper in Nature on associations between genetic diversity and various desirable characteristics.  I’m one of the authors — and so is pretty much everyone else, since this research combines analyses from over 100 cohort studies.  The Nature paper is actually the second publication in this area that I’ve worked on.  My first Auckland MSc student in Statistics, Anish Scaria, did some analysis for a different definition of genetic diversity, and that plus data from a smaller group of cohort studies was published last year.

What did we do? Humans, like most animals and many plants1, have two copies of our complete genome2. We looked at how similar these two copies were, essentially measuring small amounts of inbreeding from distant ancestors.

Each cohort study had measured a large number of binary genetic variants, ranging from 300,000 to 1,000,000. In the first paper we looked at just the proportion of variants where the two copies were the same3. In the new paper we looked at contiguous chunks of genome where all the variants were the same in the two copies, which gives a more sensitive indication of the chunks of genome being inherited from the same distant ancestor. We compared people based on the proportion of genome that was in these contiguous chunks.

The comparisons were done separately within each cohort and the associations were then averaged: obviously you would get different genetic diversity in a cohort from Iceland versus a cohort of African-Americans, and we need to make sure that sort of difference didn’t get incorporated in the analysis. Similarly, for cohorts that recruited people of different ancestries, the comparisons were done between people of the same basic ancestry and averaged.

Our first paper found that people with more difference between their two genomic copies lived (very slightly) longer on average; the new paper found that (to a very small extent) they were taller, had higher average scores on IQ tests, and had lower cholesterol. The basic direction of the results wasn’t surprising, but the lack of association for specific diseases and risk factors was — there was no sign of a difference in diabetes, for example.

Scientifically, the data provide a little bit of extra support for height and whatever IQ tests measure having been under evolutionary selection, and a bit of negative evidence on diabetes and heart disease having been under evolutionary selection in human history. And also a bit of support for the idea that you can actually get more than a hundred groups of independent and fiercely territorial academics to work together sometimes.


1. Some important crop plants, such as wheat, cabbage, and sugarcane, are insanely more complicated
2. Yes, I’m ignoring the sex chromosomes here.
3. “Homozygous” is the technical term.

June 11, 2015

Comparing all the treatments

This story didn’t get into the local media, but I’m writing about it because it illustrates the benefit of new statistical methods, something that’s often not visible to outsiders.

From a University of Otago press release about the work of A/Prof Suetonia Palmer

The University of Otago, Christchurch researcher together with a global team used innovative statistical analysis to compare hundreds of research studies on the effectiveness of blood-pressure-lowering drugs for patients with kidney disease and diabetes. The result: a one-stop-shop, evidence-based guide on which drugs are safe and effective.

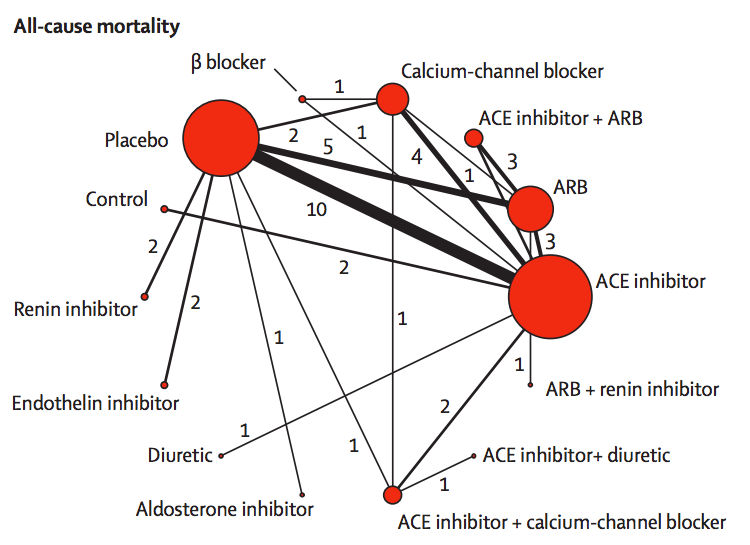
They link to the research paper, which has interesting looking graphics like this:
netmeta

The red circles represent blood-pressuring lowering treatments that have been tested in patients with kidney disease and diabetes, with the lines indicating which comparisons have been done in randomised trials. The circle size shows how many trials have used a drug; the line width shows how many trials have compared a given pair of drugs.

If you want to compare, say, endothelin inhibitors with ACE inhibitors, there aren’t any direct trials. However, there are two trials comparing endothelin inhibitors to placebo, and ten trials comparing placebo to ACE inhibitors. If we estimate the advantage of endothelin inhibitors over placebo and subtract off the advantage of ACE inhibitors over placebo we will get an estimate of the advantage of endothelin inhibitors over ACE inhibitors.

More generally, if you want to compare any two treatments A and B, you look at all the paths in the network between A and B, add up differences along the path to get an estimate of the difference between A and B, then take a suitable weighted average of the estimates along different paths. This statistical technique is called ‘network meta-analysis’.

Two important technical questions remain: what is a suitable weighted average, and how can you tell if these different estimates are consistent with each other? The first question is relatively straightforward (though quite technical). The second question was initially the hard one.  It could be for example, that the trials involving placebo had very different participants from the others, or that old trials had very different participants from recent trials, and their conclusions just could not be usefully combined.

The basic insight for examining consistency is that the same follow-the-path approach could be used to compare a treatment to itself. If you compare placebo to ACE inhibitors, ACE inhibitors to ARB, and ARB to placebo, there’s a path (a loop) that gives an estimate of how much better placebo is than placebo. We know the true difference is zero; we can see how large the estimated difference is.

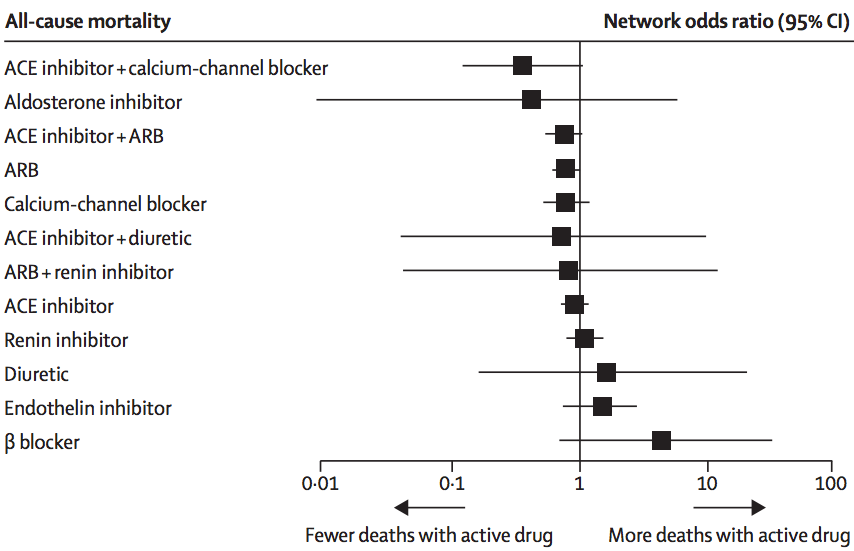
In this analysis, there wasn’t much evidence of inconsistency, and the researchers combined all the trials to get results like this:
netmeta-ci

The ‘forest plot’ shows how each treatment compares to placebo (vertical line) in terms of preventing death. We can’t be absolutely sure than any of them are better, but it definitely looks as though ACE inhibitors plus calcium-channel blockers or ARBs, and ARBs alone, are better. It could be that aldosterone inhibitors are much better, but also could be that they are worse. This sort of summary is useful as an input to clinical decisions, and also in deciding what research should be prioritised in the future.

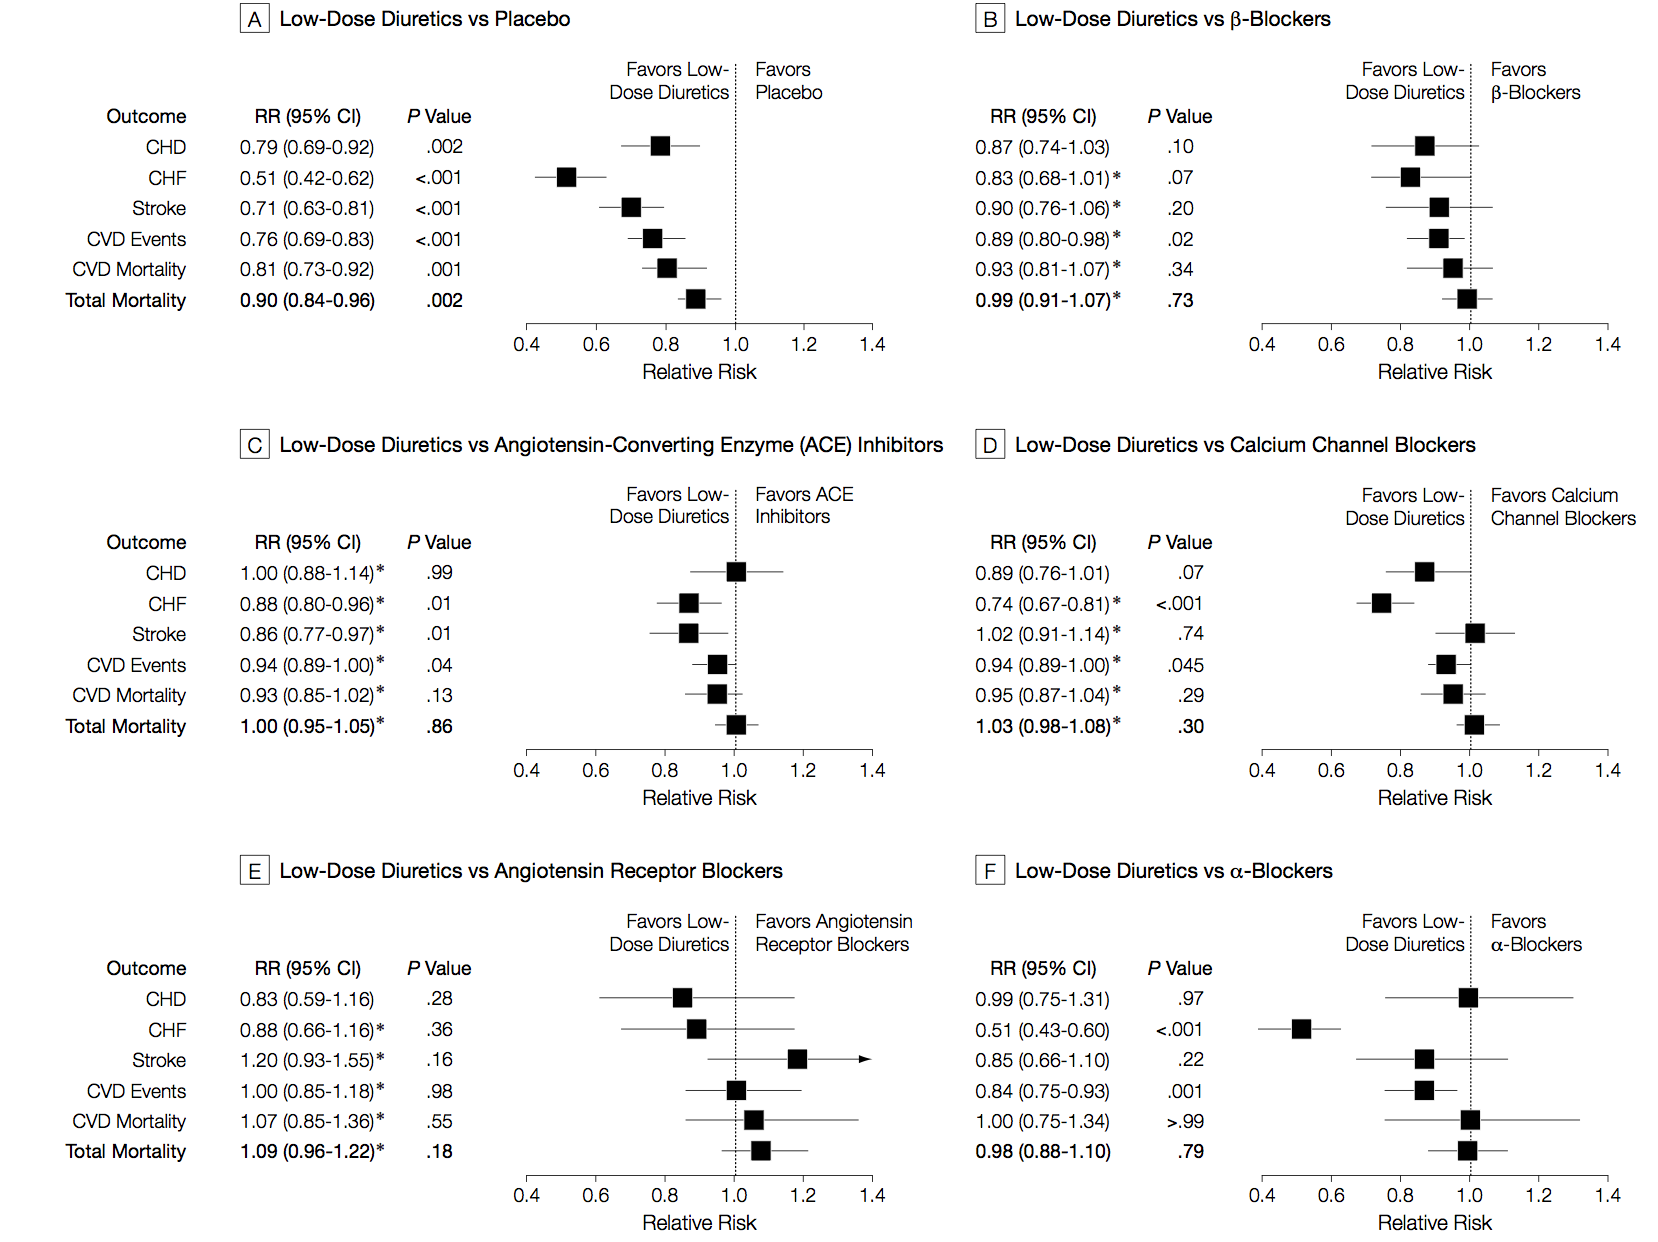
I said the analysis illustrated progress in statistical methods. Network meta-analysis isn’t completely new, and its first use was also in studying blood pressure drugs, but in healthy people rather than people with kidney disease. Here are those results
netmeta-me

There are different patterns for which drug is best across the different events being studied (heart attack, stroke, death), and the overall patterns are different from those in kidney disease/diabetes. The basic analysis is similar; the improvements since this 2003 paper are more systematic and flexible ways of examining inconsistency, and new displays of the network of treatments.

‘Innovative statistical techniques’ are important, but the key to getting good results here is a mind-boggling amount of actual work. As Dr Palmer put it in a blog interview

Our techniques are still very labour intensive. A new medical question we’re working on involves 20-30 people on an international team, scanning 5000-6000 individual reports of medical trials, finding all the relevant papers, and entering data for about 100-600 reports by hand. We need to build an international partnership to make these kind of studies easier, cheaper, more efficient, and more relevant.

At this point, I should confess the self-promotion aspect of the post.  I invented the term “network meta-analysis” and the idea of using loops in the network to assess inconsistency.  Since then, there have been developments in statistical theory, especially by Guobing Lu and A E Ades in Bristol, who had already been working on other aspects of multiple-treatment analysis. There have also been improvements in usability and standardisation, thanks to Georgia Salanti and others in the Cochrane Collaboration ‘Comparing Multiple Interventions Methods Group’.  In fact, network meta-analysis has grown up and left home to the extent that the original papers often don’t get referenced. And I’m fine with that. It’s how progress works.


June 8, 2015

Meddling kids confirm mānuka honey isn’t panacea

The Sunday Star-Times has a story about a small, short-term, unpublished randomised trial of mānuka honey for preventing minor illness. There are two reasons this is potentially worth writing about: it was done by primary school kids, and it appears to be the largest controlled trial in humans for prevention of illness.

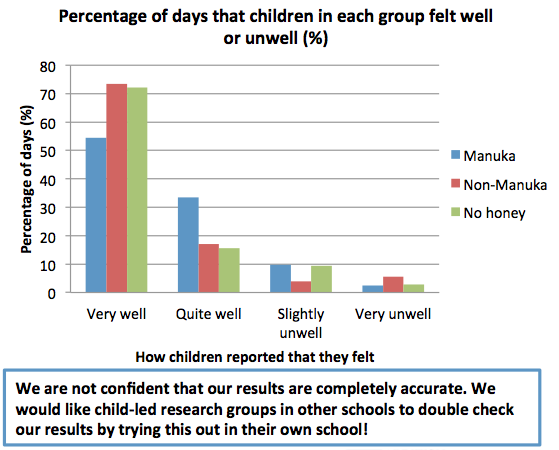
Here are the results (which I found from the Twitter account of the school’s lab, run by Carole Kenrick, who is  named in the story)CGuGbSiWoAACzbe

The kids didn’t find any benefit of mānuka honey over either ordinary honey or no honey. Realistically, that just means they managed to design and carry out the study well enough to avoid major biases. The reason there aren’t any controlled prevention trials in humans is that there’s no plausible mechanism for mānuka honey to help with anything except wound healing. To its credit, the SST story quotes a mānuka producer saying exactly this:

But Bray advises consumers to “follow the science”.

“The only science that’s viable for mānuka honey is for topical applications – yet it’s all sold and promoted for ingestion.”

You might, at a stretch, say mānuka honey could affect bacteria in the gut, but that’s actually been tested, and any effects are pretty small. Even in wound healing, it’s quite likely that any benefit is due to the honey content rather than the magic of mānuka — and the trials don’t typically have a normal-honey control.

As a primary-school science project, this is very well done. The most obvious procedural weakness is that mānuka honey’s distinctive flavour might well break their attempts to blind the treatment groups. It’s also a bit small, but we need to look more closely to see how that matters.

When you don’t find a difference between groups, it’s crucial to have some idea of what effect sizes have been ruled out.  We don’t have the data, but measuring off the graphs and multiplying by 10 weeks and 10 kids per group, the number of person-days of unwellness looks to be in the high 80s. If the reported unwellness is similar for different kids, so that the 700 days for each treatment behave like 700 independent observations, a 95% confidence interval would be 0±2%.  At the other extreme, if 0ne kid had 70 days unwell, a second kid had 19, and the other eight had none, the confidence interval would be 0±4.5%.

In other words, the study data are still consistent with manūka honey preventing about one day a month of feeling “slightly or very unwell”, in a population of Islington primary-school science nerds. At three 5g servings per day that would be about 500g honey for each extra day of slightly improved health, at a cost of $70-$100, so the study basically rules out manūka honey being cost-effective for preventing minor unwellness in this population. The study is too small to look at benefits or risks for moderate to serious illness, which remain as plausible as they were before. That is, not very.

Fortunately for the mānuka honey export industry, their primary market isn’t people who care about empirical evidence.

May 25, 2015

Genetic determinism: infidelity edition

New York Times columnist Richard Friedman is writing about hormones, genetics, and infidelity.  This paragraph is about recently-published research by Brendan Zietsch and colleagues (the NYT tries to link, but the URL is wrong)

His study, published last year in Evolution and Human Behavior, found a significant association between five different variants of the vasopressin gene and infidelity in women only and no relationship between the oxytocin genes and sexual behavior for either sex. That was impressive: Forty percent of the variation in promiscuous behavior in women could be attributed to genes.

If you didn’t read carefully you might think this was a claim that the  vasopressin gene association explained the “Forty percent” and that the percentage was lower in men. In fact, the vasopressin gene associations are rather weaker than that, and the variation attributed by the researchers to genes is 62% in men.

But it gets worse. The correlation with genetics was only seen in identical twins. That is, pairs of identical twins had fairly similar cheating behaviour , but there was no similarity at all between pairs of non-identical twins (of any gender combination) or between non-twin siblings.  If that’s not due to chance (which it could be), it’s very surprising. It doesn’t rule out a genetic explanation — but it means the genetics would have to be weird.  You’d need either a variant that had opposite effects with one versus two copies, or a lot of variants that only had effects with two copies and no effect with one, or an effect that switched on only when you had variant copies of multiple genes, or an effect driven by new mutations not inherited from parents.  The results for the vasopressin gene don’t have this kind of weird.

The story is all “yes, it’s surprising that you’d get this sort of effect in a complex social behaviour, but genetics! And voles!”. I’ll give him the voles, but if anything, the strong correlation between identical twins (only) argues against vasopressin gene variants being a major driver in humans, and the research paper is much more cautious on this point.


May 21, 2015

Fake data in important political-science experiment

Last year, a research paper came out in Science demonstrating an astonishingly successful strategy for gaining support for marriage equality: a short, face-to-face personal conversation with a gay person affected by the issue. As the abstract of the paper said

Can a single conversation change minds on divisive social issues, such as same-sex marriage? A randomized placebo-controlled trial assessed whether gay (n = 22) or straight (n = 19) messengers were effective at encouraging voters (n = 972) to support same-sex marriage and whether attitude change persisted and spread to others in voters’ social networks. The results, measured by an unrelated panel survey, show that both gay and straight canvassers produced large effects initially, but only gay canvassers’ effects persisted in 3-week, 6-week, and 9-month follow-ups. We also find strong evidence of within-household transmission of opinion change, but only in the wake of conversations with gay canvassers. Contact with gay canvassers further caused substantial change in the ratings of gay men and lesbians more generally. These large, persistent, and contagious effects were confirmed by a follow-up experiment. Contact with minorities coupled with discussion of issues pertinent to them is capable of producing a cascade of opinion change.

Today, the research paper is going away again. It looks as though the study wasn’t actually done. The conversations were done: the radio program “This American Life” gave a moving report on them. The survey of the effect, apparently not so much. The firm who were supposed to have done the survey deny it, the organisations supposed to have funded it deny it, the raw data were ‘accidentally deleted’.

This was all brought to light by a group of graduate students who wanted to do a similar experiment themselves. When they looked at the reported data, it looked strange in a lot of ways (PDF). It was of better quality than you’d expect: good response rates, very similar measurements across two cities,  extremely good before-after consistency in the control group. Further investigation showed before-after changes fitting astonishingly well to a Normal distribution, even for an attitude measurement that started off with a huge spike at exactly 50 out of 100. They contacted the senior author on the paper, an eminent and respectable political scientist. He agreed it looked strange, and on further investigation asked for the paper to be retracted. The other author, Michael LaCour, is still denying any fraud and says he plans to present a comprehensive response.

Fake data that matters outside the world of scholarship is more familiar in medicine. A faked clinical trial by Werner Bezwoda led many women to be subjected to ineffective, extremely-high-dose chemotherapy. Scott Reuben invented all the best supporting data for a new approach to pain management; a review paper in the aftermath was titled “Perioperative analgesia: what do we still know?”  Michael LaCour’s contribution, as Kieran Healy describes, is that his approach to reducing prejudice has been used in the Ireland marriage equality campaign. Their referendum is on Friday.

May 17, 2015

Polling is hard

Part One: Affiliation and pragmatics

The US firm Public Policy Polling released a survey of (likely) US Republican primary voters last week.  This firm has a habit of including the occasional question that some people would consider ‘interesting context’ and others would call ‘trolling the respondents.’

This time it was a reference to the conspiracy theory about the Jade Helm military exercises in Texas: “Do you think that the Government is trying to take over Texas or not?”

32% of respondents said “Yes”. 28% said “Not sure”. Less than half were confident there wasn’t an attempt to take over Texas. There doesn’t seem to be widespread actual belief in the annexation theory, in the sense that no-one is doing anything to prepare for or prevent it. We can be pretty sure that most of the 60% were not telling the truth. Their answer was an expression of affiliation rather than an accurate reflection of their beliefs. That sort of thing can be problem for polling.

Part Two: Mode effects and social pressure

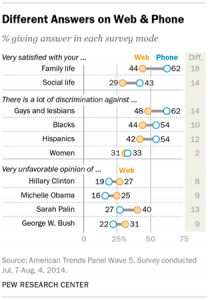
The American Association for Public Opinion Research is having their annual conference, so there’s new and exciting survey research coming out (to the extent that ‘new and exciting survey research’ isn’t an oxymoron). The Pew Research Center took two random groups of 1500 people from one of their panels and asked one group questions over the phone and the other group the same questions on a web form.  For most questions the two groups agreed pretty well: not much more difference than you’d expect from random sampling variability. For some questions, the differences were big:

mode-study-01

It’s not possible to tell from these data which set of answers is more accurate, but the belief in the field is that people give more honest answers to computers than to other people.

May 6, 2015

All-Blacks birth month

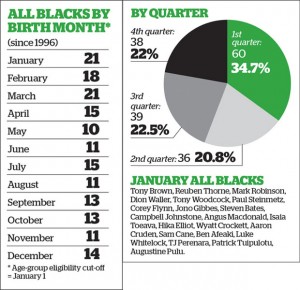
This graphic and the accompanying story in the Herald produced a certain amount of skeptical discussion on Twitter today.

AB2

It looks a bit as though there is an effect of birth month, and the Herald backs this up with citations to Malcolm Gladwell on ice hockey.

The first question is whether there is any real evidence of a pattern. There is, though it’s not overwhelming. If you did this for random sets of 173 people, about 1 in 80 times there would be 60 or more in the same quarter (and yes, I did use actual birth frequencies rather than just treating all quarters as equal). The story also looks at the Black Caps, where evidence is a lot weaker because the numbers are smaller.

On the other hand, we are comparing to a pre-existing hypothesis here. If you asked whether the data were a better fit to equal distribution over quarters or to Gladwell’s ice-hockey statistic of a majority in the first quarter, they are a much better fit to equal distribution over quarters.

The next step is to go slightly further than Gladwell, who is not (to put it mildly) a primary source. The fact that he says there is a study showing X is good evidence that there is a study showing X, but it isn’t terribly good evidence that X is true. His books are written to communicate an idea, not to provide balanced reporting or scientific reference.  The hockey analysis he quotes was the first study of the topic, not the last word.

It turns out that even for ice-hockey things are more complicated

Using publically available data of hockey players from 2000–2009, we find that the relative age effect, as described by Nolan and Howell (2010) and Gladwell (2008), is moderate for the average Canadian National Hockey League player and reverses when examining the most elite professional players (i.e. All-Star and Olympic Team rosters).

So, if you expect the ice-hockey phenomenon to show up in New Zealand, the ‘most elite professional players’, the All Blacks might be the wrong place to look.

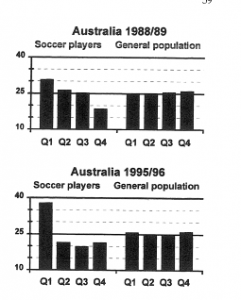
On the other hand Rugby League in the UK does show very strong relative age effects even into the national teams — more like the 50% in first quarter that Gladwell quotes for ice hockey. Further evidence that things are more complicated comes from soccer. A paper (PDF) looking at junior and professional soccer found imbalances in date of birth, again getting weaker at higher levels. They also had an interesting natural experiment when the eligibility date changed in Australia, from January 1 to August 1.

soccer

As the graph shows, the change in eligibility date was followed by a change in birth-date distribution, but not how you might expect. An August 1 cutoff saw a stronger first-quarter peak than the January 1 cutoff.

Overall, it really does seem to be true that relative age effects have an impact on junior sports participation, and possibly even high-level professional acheivement. You still might not expect the ‘majority born in the first quarter’ effect to translate from the NHL as a whole to the All Blacks, and the data suggest it doesn’t.

Rather more important, however, are relative age effects in education. After all, there’s a roughly 99.9% chance that your child isn’t going to be an All Black, but education is pretty much inevitable. There’s similar evidence that the school-age cutoff has an effect on educational attainment, which is weaker than the sports effects, but impacts a lot more people. In Britain, where the school cutoff is September 1:

Analysis shows that approximately 6% fewer August-born children reached the expected level of attainment in the 3 core subjects at GCSE (English, mathematics and science) relative to September-born children (August born girls 55%; boys 44%; September born girls 61% boys 50%)

In New Zealand, with a March 1 cutoff, you’d expect worse average school performance for kids born on the dates the Herald story is recommending.

As with future All Blacks, the real issue here isn’t when to conceive. The real issue is that the system isn’t working as well for some people. The All Blacks (or more likely the Blues) might play better if they weren’t missing key players born in the wrong month. The education system, at least in the UK, would work better if it taught all children as well as it teaches those born in autumn.  One of these matters.


April 13, 2015

Puppy prostate perception

The Herald tells us “Dogs have a 98 per cent reliability rate in sniffing out prostate cancer, according to newly-published research.” Usually, what’s misleading about this sort of conclusion is the base-rate problem: if a disease is rare, 98% accuracy isn’t good enough. Prostate cancer is different.

Blood tests for prostate cancer are controversial because prostate tumours are common in older men, but only some tumours progress to cause actual illness.  By “controversial” I don’t mean the journalistic euphemism for “there are a few extremists who aren’t convinced”, but actually controversial.  Groups of genuine experts, trying to do the best for patients, can come to very different conclusions on when testing is beneficial.

The real challenge in prostate cancer screening is to distinguish the tumours you don’t want to detect from the ones you really, really do want to detect. The real question for the canine sniffer test is how well it does on this classification.

Since the story doesn’t give the researchers’s names finding the actual research takes more effort than usual. When you track the paper down it turns out that the dogs managed almost perfect discrimination between men with prostate tumours and everyone else. They detected tumours that were advanced and being treated, low-risk tumours that had been picked up by blood tests, and even minor tumours found incidentally in treatment for prostate enlargement. Detection didn’t depend on tumour size, on stage of disease, on PSA levels, or basically anything. As the researchers observed “The independence of tumor volume and aggressiveness, and the dog detection rate is surprising.”

Surprising, but also disappointing. Assuming the detection rate is real — and they do seem to have taken precautions against the obvious biases — the performance of the dogs is extremely impressive. However, the 98% accuracy in distinguishing people with and without prostate tumours unavoidably translates into a much lower accuracy in distinguishing tumours you want to detect from those you don’t want to detect.

March 25, 2015

Translating from Scientist to English

Stories were coming out recently about new cancer research led by Bryony Telford in Parry Guilford’s lab at Otago, and I’d thought I’d use it for an example of translation from Scientist to English. It’s a good example for news because it really is pretty impressive, because it involved a New Zealand family with familial cancer, and because the abstract of the research paper is well written — it’s just not written in ordinary English. Combining the abstract with the press release and a bit of Google makes a translation possible.

This will be long. (more…)