June 8, 2014
Briefly
- A Lotto story in the Herald that isn’t untrue or importantly misleading. Yay!
- The Art of Risk: videos from Leeds University
- “Incidentalomas“: the problem with new medical screening technologies
Alyssa Frazee, a PhD student in biostatistics at Johns Hopkins, has an interesting post looking at gender of programmers using the Github code repository. Github users have a profile, which includes a first name, and there programs that attempt to classify first names by gender.
This graph (click to embiggen, as usual) shows the guessed gender distribution for software with at least five ‘stars’ (likes, sort of) across programming languages. Orange is male, green is female, grey is “don’t know”
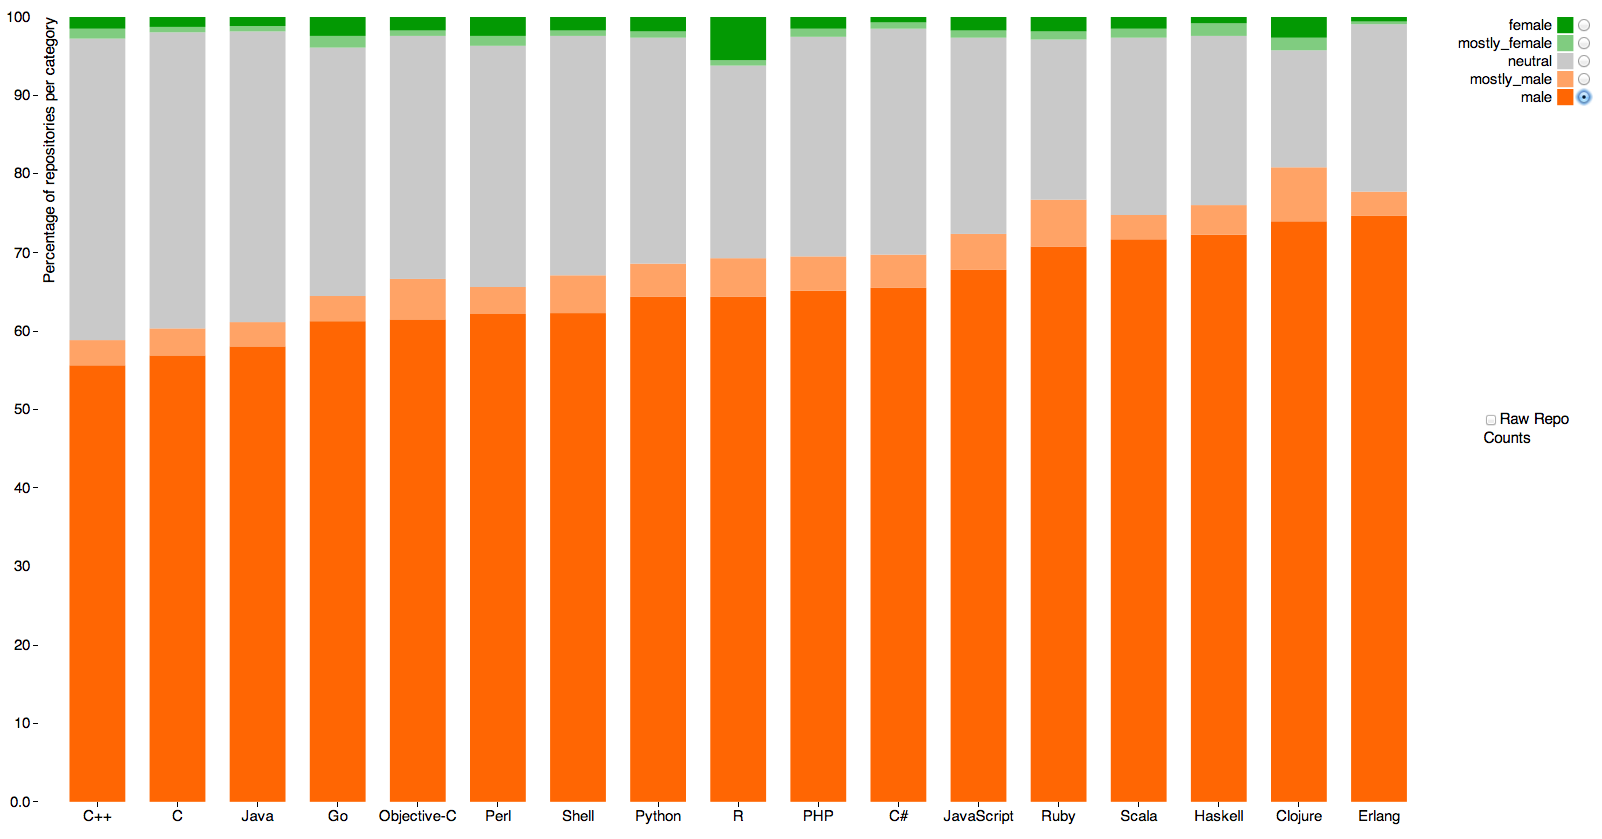
The main message is obvious. Women either aren’t putting code on Github or are using non-gender-revealing or male-associated names.
The other point is that the language with the most female coders seems to be R, the statistical programming language originally developed in Auckland, which has 5.5%. Sadly, 3.9% of that is code by the very prolific Hadley Wickham (also originally developed in Auckland), who isn’t female. Measurement error, as I’ve written before, has a much bigger impact on rare categories than common ones.
The basic method is described on my Department home page. I have made some changes to the methodology this year, including shrinking the ratings between seasons.
Here are the team ratings prior to this week’s games, along with the ratings at the start of the season.
| Current Rating | Rating at Season Start | Difference | |
|---|---|---|---|
| Roosters | 8.18 | 12.35 | -4.20 |
| Rabbitohs | 6.54 | 5.82 | 0.70 |
| Cowboys | 5.41 | 6.01 | -0.60 |
| Bulldogs | 5.12 | 2.46 | 2.70 |
| Sea Eagles | 3.52 | 9.10 | -5.60 |
| Broncos | 3.51 | -4.69 | 8.20 |
| Warriors | 2.57 | -0.72 | 3.30 |
| Storm | 1.40 | 7.64 | -6.20 |
| Panthers | 1.34 | -2.48 | 3.80 |
| Knights | -2.01 | 5.23 | -7.20 |
| Titans | -2.18 | 1.45 | -3.60 |
| Wests Tigers | -5.17 | -11.26 | 6.10 |
| Raiders | -5.71 | -8.99 | 3.30 |
| Sharks | -6.52 | 2.32 | -8.80 |
| Eels | -7.34 | -18.45 | 11.10 |
| Dragons | -10.46 | -7.57 | -2.90 |
So far there have been 91 matches played, 51 of which were correctly predicted, a success rate of 56%.
Here are the predictions for last week’s games.
| Game | Date | Score | Prediction | Correct | |
|---|---|---|---|---|---|
| 1 | Panthers vs. Eels | May 30 | 38 – 12 | 10.30 | TRUE |
| 2 | Roosters vs. Raiders | May 31 | 26 – 12 | 19.50 | TRUE |
| 3 | Cowboys vs. Storm | May 31 | 22 – 0 | 5.50 | TRUE |
| 4 | Warriors vs. Knights | Jun 01 | 38 – 18 | 6.60 | TRUE |
| 5 | Broncos vs. Sea Eagles | Jun 01 | 36 – 10 | -0.00 | FALSE |
| 6 | Rabbitohs vs. Dragons | Jun 02 | 29 – 10 | 22.20 | TRUE |
Here are the predictions for Round 13. The prediction is my estimated expected points difference with a positive margin being a win to the home team, and a negative margin a win to the away team.
| Game | Date | Winner | Prediction | |
|---|---|---|---|---|
| 1 | Sea Eagles vs. Bulldogs | Jun 06 | Sea Eagles | 2.90 |
| 2 | Eels vs. Cowboys | Jun 06 | Cowboys | -8.30 |
| 3 | Titans vs. Panthers | Jun 07 | Titans | 1.00 |
| 4 | Dragons vs. Sharks | Jun 07 | Dragons | 0.60 |
| 5 | Rabbitohs vs. Warriors | Jun 07 | Rabbitohs | 8.50 |
| 6 | Knights vs. Wests Tigers | Jun 08 | Knights | 7.70 |
| 7 | Storm vs. Roosters | Jun 08 | Roosters | -2.30 |
| 8 | Raiders vs. Broncos | Jun 09 | Broncos | -4.70 |
Thousands of school students are being awarded the wrong NCEA grades, a review of last year’s results has revealed.
Nearly one in four grades given by teachers for internally marked work were deemed incorrect after checking by New Zealand Qualifications Authority moderators.
That’s not actually true, because moderators don’t deem grades to be incorrect. That’s not what moderators are for. What the report says (pp105-107 in case you want to scroll through it) is that in 24% of cases the moderator and the internal assessor disagreed on grade, and in 12% they disagreed on whether the standard had been achieved.
What we don’t know is how much disagreement is appropriate. The only way the moderator’s assessment could be considered error-free is if you define the ‘right answer’ to be ‘whatever the moderator says’, which is obviously not appropriate. There always will be some variation between moderators, and some variation between schools, and what we want to know is whether there is too much.
The report is a bit disappointing from that point of view. At the very least, there should have been some duplicate moderation. That is, some pieces of work should have been sent to two different moderators, so we could have an idea of the between-moderator agreement rate. Then, if we were willing to assume that moderators collectively were infallible (though not individually), we could estimate how much less reliable the internal assessments were.
Even better would be to get some information on how much variation there is between schools in the disagreement: if there is very little variation, the schools may be doing about as well as is possible, but if there is a lot of variation between schools it would suggest some schools aren’t assessing very reliably.
There’s a new paper out in the journal PNAS claiming that hurricanes with female names cause three times as many deaths as those with male names (because people don’t give girl hurricanes the proper respect). Ed Yong does a good job of explaining why this is probably bogus, but no-one seems to have drawn any graphs, which I think make the situation a lot clearer. (more…)
Each week, we would like to invite readers of Stats Chat to submit nominations for our Stat of the Week competition and be in with the chance to win an iTunes voucher.
Here’s how it works:
Next Monday at midday we’ll announce the winner of this week’s Stat of the Week competition, and start a new one.
Even with large amounts of data, automated predictions must usually incorporate explicit or implicit prior understanding of the structure of the problem. “Look for anything” is not good enough: “anything” is too big.
Here, for your weekend light entertainment, are some examples where the prior structure was too strong or too weak:
The example that prompted this post, from the blog of Melville House Press, is about automated scanning of books to create digital editions
in many old texts the scanner is reading the word ‘arms’ as ‘anus’ and replacing it as such in the digital edition. As you can imagine, you don’t want to be getting those two things mixed up.
A similar phenomenon was pointed out at Language Log a decade ago
Fear not your toes, though they are strong,
The conquest doth to you belong;
Daniel Dennett recounts two anecdotes of speech recognition, one human and one computer, which err in the opposite direction to the text recognition example. The computer one:
An AI speech-understanding system whose development was funded by DARPA (Defense Advanced Research Projects Agency), was being given its debut before the Pentagon brass at Carnegie Mellon University some years ago. To show off the capabilities of the system, it had been attached as the “front end” or “user interface” on a chess-playing program. The general was to play white, and it was explained to him that he should simply tell the computer what move he wanted to make. The general stepped up to the mike and cleared his throat–which the computer immediately interpreted as “Pawn to King-4.”
And, the example that is frustratingly familiar to so many of us: mobile phone autocorrupt, which you can search for yourself.
If you find that changing your diet in some way makes you feel happier and healthier, that’s a good thing. It doesn’t matter whether the same change would be useful for most people, or only useful for you. It doesn’t matter whether the change is a placebo effect. It doesn’t even matter if it’s an illusion, a combination of regression to the mean and confirmation bias. You might check with a doctor or dietician as to whether the change is dangerous, but otherwise, go for it.
If you want to campaign for the entire community to make a change in their diet, you need to have evidence that it’s better on average for the entire community. A few people’s subjective experience isn’t good enough. Good quality observational data might be all you can manage if the benefits are subtle or take years to appear, but if you’re claiming dramatic short-term benefits you should be able to demonstrate them in a randomised controlled trial.
The reason for mentioning this is that PETA has been making friends again. They’re trying to link milk consumption to autism. They don’t even pretend to have any evidence that milk causes autism, and the evidence that milk-free diet has a beneficial effect in people with autism is very weak. That is, there are a few studies that suggest a benefit, but the benefit is smaller in studies with more reliable designs, and absent in the best-designed studies. The most recent review of the evidence concluded that dairy-free or gluten-free diets should only be tried for people who have some separate evidence of food intolerance. After reading the review, I would agree.
There are respectable arguments against dairy farming, both ethical and environmental. Scaremongering about autism isn’t one of them.
Columbia University in New York is running an amazing-looking data journalism certificate called The Lede Program. The program director is Cathy O’Neill of mathbabe.org and Occupy Finance, and the program advisor is Mark Hansen, statistician, computational scientist, and artist.
Anyway, their syllabus (and quite a bit of other content) is available on Github.
I’d like to quote a course outline by Cathy O’Neill
This course begins with the idea that computing tools are the products of human ingenuity and effort. They are never neutral and carry with them the biases of their designers and their design process. “Platform studies” is a new term used to describe investigations into these relationships between computing technologies and the creative or research products that they help to generate. How you understand how data, code, and algorithms affect creative practices can be an effective first step toward critical thinking about technology.
Recent comments