Meet Statistics summer scholar Christopher Pearce
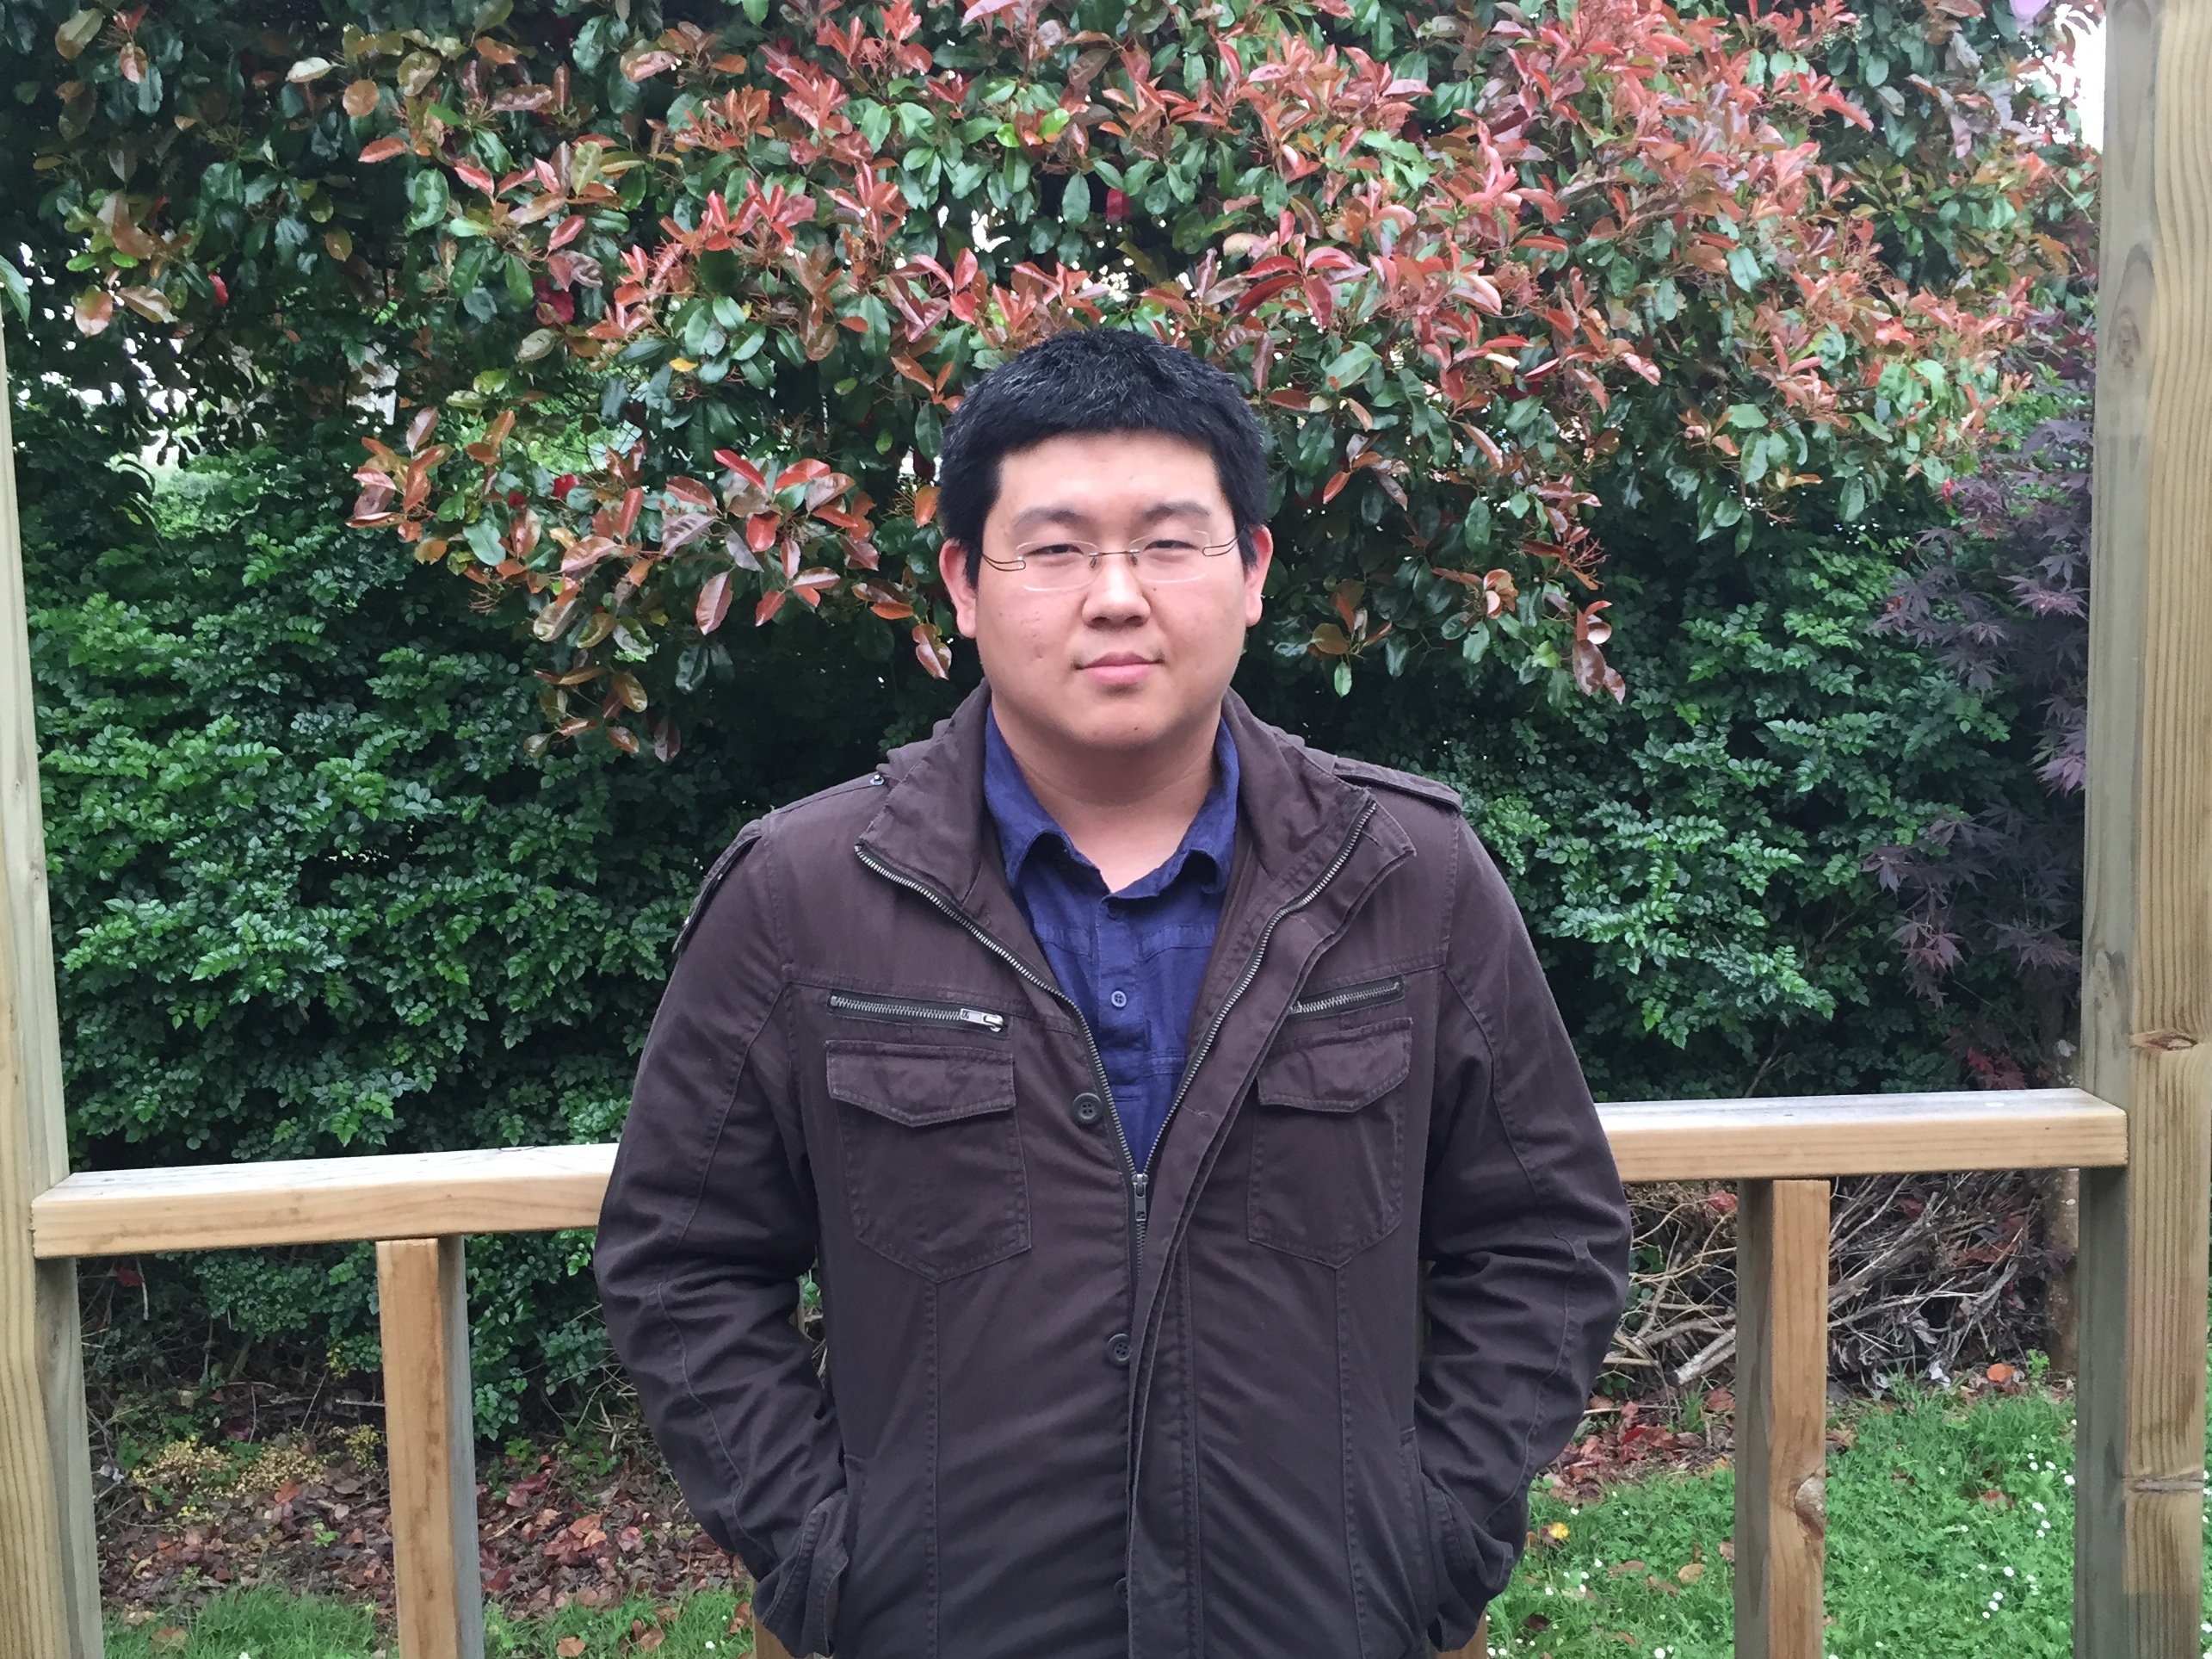
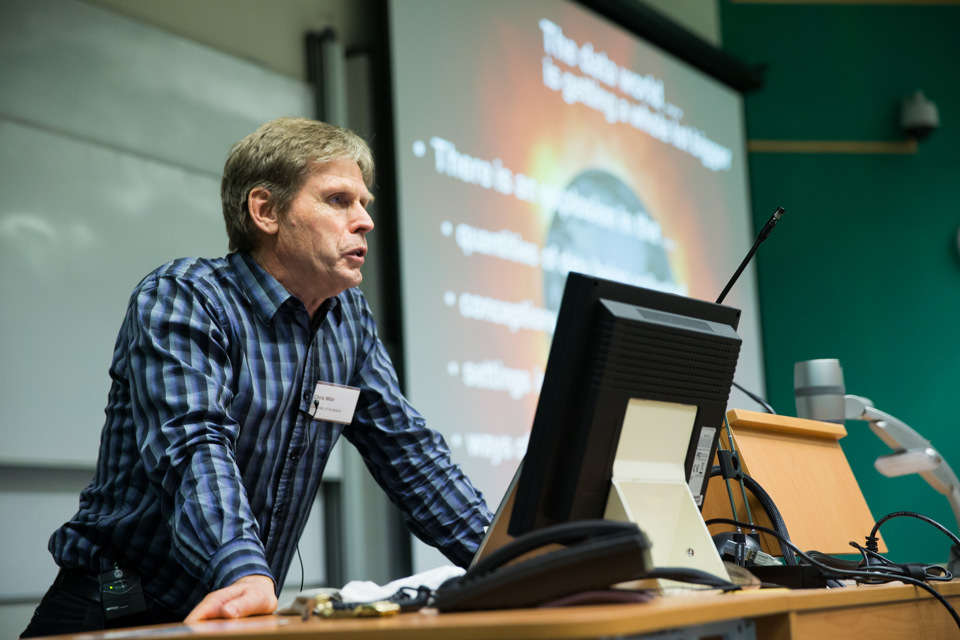
 Every year, the Department of Statistics offers summer scholarships to a number of students so they can work with staff on real-world projects. Christopher, right, is working on the OpenAPI project with Associate Professor Paul Murrell. Chris explains:
“Government data is becoming increasingly available. However, this does not mean it is readable – few individuals possess the knowledge and skills to make use of these data by themselves.
“In an ideal world, the code used by fellow statisticians would be available to everyone. It would be even more ideal if it were transferable. Sites like Wiki New Zealand are doing a remarkable job of displaying some of New Zealand’s trends, but with no source code it can sometimes be impossible to recreate.
“The OpenAPI project is developing a flow-based framework that is primarily aimed at lowering the barriers to use of open data by the general public. My project is about creating an architecture for programmers and statisticians of all levels. Our goal is for anyone interested to have the ability to perform analyses on open government data. The idea is that there are publicly available snippets of code from fellow statisticians that can be easily linked in a meaningful way. The less expertise required by the end user, the better.
“My job is to come up with questions I am interested in answering, then figuring out how a potential lay observer would solve them. So far it has yielded some interesting results.
“I’m a third-year student at the University of Auckland, studying a Bachelor of Laws/Bachelor of Science conjoint. My skills lie in statistics and computer science, but I need the literal side to keep a balanced life.
“I got hooked on statistics when I discovered the Poisson distribution. There’s something about statistics that never seems to get old, and I’m discovering new things every day. It’s nice knowing I can actually attempt an answer to the curiosities in my head.”