Posts filed under Evidence (90)

October 2, 2013

Cough, choke, history

If the PubMed research database is still surviving the US government shutdown, you can read a paper published 63 years ago today on lung cancer

In England and Wales the phenomenal increase in the
number of deaths attributed to cancer of the lung provides
one of the most striking changes in the pattern of

mortality recorded by the Registrar-General. For example,
in the quarter of a century between 1922 and 1947 the
annual number of deaths recorded increased from 612 to
9,287, or roughly fifteenfold. This remarkable increase is,
of course, out of all proportion to the increase of population

Some people were arguing that the increase was just due to better diagnosis of lung cancer, and even  those who believed in a real increase weren’t sure of the reason

Two main causes have from time to time been put forward:
(1) a general atmospheric pollution from the exhaust

fumes of cars, from the surface dust of tarred roads, and
from gas-works, industrial plants, and coal fires; and
(2) the smoking of tobacco.

Richard Doll and Austin Bradford Hill decided to compare histories of smoking in lung cancer patients and those in hospital for other reasons. As you know, they found that the lung cancer patients were much more likely to be heavy smokers. It’s also interesting to read what other possibilities they considered, and how they tried to rule them out.

This sort of study isn’t completely definitive, and, famously, the eminent statistician and geneticist (and heavy smoker) R. A. Fisher was never convinced. He thought that genetic factors might well be responsible. Further evidence was provided by experiments in animals (such the ‘smoking beagles‘ of Duke University) showed that smoking really could cause cancer. Also, much more recently, studies of twins and studies that actually measured genotypes showed that genetic differences weren’t a big enough contributor to lung cancer to explain the correlation.

In contrast to, say, alcohol or opium, tobacco has been a public health problem only for about a century: tobacco smoking became very widespread in men during the first world war. With a bit of effort and some luck, future generations might see it as an inexplicable historical anomaly, like a deadly version of canasta.
September 22, 2013

Briefly

  • Careers: The number of people getting statistics degrees in the US has doubled in the past five years (and they’re still able to get jobs)
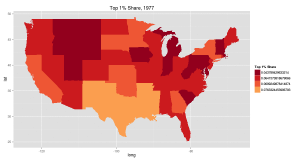
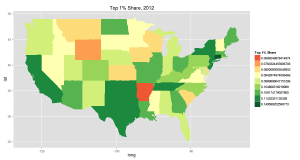
  • Increasing inequality in the US from 1977 to 2012 (it happens in other places too): top 1% share of income.  The colour choice is a bit unfortunate (red: more equal, green:less equal). There are animated pictures and more inequality measures in the original

aqzaxe9-1aqzaxe9

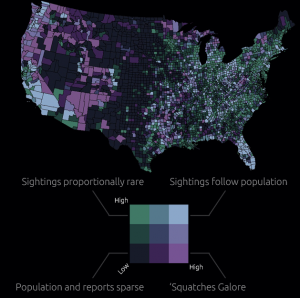
  • Map of sasquatch sightings in the US. The original has all the sightings as well as this map cross-referenced with population density. Remember, just because you can measure it doesn’t mean it exists

sasquatch

  • Software for drawing data-based maps: CartoDB. Has both free and paid versions.  Worth a look if you do maps.
September 8, 2013

Confounding by indication

One of the many quotes attributed to film producer Samuel Goldwyn is

Any man who goes to a psychiatrist ought to have his head examined.

This neatly summarises what epidemiologists call ‘confounding by indication’, that is, the fact that treatments tend to look harmful just because they are only given to sick people.  For example, in a study I worked on in Seattle, elderly people who were taking blood-pressure medication were about 20% more likely to have heart attackes than those not taking blood-pressure medication, although we know from randomised trials that these blood-pressure medications actually reduce heart attacks by about 20%.

The impact can easily be much more dramatic: about 12% of people receiving a heart transplant die within a year, compared to 0.6% of all Kiwis, a 20-fold higher rate, and the HIV deniers have made much of the fact that nearly  all AIDS deaths in Western countries are in people who have received antiretroviral treatment for HIV infection.

In the Herald, Rodney Hide doesn’t seem to appreciate the power of confounding by indication.

The benefit-supported children were six times more likely to be abused than those who were not benefit-supported. And they were 14 times more likely to be known to Youth Justice.

Those in households benefit-dependent for nine or more years were 13 times more likely to be abused and 29 times more likely to be known to Youth Justice.

He concedes that the numbers don’t prove that the benefit support is the cause, and describes some of the factors that might lead to confounding by indication, but says

Nonetheless, the ministry factsheet is suggestive. If the benefit system were a commercial product the Government would demand a warning: Danger: Taking a benefit can endanger your children.

and describes the Ministry’s

“These findings are consistent with associations between low income and measures of child maltreatment found both across and within countries. They do not, however, establish that being supported by the benefit system causes a child to be more at risk of these outcomes.”

as doublespeak.  But in fact, the Ministry is quite right.  Comparing people who need and qualify for benefits to the rest of the country isn’t even suggestive, any more than a comparison of heart transplant recipients or people taking antiretroviral drugs to the rest of us.  And that’s without even considering the ‘PC’ issues such as whether abusing your kids might be harder to hide if you’re on benefit than if you’re rich.

Readers of history or classic literature will recall that poor children didn’t fare all that well before benefits were introducted, and a brief look at the UNICEF web site will confirm that today children can be much worse off in countries where there isn’t a functioning government benefit system.  Is that “suggestive” too?


September 2, 2013

Evidence-based interviewing?

Two links,

Deciding who to interview: Aline Lerner looked at resumes of 300 candidates interviewed at a Silicon Valley company to see what predicted getting the job. The biggest factor wasn’t grades or degree or experience, it was typos  — and this was among people who got an interview.

Did it work? An interview with a Google exec by the New York Times

We looked at tens of thousands of interviews, and everyone who had done the interviews and what they scored the candidate, and how that person ultimately performed in their job. We found zero relationship. It’s a complete random mess, except for one guy who was highly predictive because he only interviewed people for a very specialized area, where he happened to be the world’s leading expert.

August 18, 2013

Correlation, genetics, and causation

There’s an interesting piece on cannabis risks at Project Syndicate. One of the things they look at is the correlation between frequent cannabis use and psychosis.  Many people are, quite rightly, unimpressed with the sort of correlation, since it isn’t hard to come up with explanations for psychosis causing cannabis use or for other factors causing both.

However, there is also some genetic data.  The added risk of psychosis seems to be confined to people with two copies of a particular genetic variant in a gene called AKT1. This is harder to explain as confounding (assuming the genetics has been done right), and is one of the things genetics is useful for. This isn’t just a one-off finding; it was found in one study and replicated in another.

On the other hand, the gene AKT1 doesn’t seem to be very active in brain cells, making it more likely that the finding is just a coincidence.  This is one of the things bioinformatics is good for.

In times like these it’s good to remember Ben Goldacre’s slogan “I think you’ll find it’s a bit more complicated than that.”

July 31, 2013

“10 quadrillion times more likely to have done it”

Thomas Lumley, tipped off by Luis Apiolaza on Twitter, pointed me to this article in the NZ Herald.

The article is yet another example of the Herald’s inability to correctly report DNA statistics. It makes the following statement:
This article reports a quote from the Crown Prosecutor, paraphrased as follows:

A man charged with raping a woman during a kidnap has pleaded not guilty but Crown says DNA evidence shows the man was “10,000,000,000,000,000 times likely” to be responsible for the crime.

To be fair to the article’s author, this may have been the statement that the Crown prosecutor made, but nNo forensic scientist in New Zealand would say this. ESR scientists are trained to give statements of the following type:

“The evidence is 1016 (=10,000,000,000,000,000) times more likely if the defendant and the victim were contributors to the stain, rather than the victim and someone unrelated to the defendant.”

It is extremely important to note that This is a statement about the likelihood of the evidence given the hypotheses rather than the other way around. A forensic scientist is bought to court to comment on the strength of the evidence and specifically not on whether the defendant is guilty.

I have commented on this before., and sent correspondence to the NZ Herald numerous times. Perhaps a mention on StatsChat will inspire change.

Update: The NZ Herald reporter, James Ihaka, has contacted me and said “The statement came from a Crown prosecutor about the evidence that the forensic scientist will present later in the trial. Taking in to consideration what you have said however, it would probably be more accurate to rephrase this.” Good on you James!

Update 2: James Ihaka has contacted me again, with the following information:

This is the direct quote from Crown prosecutor Rebecca Mann: ( I checked with her)
“It is ten thousand million million times more likely for the DNA these samples originated from (the complainant) and Mr Martin rather than from (the complainant) and another unrelated individual selected at random from the general New Zealand population.”

I apologize unreservedly for attributing this to James Ihaka, and again congratulate him for following it up.

The statement Ms. Mann should have given is


The evidence (the DNA match) is ten thousand million million times more likely if these samples originated from (the complainant) and Mr Martin rather than if they originated from (the complainant) and another unrelated individual selected at random from the general New Zealand population.”

July 30, 2013

Always ask for the margin of error

The Herald now has picked up this morning’s UK story from the London Fire Brigade, that calls from people handcuffed or otherwise stuck in embarassing circumstances are on the rise.  The Fire Brigade only said

“I don’t know whether it’s the Fifty Shades effect, but the number of incidents involving items like handcuffs seems to have gone up.

The Herald has the relatively sedate headline “‘Fifty Shades of Grey effect’ plagues London“, but the British papers go further (as usual).   For example, the Mirror’s headline was “Fifty Shades of Grey sex leads to soaring 999 calls“.  This is the sort of story that’s too good to check, so no-one seems to have asked how much evidence there is of an increase.

The actual numbers quoted by the fire brigade for calls to people stuck in what could loosely be called household items were: 416 in 2010/11, 441 in 2011/12, and 453in 2012/13. If you get out your Poisson distribution and do some computations, it turns out this is well within the expected random variation — for example the p-value for a test of trend is 0.22 (or for the Bayesians, the likelihood ratio is also very unimpressive). Much more shades of grey than black and white.

So, if you don’t have hot and cold running statisticians at your newspaper, how can you check this sort of thing?  There’s a simple trick for the margin of error for a count of things on a hand calculator: take the square root, add and subtract 1 to get upper and lower  limits, then square them again.  Conveniently, in this case, 441 is exactly 21 squared, so an uncertainty interval around the 441 value would go from 20 squared (400) to 22 squared (484).


July 22, 2013

Recycling

The Herald has a story headlined “The high cost of shoplifting in NZ“, which is very similar to the story in Stuff in May that we commented on back then.

We get the figure for total theft from the Retailers Association again, with a similar lack of detail as to what it measures and how, but now without even the estimate of what proportion of it is shoplifting vs theft by staff that was provided in May.  Again there is a set of high-profile or high-value examples given, but now two of the five are from other countries.

The other change is that we now are told that prosecutions for shoplifting have fallen by 20-25% over the past four years, but there is no information on how this relates to the Retailers Association estimate — do they think theft has gone down, and if not, why not?

July 9, 2013

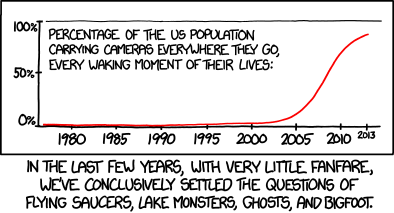
Sometimes absence of evidence is evidence of absence

From XKCD

July 8, 2013

Lost productivity: pick a number, any number

From Wonkblog at the Washington Post, a look at all the things that allegedly cost the US $BIGNUM in productivity, eg

– The fact that so many employees aren’t engaged with their jobs costs U.S. employers a staggering $550 billion per year.

– Parents stressed out about child care cost $300 billion per year in lost productivity.

– Cigarette smoking takes $92 billion per year out of the workplace.

– Then throw in insomnia, which costs another $63 billion per year.

– Let’s not forget excessive commuting, which costs employers $90 billion per year.

Adding up all of the losses gives $1.8 trillion per year. That’s about 12% of US GDP or about 2/3 of US federal government tax receipts.