Posts filed under Just look it up (285)

February 14, 2013

Petty drug users fill NZ homes?

Michelle Gosse points us to a discussion of minor drug crime on Stuff.  The headline “Petty drug users fill New Zealand jails” is definitely off, but most of the rest is just a bit messy.

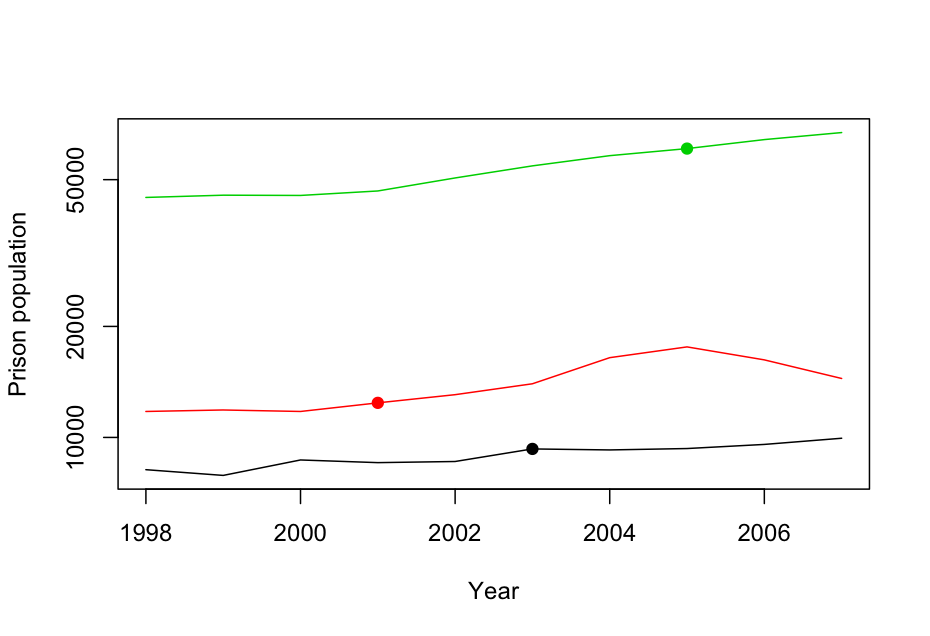
The primary statistical issue is what epidemiologists call “incidence vs prevalence”, economists call “stocks vs flows”, and point-process mavens call “length-biased sampling”.   Because minor drug offenses lead to short sentences, offenders don’t stay in prison long, and so are a much smaller fraction of the prison population than they are of the court workload.  Specifically, as Michelle calculates, the figures mean there were at most an average of about 400 ‘petty drug users’ in NZ jails over the six years in question, from a prison population of more than 8000.  The ‘petty drug users’ are less than 5% of the prison population.  How much less than 5% is hard to calculate, because there’s a mixture of data on number of people and data on number of charges or offences, which aren’t just one to a customer.

The main point of the story is that lots of people are being prosecuted for minor drug crimes, and that this is dumb.  That, I can certainly agree with.  But one more statistical point is being missed. We get quotes like

The New Zealand Drug Foundation said the figures were alarming and showed the court-focused treatment of minor offenders was not working.

But Justice Minister Judith Collins said all drug offending – no matter how minor – should be dealt with through the criminal justice system.

Looking at the figures, about 3000 people a year are charged with cannabis possession. Based on drug-use survey data, about 385000 people use cannabis sometime during a year, so the criminal justice system is actually missing more than 99% of them.  Or, put another way, the proportion of petty drug users in jails (<5%) is substantially lower than in the NZ population as a whole (>14%).  In order to get convicted, you need to be guilty both of cannabis possession and of coming to the attention of the police.   You don’t need to be very cynical to worry about the impact of differential enforcement of the law.

February 11, 2013

Petrol-price data

Stuff reports on rising petrol prices:

All three retailers said refined fuel costs had been steadily rising since the beginning of the year and those costs were now being passed onto customers.

Wouldn’t it be nice if you could get data on this, rather than just believing the petrol companies? Well, you can

The Ministry of Economic Development carries out weekly monitoring of “importer margins” for regular petrol and automotive diesel.  The weekly oil prices monitoring report is reissued every Tuesday with the previous week’s data.

The purpose of this monitoring is to promote transparency in retail petrol and diesel pricing and is a key recommendation from the New Zealand Petrol Review

And if you look at the current graphs, the ‘importer margin’ has been declining since the start of the year, implying increasing pressure on retailers.  On the other hand, the importer margin is about the same as it was this time last year, and as the median from the year before that, so the ‘increasing’ pressure on retailers is partly just business returning to normal.


They also have the underlying data to download.

Real-estate stories: a comparison

Both the Herald and Stuff have stories based on the latest release from Quotable Value. The stories are pretty similar, though the Herald has speculation about the impact on the Reserve Bank rate setting.

Good points:

  • The Herald links to the original media release
  • Stuff points out that prices are still not above the 2007 peak when inflation is taken into account. This isn’t in the media release, but it’s not rocket science and it’s good to see reporters doing it.


February 10, 2013

Two of these things belong together

From an op-ed column in the New York Times, describing three countries

But there is one thing all three have in common: gigantic youth bulges under the age of 30, increasingly connected by technology but very unevenly educated.

If I tell you two of these countries are Egypt and India, can you guess the third?  Anyone? Anyone? Bueller?

It might take a while: in the real world, the third country Friedman includes is better known for instituting draconian (but successful) population-growth controls thirty years ago.

Here are the population age distributions for Egypt, India, and somewhere else, from populationpyramid.net.

egyptindiachina


(via)

January 27, 2013

Auckland rent data: too hard basket

Juha Saarinen, on Twitter, asks for data addresses the Auckland rent shock headlines.

Detailed data on new rentals are available from the ‘market rent’ pages at MoBIE, but there doesn’t seem to be any way to download the whole thing, just individual neighbourhoods.  And it’s a long weekend.


N jobs destroyed?

So. 3News reports that the changes to the warrant of fitness rules are going to lead to 2000 jobs being destroyed.  Since this number comes from opponents of the change, it’s almost certainly exaggerated, but how does it compare to the  general rate of job creation and destruction?

According to Stats NZ, in 2009 there were 252 360 jobs lost. Fortunately, there were 223 860 jobs created, even in the depths of the recession.  In 2008, there were 259 920 jobs created and 205 170 jobs destroyed.  So, the WoF change amounts to about 3 days worth of normal background job destruction.  As this shows, jobs always turn over quite rapidly. If we (or, rather, those of you who have cars) stop spending money on WoFs, the money saved will mostly get spent on something else, and will create broadly the same number of jobs there.

Specific job creation or destruction matters a lot in towns that depend on a single employer or industry, but otherwise the headline numbers are rarely as bad as they sound, unless you have one of the jobs.

January 20, 2013

Crime trends and marriage equality

[Update: according to today’s Herald, Mr McVicar wasn’t speaking for the Sensible Sentencing Trust.  That wasn’t clear from yesterday’s story.]

The Sensible Sentencing Trust, rather surprisingly given their goals, seem to have a view on same-sex marriage. As Stuff reports

Sensible Sentencing Trust leader Garth McVicar has submitted to Parliament that changing the law to allow same-sex marriage will be yet another erosion of basic morals and values in society which have led to an escalation of child abuse, domestic violence, and an ever-increasing prison population.

The story also quotes someone who knows what they are talking about

Criminologist Dr James Oleson, from Auckland University, an expert in deviance, said he was not familiar with any research that would suggest homosexuals would be responsible for a disproportionate amount of crime.

I thought it would be entertaining to look at data from the US, where several states have introduced marriage equality over the past several years.  I looked at states bordering Massachusetts, since it was the first, in 2004, Connecticut and New Hampshire followed a few years later.  Here are graphs of crimes per 100,000 population for these three states and for Rhode Island, which does not yet allow same-sex marriage.

First, violent crime.  The dot is the year that same-sex marriage started.

violent-crime


And property crime

prop-crime

See the upward trend after the dots? Me either.

For Europe it was harder to find crime data, but Mr McVicar mentioned “an ever-increasing prison population”, and I did find 1998-2007 prison populations for European Union countries.  Here are the trends for the three that introduced same-sex marriage during that period: Netherlands (red), Belgium (black), and Spain (green).  Again, the dots are when marriage equality started. Looking at this graph, the phrase “robustly null” comes to mind.

europrison


I don’t know why Mr McVicar thinks he and other New Zealanders will lose their moral fibre and become hardened criminals if the marriage equality bill passes, but it doesn’t seem to have happened in other countries.


January 17, 2013

Briefly

  • An illustration of what happens to promising new medical treatments: the first randomized trial of fish oil found a 70% reduction in rate of deaths, though the study was too small to be reliable.  After the second study, the estimate was down to 20%.  It’s now 4%, with a margin-of-error of 6%. 
  • A Wall Street Journal infographic that’s doing the rounds, on the impact of the ‘fiscal cliff’.  Includes a representative solo mother with two children, who faces a $3300 tax increase. On her income of US$260,000.  The median household income for families with female householder and no husband is US$32978 (that also includes a subset of the unmarried couples with children, but there’s fewer of them in the US than here).
  • Roger Peng writes about the Beijing air pollution. It is indeed ‘crazy bad’, but the Great London Fog was substantially worse.  Similarly, when you read about developing-country water pollution, remember that the Cuyahoga River, in Cleveland, caught fire several times.
January 8, 2013

Spying on your genes

Stuff has a story about genetic testing today, which leads off

Those sending their DNA to be analysed cheaply overseas are obliged to share the results with life insurers and risk losing control of their most sensitive information.

If you read further, it turns out that all the information about insurance and law is Australian.

In October, they had a similar story, with information on the relevant US law.

Perhaps next time there will be some NZ context.

January 1, 2013

Looking a lot like Christmas

Stuff says

Facebook’s Instagram lost almost a quarter of its daily users a week after it rolled out and then withdrew policy changes that incensed users who feared the photo-sharing service would use their pictures without compensation.

There’s two things wrong with this (apart from almost-explicit post hoc ergo propter hoc).  The first is that the ‘quarter of its daily users’ is actually an estimate based on people who use Instagram in a way that shows up on AppData’s counters for Facebook apps. As AppData says

This application is integrated into Facebook from one or more platforms outside the Facebook.com canvas. As such, only users who connect to the app using Facebook are included in the active user counts above & below.  

The Stuff story actually admits to this later, contradicting the lead. Even with the data just coming from a non-representative sample, the change in use is pretty dramatic, but the phrase ‘a week after’ in the story is also important.  AppData shows just two weeks of data free, but we can put together the Dec 14-28 graph shown by Quartz when they covered this with the current graph from Dec 17 to now:

chart


chart2


The new license agreement came out on Dec 17.  Nothing happened for a week, then there was a decrease.  On December 29 there was another decrease.

AppData’s results for weekly active users of Instagram didn’t change much over this period, and other apps also saw a decrease in daily users via Facebook — Stuff mentions Yelp, but I also saw it for Scribd, Spotify, Bing, and TripAdvisor.  In fact, StatsChat has also seen a decrease in users via Facebook over the past week.

It could be that Instagram’s license mistake is reponsible for its decrease, but at this time of year there are other possible explanations for people changing their computer use habits. We’ll be able to tell in a month or so whether the decrease is persistent. Perhaps Stuff can revisit the issue then.