Posts filed under Medical news (341)

February 13, 2012

Adjusting for smoking?

Today the Herald is reporting that soft drinks give you asthma and COPD.  To be fair, the problems with this story are mostly not the Herald’s fault (except for the headline).

The research paper found that asthma and COPD are more common in people who drink a lot of soft drinks.  The main concern with findings like these is that smoking has a huge effect on COPD, and obesity has a fairly large effect, so you would worry that the correlation is just due to smoking and weight. [Or, if you believe some of the other recent new stories, due to bottle-feeding as a baby].

The researchers attempted to remove the effect of smoking and overweight, but their ability to do this is fairly limited.  The idea of regression adjustment is that you can estimate what someone’s risk would have been with a different level of smoking or weight, and so you can extrapolate to make the soft-drink and non-soft-drink groups comparable.  In this case the data came from a telephone survey, and the information they used for adjustment is a three-level smoking variable (never, former, current) and a two-level overweight variable based on self-reported height and weight (BMI < 25 or >25).    If duration of smoking or amount of smoking is important, or if weight distinctions within “overweight” are important, their confounding effects will still be present in the final estimates.

I can’t resist showing you the graph of COPD risks from the paper, which is an excellent example of why not to use fake 3d in graphs. The 3d layout makes it harder to compare the bars — a fairly reliable indication of a bad graph is that it is so unreadable that the data values need to be printed there too.
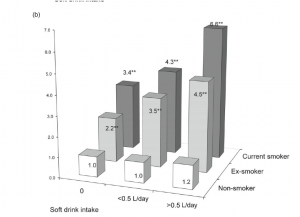
A 2d barchart will almost always be better than a 3d barchart, and this is no exception.  The comparisons are clearer, and in particular it is clear how big the effect of smoking really is.  It’s only in never-smokers that we have a precise description of smoking, and these are the only group that doesn’t show a trend.
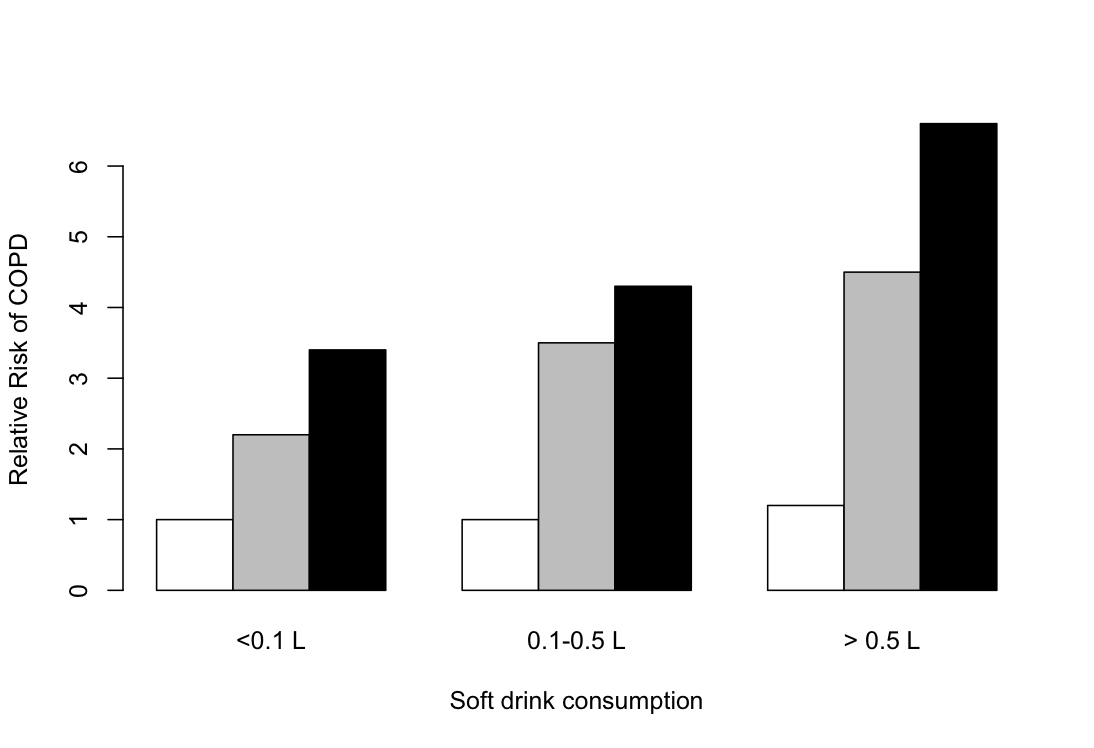
But even the 2d barchart is misleading here.  The key  rules for a barchart are that zero must be a relevant value, and that uncertainty must be relatively unimportant. Zero relative risk is an impossible value — the “null” value for relative risk is 1.0 — and there is a lot of uncertainty in these numbers (although unfortunately the researchers don’t tell us how much).  A dot chart is better, with a logarithmic scale for relative risk so that the `null’ value is 1 rather than 0.
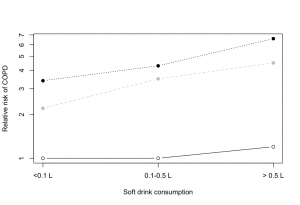
Needs standard errors, which in our case we have not got.


February 8, 2012

Breakfast wars

“High carb breakfasts boost brain power”.  Now, why does that sound familiar.. Oh, yes.  Last month it was the Egg Foundation pushing “Eggs may increase alertness”. This time it’s the Glycemic Index Foundation.

As the school year gets under way, new research is adding further weight to evidence that breakfast is the most important meal of the day, especially for children.

Research published last June, so it’s hardly new for the new school year. And the research only studied children who regularly eat breakfast, so it can’t really be evidence that breakfast is the most important meal of the day, or say whether this is more true for children.

Research by three British institutions 

Author names? Journal names? Institution names?  I’ve seen at least five universities in Britain with my own eyes, and am reliably informed there are several more.

has shown a strong link  between low GI, higher carbohydrate breakfasts and better academic  performance.

We can allow “strong link” as mere puffery, but the research did not include any data whatsoever about academic performance

The study, which involved 60 students, found that a low GI,  higher carbohydrate breakfast helped students do maths tasks more  quickly and accurately, and improved attentiveness.

I suppose counting backwards from 100 by 7s just about qualifies as a maths task, even for teenagers, but it’s a bit of a stretch.

The Glycemic Index (GI) is a measure of how effective  carbohydrates – sugars and starches – are on blood glucose levels.

GI is a measure of how fast or slowly carbohydrates affect blood glucose levels.  Wikipedia has it much more clearly Carbohydrates that break down quickly during digestion and release glucose rapidly into the bloodstream have a high GI; carbohydrates that break down more slowly, releasing glucose more gradually into the bloodstream, have a low GI.”

At least, by quoting Dr Alan Barclay, of the Glycemic Index Foundation, the story did make it possible to track down the real research. Dr Barclay’s blog has a link to the paper, which was published in the European Journal of Clinical Nutrition.   Unless you’re at a university, you will have to pay to read it, so I will summarise.

Of the 60 children recruited, 19 had a “High GL, low GI” breakfast. This meant they were in the lower half for GI and the upper half for glycemic load (total carbohydrates), not that their breakfasts were high or low GI on an absolute scale.  There were three other groups, from the three other combinations of high/low GI and  GL.

The children had seven cognitive function tests. Three of the seven didn’t show any differences between the breakfast groups. For the other four tests the results were mixed:

Specifically, high-GI was associated with better immediate recall (short-term memory), high-GL with better matrices performance (inductive reasoning), and low-GI and high-GL with better speed of information processing (vigilance, sustained attention) and serial sevens performance (vigilance, working memory).

And this is before we start worrying about the correlation vs causation issue, the fact that the high-GL,low-GI breakfast averaged more total calories, or the fact that 13 of the 19 teenagers in the high-GL, low-GI group were girls.

Day care wars

There’s a good article in Stuff today on day-care.  The reporters describe the anti-daycare research of Dr Aric Signman being pushed by Family First, but also the reaction of the scientific community to that research.    As usual, no-one links to sources, so as a public service


[Update: The Herald now also has a story, and it is also good.  On the other hand, their bogus poll for today asks “Is daycare harmful for young children?”  They could at least stick to questions where majority opinion would be relevant.]

February 3, 2012

HIV trends

Given this blog’s recent focus on things claiming unconvincingly to be surveys, you must be expecting a post on the statistic that 20% of HIV-positive gay men in Auckland don’t know they’re infected.

It’s obviously going to be hard to get an accurate estimate, since we don’t have a citywide list of gay men in Auckland. We don’t know what proportion of the population is gay; in fact, we wouldn’t even be able to get consensus on what the definition would be.

The approach used by the Otago researchers was to visit places like bars, and events like Big Gay Out.   This gives a reasonably well-defined sampling frame — the sample isn’t from all gay men in Auckland, but we do know who was targetted.   About 50% of the people they approached agreed to fill in a questionnaire, and 80% of those gave a saliva sample that was subsequently tested.   It’s not perfect, but it’s the best you are likely to be able to do in practice; a sharp contrast with the bogus polls on the farm sales, where simple random-digit dialing for a sample of ten people would have been better.

The final numbers supporting the conclusion are small:  68 men were HIV-positive; 15 of them were not diagnosed. The  ‘1 in 15’ figure could be as low as 1 in 20 or as high as 1 in 12, and that’s before you start worrying about bias from non-responders being different. A comparison to other surveys of this kind in NZ and in other parts of the world is still sensible, and the research paper says the infection rate is lower than in most places, but the proportion who don’t know they are infected is higher.

There’s a lot of research currently on ways to sample from populations that can’t be reached effectively by random-digit dialling, but where there are social links between members: jazz musicians, injecting drug users, homeless people.  The general approach is to get people to recruit each other, and the difficult part is to try to correct for the bias this causes, but it’s not clear that the current methods actually work.


Incidentally, the NZ Herald report contains the strange paragraph

The researchers compared respondents’ self-reported HIV test history with their saliva result to find 1.3 per cent of HIV positive men did not know they were infected.

which initially doesn’t seem to make any sense and contradicts the headline.  Most of the problem is the usual inattention to denominators:  take 15/1068, to get the proportion of testable samples that were HIV positive and undiagnosed, and you get close to 1.4%.  That is 1.4% of sampled men were HIV positive and didn’t know it. Confusing P(A and B) with P(A|B) is a bit unusual — usually the Herald confuses P(A|B) with P(B|A).

The 1.3% figure actually appears in the research paper, and it seems to be a problem of premature rounding:  round the proportion HIV positive to 6.5% and the proportion of those undiagnosed to 20%, and you get 6.5%×20%=1.3%.


January 20, 2012

Predicting whether you’ll live to 100.

From the Herald

Scientists are claiming a genetic test can predict whether someone will live to 100 years old.

The study…claims to be able to predict exceptional longevity with 60 to 85 percent accuracy, depending on the subject’s age.

You can read the paper, which is in the open-access journal PLoS One.

Whether the prediction really works comes down in part to what you mean by “60 to 85% accuracy”.  There’s a very easy way to predict whether someone will live to 100 years old, with better than 99% accuracy.  Ask them if they are over 100. If they say “Yes”, predict “Yes”; if they say “No”, predict “No”.  Since almost no-one lives to be 100 you will almost always be right.

The new test is not as useless as this, but it still isn’t terribly accurate.  Distinguishing people who live to 90 from those who live to 100, the test gets the correct prediction for about  half of the centenarians and for about two-thirds of the non-centenarians.  You could probably predict that well in 90+ year olds by asking them how their health is, and whether they can get around on their own.  The ability to predict survival to 105 among 100-year-olds is slightly better, but again, probably not as accurate as you could get more easily from health information.  The point of the paper isn’t really prediction. It’s to find genes that are connected with longevity, which are still not well understood, and the reason for talking about prediction is to make the point that genetic variations do matter in extreme old age.  Even from this point of view the results are a bit over-sold, since the biggest component of the genetics is a well-known gene, APO E, where commercial testing has been (controversially) available for years.

This study has attracted a lot of media attention around the world. Some stories mentioned this note from the journal editors:

While we recognize that aspects of this study will attract attention owing to the history and the strong claims made in the paper, the handling editor, Greg Gibson, made the decision that publication is warranted, balancing the extensive peer review and the spirit of PLoS ONE to allow important new results and approaches to be available to the scientific community so long as scientific standards have been met.  We trust that publication will facilitate full evaluation of the study.

Others didn’t.

Bogus smoking poll.

From the NZ Herald

Auckland councillors are divided over a proposed smoking ban in public outdoor areas, but the majority of New Zealanders say the idea is either sensible or good in theory.

If you read the article, it turns out that the claim about the majority of New Zealanders is based on the clicky poll on the Herald website.  That is, the data come from what the newspapers ordinarily call “an unscientific poll”, and we at StatsChat prefer to call “a bogus poll“.   Last week I criticised the Drug Foundation online poll results as ‘dodgy numbers’.  This is well beyond ‘dodgy’.

In the Drug Foundation poll, the point was that a non-negligible fraction of people believed drug driving was safe, and the poll provided at least some support for the argument even if the numbers were unreliable.  And the Drug Foundation collected a lot of demographic information so it was possible to say something about the ways in which the sample was biased.

In this example it really matters whether the support is, say , 40% or 70%, and we have no idea of the extent of the bias, except that there are probably responses from people outside Auckland.

If a ban on smoking in public outdoor areas had sufficiently strong majority support (perhaps 2/3 majority), I wouldn’t necessarily be against it, but we need real numbers, based on real opinions of a concrete plan.

January 17, 2012

Internet eats your brains!

Stuff is telling us “internet overuse could cause brain damage”, with even less than usual in the way of referencing: no journal, no researcher names, no university (no, “Chinese” is not sufficiently specific. There’s quite a few Chinese scientists out there).  Fortunately, the Google is always there to help, and it turns out that the relevant paper is available online, free, in PLoS One.

The first thing to note is that the paper says nothing about the effects of amount of internet use. Nothing.  It’s about internet addiction, which is at least trying to be a pathological condition distinct from just using the internet a lot.   Secondly, although the paper does claim to find “changes” in brain structure,  the participants had MRI brain imaging only once, so there is no data about changes.  What the researchers found is differences in brain structure between people with and without internet addiction, similar to the differences in people addicted to other things.

This immediately raises the question of cause and effect.  Is your brain different because you are addicted, or are you addicted because your brain is different?

Interestingly, the paper claims that ” the incidence rate of internet addiction among Chinese urban youths is about 14%“.  This seems implausibly high, and it’s twice the prevalence found in a recent Hong Kong survey  published in the British Journal of Psychiatry, but I suppose if the diagnostic criteria are still a bit fuzzy you would expect overdiagnosis in a large-scale survey.

January 13, 2012

Drug driving: dodgy numbers in a good cause?

More than a year ago, ESR scientists produced a report on drugs and alcohol found in blood samples taken after fatal crashes.  Now, the Drug Foundation is launching a publicity campaign using the data.  Their website says “Nearly half of drivers killed on New Zealand roads are impaired by alcohol, other drugs, or both.” But that’s not what the ESR report found. [Edited to add: the Drug Foundation is launching a campaign, but the TV campaign isn’t from them, it’s from NZTA]

The ESR report defined someone as impaired by alcohol if they had blood alcohol greater than 0.03%, and said they tested positive for other drugs if the other drugs were detectable.   If you look at the report in more detail, although 351/1046 drivers had detectable alcohol in their blood, only 191/1046 had more than 0.08%.  At 0.03% blood alcohol concentration there may well be some impairment of driving, and near 0.08% there’s quite a lot, but we can’t attribute all those crashes to alcohol impairment rather than inexperience, fatigue, bad luck, or stupidity.  At least the blood alcohol concentrations are directly relevant to impairment.  An assay for other drugs can be positive long after the actual effect wears off. For example, a single use of cannabis will show up in a blood test for 2-3 days, and regular use for up to a week.  In  fact, the summary of the ESR report specifically warns “Furthermore, it is important to acknowledge that the presence of drugs and alcohol in the study samples does not necessarily infer significant impairment.”   Regular pot smokers who are scrupulously careful not to drive while high would still show up as affected by drugs in the ESR report.  In fact, the Drug Foundation makes this distinction when they talk about random roadside drug testing, pointing out the advantages of a test of actual impairment over a test of any presence of a drug.

The Drug Foundation also did a survey of community attitudes to driving while on drugs (also more than a year ago), and it is interesting how many people think that stimulants and cannabis don’t impair their driving.  However, if you look at the survey, it turns out that it was an online poll, and “Respondents were recruited to the online survey via an advertising and awareness campaign that aimed to stimulate interest and participation in the study.” Not surprisingly, younger people were over-represented “The mean age of respondents was 38.1 years”, as were people from Auckland and Wellington. Maori, Pasifika, and Asians were all under-represented.  36% of respondents had used cannabis in the past year, more than twice the proportion in the Kiwi population as a whole.  No attempt was made to standardise to the whole NZ population, which is the fundamental step in serious attempts at accurate online polling.  [If we could use the data as a teaching example, I’d be happy to do this for them and report whether it makes any difference to the conclusions]

And while it’s just irritating that news websites don’t link to primary sources, it is much less excusable that the Drug Foundation page referencing the two studies doesn’t provide links so you can easily read them. The study reports are much more carefully written and open about the limitations of the research than any of the press releases or front-line website material.[The NZTA referencing is substantially less helpful]

For all I know, the conclusions may be broadly correct. I wouldn’t be at all surprised if many drug users do believe silly things about their level of impairment. Before  the decades of advertising and enforcement, a lot of people believed silly things about the safety of drunk driving.  And the new TV ads are clever, even if they aren’t as good as the ‘ghost chips’ ad.  But the numbers used to advertise the campaign don’t mean what the people providing the money say they mean.  That’s not ok when it’s politicians or multinational companies, and it’s still not ok when the campaigners have good intentions. [Edited to add: I think this last sentence still stands, but should be directed at least equally at the NZTA].


[Update: Media links: TVNZ,  3 News, Stuff, NZ Herald, Radio NZ]

January 12, 2012

Who you gonna call?

Keith Humphreys, an addiction researcher at Stanford, writes The newest Behavioral Risk Factors Surveillance System survey by the US CDC shows a substantially higher rate of binge drinking than in past surveys.  BRFSS is the world’s largest telephone survey, and in 2009 they started calling cellphones for the first time.

Cellphone users, and especially those who don’t have any landline phone, are a lot younger on average than the rest of the population.  That in itself need not be disastrous for surveys, since we know what proportion of the population is in each age group, and can rescale the numbers to remove the bias.  The problem is that cellphone users also are different in other ways that are harder to measure, as the CDC’s experience shows.

Genotyping for fun and profit.

DNAThe papers are reporting an announcement of cheap DNA sequencing (or, as they like to put it ‘decoding’).  The new machine claims to be able to produce a human whole-genome sequence for USD1000, or about $1250 at current exchange rates.  This is, allegedly, a “milestone in bringing nearer the possibility of routinely sequencing a person’s entire DNA in order to identify, and possibly correct, genetic defects that could lead to disease or death”.  It remains to be seen what the accuracy and cost of the machine will be in practical use.  The $1000 doesn’t include any of the cost of blood samples and DNA extraction. It also doesn’t include the high administrative costs of clinical-quality sample tracking: in large-scale research you might be able to accept a 1 in 1000 chance of two samples being accidentally switched, but not in clinical medicine

Medical uses of sequencing are certainly closer as the cost falls, but cost is far from the only barrier.  At the moment, we have very little clue as to what DNA sequence variants are even predictive of disease risk. Even if disease risk could be predicted usefully, which is far from obvious for most diseases, that isn’t worth much clinically unless you can do something about it.  We’ve had the ability to measure thousands of genetic variants at much lower prices than $1000 for years, and haven’t been able to think of much worth doing with it clinically.

The main current applications of DNA sequencing in New Zealand are in the dairy industry, precisely because tiny improvements in prediction are much more valuable in agriculture (where you can manipulate breeding) than in medicine. The Livestock Improvement Corporation has been a leader in using DNA information to select animals for breeding, and a lot more cows than humans have had their genomes sequenced.

In the short term, both agricultural research and medical research should benefit from more-affordable genotyping. It may become possible to do some larger-scale genetic epidemiology in New Zealand. But you shouldn’t hold your breath for the NHI system to start paying for genome sequencing.