November 3, 2020

Do first home buyers cause housing shortages?

From a story by Eva Corlett at Radio NZ

Property Investors Federation’s executive officer Sharon Cullwick argued while property investors may not be helping the housing supply problem, they aren’t hindering it.

But she said first home buyers are, when it comes to purchasing rentals off the market.

“If a first home buyer purchases a property that was a rental property, then you’ll need another house to house the extra people living in that rental house.”

“So every time a first home buyer buys a house even though it’s great they are getting into the market – it actually makes the housing crisis worse,” she said.

This is obviously a convenient thing for the Property Investors Federation to believe, so it’s worth looking at the evidence.  It’s true that property investors, as investors, aren’t reducing the housing supply (just the housing for sale and perhaps its affordability).  But are first home buyers?

Clearly[citation needed]  rental houses don’t just disappear, like those mysterious shops selling magical artefacts, when the renters move out and buy a house.  For every rental house that we lose, an owner-occupied house is created; to first order, nothing changes.

The claim being made is more subtle. We know that owner-occupied homes have fewer people living in them, on average, than rented homes.   If that difference is directly caused by being owner-occupied, then having more home owners would cause a reduction in average household size. While it wouldn’t cause a decrease in housing supply, it would increase the gap between demand and supply.

We can assume for the sake of argument that this isn’t primarily due to different sorts of homes being rented vs owner-occupied and say that, on average, a given home will have more people (or, at least, more adults) living in it if it is being rented than if it is being occupied by the owner.  Even stipulating all that doesn’t actually settle the question.

What we’re talking about here is the process of household formation. In the traditional Hallmark/Disney version, people start off living with their parents, they proceed through a stage of living with friends (or at least with flatmates), and then end up living in couples who eventually have 2.3 kids.   The number of adults per household tends to decrease as you go from the flatting stage to the couple stage, and also there i traditionally a progression from renting to owning your home. Because these transitions both happen over broadly the same age range, there’s an automatic tendency for them to be correlated. At 20, people are more likely  to be both renting and living in large households than at 40.

Here, though, we have a stronger claim, that buying a house is, in Auckland, the immediate cause of smaller households, or the even stronger claim that this is necessarily true.  The strongest version is clearly wrong: it is quite possible for people to form small, stable adult households while living in rental accomodation or, conversely, to buy a house but still have flatmates to help pay the bills. Data on household sizes are not what you’d need to settle the intermediate claim. It could be true, but it could also be false.

But suppose, again for the sake of argument, that the Property Investors Federation was correct: that there is a genuine causal connection and that buying (rather than renting) real estate is an unavoidable step in household formation for many people. To the extent that buying a house is inextricably linked to household formation, blaming first-home buyers is as inappropriate as blaming babies or immigrants or people moving from the rest of NZ or people with home offices. The housing crisis is the problem: it’s impeding adult household formation, and preventing families with kids getting enough space, making it harder to work from home, and making it harder for people to move to Auckland from the rest of NZ or the rest of the world.

Auckland has a housing crisis because there aren’t enough homes. This has not largely been due to changes in ownership distribution: we used to have more young homeowners, not fewer. Rules and procedures designed to impede building new homes have been a bigger contributor.
November 2, 2020

Top 14 Predictions for Round 8

Team Ratings for Round 8

This is a new competition which I have had in mind for some time since it is one of the three top European competitions, the other two being the English Premiership and the Pro 14 (not solely European usually but happens to be this year so far).

I ran through the predictions for the first 7 rounds to get to this round but decided not to publish them. You will have to take it on trust that I didn’t fake it. I can report that the first couple of rounds were pretty dodgy, starting with only 50% correct. I expect to get a bit over 70% correct longer term in this competition based on my computations. I have data from the 2012-2013 season through to the incomplete 2019-2020 season which I used to create my initial ratings and to select parameters for the model.

The basic method is described on my Department home page.
Here are the team ratings prior to this week’s games, along with the ratings at the start of the season.

Current Rating Rating at Season Start Difference
Racing-Metro 92 6.46 6.21 0.20
Lyon Rugby 6.38 5.61 0.80
Stade Toulousain 5.14 4.80 0.30
La Rochelle 5.01 2.32 2.70
Clermont Auvergne 4.45 3.22 1.20
RC Toulonnais 3.24 3.56 -0.30
Bordeaux-Begles 2.62 2.83 -0.20
Montpellier 2.55 2.30 0.20
Stade Francais Paris -1.55 -3.22 1.70
Castres Olympique -2.11 -0.47 -1.60
Section Paloise -3.79 -4.48 0.70
Brive -4.17 -3.26 -0.90
Aviron Bayonnais -4.88 -4.13 -0.80
SU Agen -8.79 -4.72 -4.10


Performance So Far

So far there have been 41 matches played, 29 of which were correctly predicted, a success rate of 70.7%.
Here are the predictions for last week’s games.

Game Date Score Prediction Correct
1 Brive vs. Clermont Auvergne Oct 31 21 – 43 -1.80 TRUE
2 Castres Olympique vs. Racing-Metro 92 Oct 31 10 – 13 -3.10 TRUE
3 Bordeaux-Begles vs. SU Agen Oct 31 71 – 5 14.20 TRUE
4 Section Paloise vs. La Rochelle Nov 01 24 – 35 -2.60 TRUE
5 Stade Francais Paris vs. Stade Toulousain Nov 01 48 – 14 -3.30 FALSE


Predictions for Round 8

Here are the predictions for Round 8. The prediction is my estimated expected points difference with a positive margin being a win to the home team, and a negative margin a win to the away team.

Game Date Winner Prediction
1 RC Toulonnais vs. Brive Nov 06 RC Toulonnais 12.90
2 Stade Toulousain vs. Castres Olympique Nov 07 Stade Toulousain 12.80
3 Bordeaux-Begles vs. Aviron Bayonnais Nov 07 Bordeaux-Begles 13.00
4 Montpellier vs. Stade Francais Paris Nov 07 Montpellier 9.60
5 Racing-Metro 92 vs. Section Paloise Nov 07 Racing-Metro 92 15.70
6 SU Agen vs. Lyon Rugby Nov 08 Lyon Rugby -9.70
7 La Rochelle vs. Clermont Auvergne Nov 08 La Rochelle 6.10


Super Rugby Unlocked Predictions for Round 5

Team Ratings for Round 5

The basic method is described on my Department home page.
Here are the team ratings prior to this week’s games, along with the ratings at the start of the season.

Current Rating Rating at Season Start Difference
Sharks 2.54 4.01 -1.50
Bulls 1.33 -1.45 2.80
Stormers -1.36 1.00 -2.40
Lions -2.49 -4.82 2.30
Cheetahs -8.43 -10.00 1.60
Pumas -11.27 -10.00 -1.30
Griquas -11.58 -10.00 -1.60


Performance So Far

So far there have been 11 matches played, 8 of which were correctly predicted, a success rate of 72.7%.
Here are the predictions for last week’s games.

Game Date Score Prediction Correct
1 Lions vs. Griquas Oct 30 61 – 31 11.10 TRUE
2 Pumas vs. Sharks Oct 31 19 – 42 -7.10 TRUE
3 Bulls vs. Stormers Oct 31 39 – 6 3.40 TRUE


Predictions for Round 5

Here are the predictions for Round 5. The prediction is my estimated expected points difference with a positive margin being a win to the home team, and a negative margin a win to the away team.

Game Date Winner Prediction
1 Sharks vs. Cheetahs Nov 06 Sharks 15.50
2 Griquas vs. Stormers Nov 07 Stormers -5.70
3 Lions vs. Bulls Nov 07 Lions 0.70


Mitre 10 Cup Predictions for Round 9

Team Ratings for Round 9

The basic method is described on my Department home page.
Here are the team ratings prior to this week’s games, along with the ratings at the start of the season.

Current Rating Rating at Season Start Difference
Tasman 14.88 15.13 -0.20
Auckland 9.71 6.75 3.00
Wellington 6.61 6.47 0.10
Bay of Plenty 5.65 8.21 -2.60
North Harbour 4.62 2.87 1.70
Canterbury 4.38 8.40 -4.00
Waikato 3.13 1.31 1.80
Hawke’s Bay 1.60 0.91 0.70
Otago -1.06 -4.03 3.00
Taranaki -3.90 -4.42 0.50
Northland -9.02 -8.71 -0.30
Counties Manukau -10.56 -8.18 -2.40
Southland -11.86 -14.04 2.20
Manawatu -14.06 -10.57 -3.50


Performance So Far

So far there have been 56 matches played, 37 of which were correctly predicted, a success rate of 66.1%.
Here are the predictions for last week’s games.

Game Date Score Prediction Correct
1 Canterbury vs. Otago Oct 30 16 – 23 10.70 FALSE
2 Wellington vs. Tasman Oct 31 3 – 19 -3.60 TRUE
3 Northland vs. North Harbour Oct 31 8 – 24 -9.70 TRUE
4 Auckland vs. Waikato Oct 31 31 – 10 7.80 TRUE
5 Bay of Plenty vs. Hawke’s Bay Nov 01 22 – 17 7.60 TRUE
6 Manawatu vs. Southland Nov 01 24 – 12 -1.00 FALSE
7 Taranaki vs. Counties Manukau Nov 01 27 – 31 11.70 FALSE


Predictions for Round 9

Here are the predictions for Round 9. The prediction is my estimated expected points difference with a positive margin being a win to the home team, and a negative margin a win to the away team.

Game Date Winner Prediction
1 Southland vs. Otago Nov 06 Otago -7.80
2 Auckland vs. Northland Nov 07 Auckland 21.70
3 North Harbour vs. Counties Manukau Nov 07 North Harbour 18.20
4 Tasman vs. Canterbury Nov 07 Tasman 13.50
5 Hawke’s Bay vs. Wellington Nov 08 Wellington -2.00
6 Waikato vs. Bay of Plenty Nov 08 Waikato 0.50
7 Manawatu vs. Taranaki Nov 08 Taranaki -7.20


October 27, 2020

Mitre 10 Cup Predictions for Round 8

Team Ratings for Round 8

The basic method is described on my Department home page.
Here are the team ratings prior to this week’s games, along with the ratings at the start of the season.

Current Rating Rating at Season Start Difference
Tasman 14.03 15.13 -1.10
Auckland 8.82 6.75 2.10
Wellington 7.46 6.47 1.00
Bay of Plenty 5.91 8.21 -2.30
Canterbury 5.54 8.40 -2.90
North Harbour 4.14 2.87 1.30
Waikato 4.02 1.31 2.70
Hawke’s Bay 1.34 0.91 0.40
Otago -2.21 -4.03 1.80
Taranaki -2.86 -4.42 1.60
Northland -8.54 -8.71 0.20
Southland -10.98 -14.04 3.10
Counties Manukau -11.60 -8.18 -3.40
Manawatu -14.94 -10.57 -4.40


Performance So Far

So far there have been 49 matches played, 33 of which were correctly predicted, a success rate of 67.3%.
Here are the predictions for last week’s games.

Game Date Score Prediction Correct
1 Otago vs. Northland Oct 23 30 – 7 7.20 TRUE
2 Bay of Plenty vs. Canterbury Oct 24 44 – 8 -0.90 FALSE
3 Hawke’s Bay vs. Manawatu Oct 24 47 – 12 16.90 TRUE
4 North Harbour vs. Auckland Oct 24 23 – 22 -2.20 FALSE
5 Counties Manukau vs. Wellington Oct 25 20 – 53 -13.60 TRUE
6 Tasman vs. Southland Oct 25 47 – 10 26.50 TRUE
7 Waikato vs. Taranaki Oct 25 27 – 20 10.50 TRUE


Predictions for Round 8

Here are the predictions for Round 8. The prediction is my estimated expected points difference with a positive margin being a win to the home team, and a negative margin a win to the away team.

Game Date Winner Prediction
1 Canterbury vs. Otago Oct 30 Canterbury 10.70
2 Wellington vs. Tasman Oct 31 Tasman -3.60
3 Northland vs. North Harbour Oct 31 North Harbour -9.70
4 Auckland vs. Waikato Oct 31 Auckland 7.80
5 Bay of Plenty vs. Hawke’s Bay Nov 01 Bay of Plenty 7.60
6 Manawatu vs. Southland Nov 01 Southland -1.00
7 Taranaki vs. Counties Manukau Nov 01 Taranaki 11.70


Pro14 Predictions for Round 4

Team Ratings for Round 4

The basic method is described on my Department home page.
Here are the team ratings prior to this week’s games, along with the ratings at the start of the season.

Current Rating Rating at Season Start Difference
Leinster 17.00 16.52 0.50
Munster 9.21 9.90 -0.70
Glasgow Warriors 5.26 5.66 -0.40
Ulster 5.09 4.58 0.50
Edinburgh 4.18 5.49 -1.30
Scarlets 2.38 1.98 0.40
Cardiff Blues 1.19 0.08 1.10
Connacht 1.08 0.70 0.40
Cheetahs -0.46 -0.46 0.00
Ospreys -1.94 -2.82 0.90
Treviso -3.87 -3.50 -0.40
Dragons -8.63 -7.85 -0.80
Southern Kings -14.92 -14.92 0.00
Zebre -15.57 -15.37 -0.20


Performance So Far

So far there have been 18 matches played, 13 of which were correctly predicted, a success rate of 72.2%.
Here are the predictions for last week’s games.

Game Date Score Prediction Correct
1 Leinster vs. Zebre Oct 24 63 – 8 37.70 TRUE
2 Treviso vs. Scarlets Oct 24 3 – 10 1.80 FALSE
3 Ospreys vs. Glasgow Warriors Oct 25 23 – 15 -1.60 FALSE
4 Ulster vs. Dragons Oct 26 40 – 17 19.60 TRUE
5 Edinburgh vs. Connacht Oct 26 26 – 37 11.20 FALSE
6 Munster vs. Cardiff Blues Oct 27 38 – 27 15.30 TRUE


Predictions for Round 4

Here are the predictions for Round 4. The prediction is my estimated expected points difference with a positive margin being a win to the home team, and a negative margin a win to the away team.

Game Date Winner Prediction
1 Dragons vs. Munster Nov 02 Munster -11.30
2 Connacht vs. Treviso Nov 02 Connacht 11.50
3 Scarlets vs. Edinburgh Nov 02 Scarlets 4.70
4 Cardiff Blues vs. Ulster Nov 03 Cardiff Blues 2.60
5 Zebre vs. Ospreys Nov 03 Ospreys -7.10
6 Glasgow Warriors vs. Leinster Nov 03 Leinster -5.20


Super Rugby Unlocked Predictions for Round 4

Team Ratings for Round 4

The basic method is described on my Department home page.
Here are the team ratings prior to this week’s games, along with the ratings at the start of the season.

Current Rating Rating at Season Start Difference
Sharks 1.46 4.01 -2.50
Stormers 0.54 1.00 -0.50
Bulls -0.57 -1.45 0.90
Lions -3.76 -4.82 1.10
Cheetahs -8.43 -10.00 1.60
Pumas -10.19 -10.00 -0.20
Griquas -10.31 -10.00 -0.30


Performance So Far

So far there have been 8 matches played, 5 of which were correctly predicted, a success rate of 62.5%.
Here are the predictions for last week’s games.

Game Date Score Prediction Correct
1 Pumas vs. Stormers Oct 23 37 – 42 -6.50 TRUE
2 Bulls vs. Sharks Oct 24 41 – 14 -1.20 FALSE


Predictions for Round 4

Here are the predictions for Round 4. The prediction is my estimated expected points difference with a positive margin being a win to the home team, and a negative margin a win to the away team.

Game Date Winner Prediction
1 Lions vs. Griquas Oct 30 Lions 11.10
2 Pumas vs. Sharks Oct 31 Sharks -7.10
3 Bulls vs. Stormers Oct 31 Bulls 3.40


October 23, 2020

Compared to what?

From Radio NZ (and ODT)

Analysis by the consultancy firm Dot Loves Data shows that over a five-year period the rate of assaults in Wellington was 10 times higher than the national average.

It considered all reported crimes over a five-year period, and found in the capital there were 2056 counts of assault and 176 counts of sexual assault reported.

It’s pretty clear that Wellington is not going to have a rate of assaults 10 times higher than the national average in any very useful sense.  Unfortunately, I don’t have the report that Dot loves Data are said to have published,  and it’s not clear from the story exactly what comparisons they did, so I’ll have to do this the hard way. The advantage is that you can see what I did, and also see some of the limitations in the data.

Crime data can be found  on policedata.nz.  I looked at ‘Victimisations by Time and Place: Trends’, ie, people who reported getting crimed, regardless of whether the offender was caught and prosecuted, for the five years ending 2020-8-31 (since that’s the end of the data) and where the place of the assault was reported. Having the place reported is a surprising strong restriction: in the last 12 months about 60% of the assaults aren’t assigned to a location* for confidentiality reasons, because they occurred in dwellings. The lack of location data is actually a problem when the point of the story is to compare locations, but let’s pass over it for now and just note that we’re comparing assaults occurring in public rather than all assaults.

For the category  “Acts intended to cause injury”  there were 91472 in New Zealand, 4337 in Wellington City, and 10303 in Wellington Region.   The 91472 acts intended to cause injury that happened in public were about 50,000 ‘common assault’, 17,000 ‘serious assault resulting in injury’ and 23,000 ‘serious assault not resulting in injury’. These aren’t the names of NZ crimes, because (a) they are standardised official-statistics categories and (b) if no-one is arrested or prosecuted it’s a bit hard to be precise about what crime a court would find had occurred. The ‘intended to cause injury’ categories don’t include sexual assault, which is in a separate group and is left as an exercise for the reader.  My figures for assault  don’t accurately match the reported ones, but they probably aren’t exactly the same time frame and might be different in other ways.

The population of New Zealand is about 4.9 million,  of the Wellington Region is about 500,000, and of Wellington City is about 200,000.  Wellington City has about a 9% higher rate per capita of assault victimisation than the country as a whole. Not ten times, 1.09 times. Wellington Region is about 4% higher than the  country as a whole.

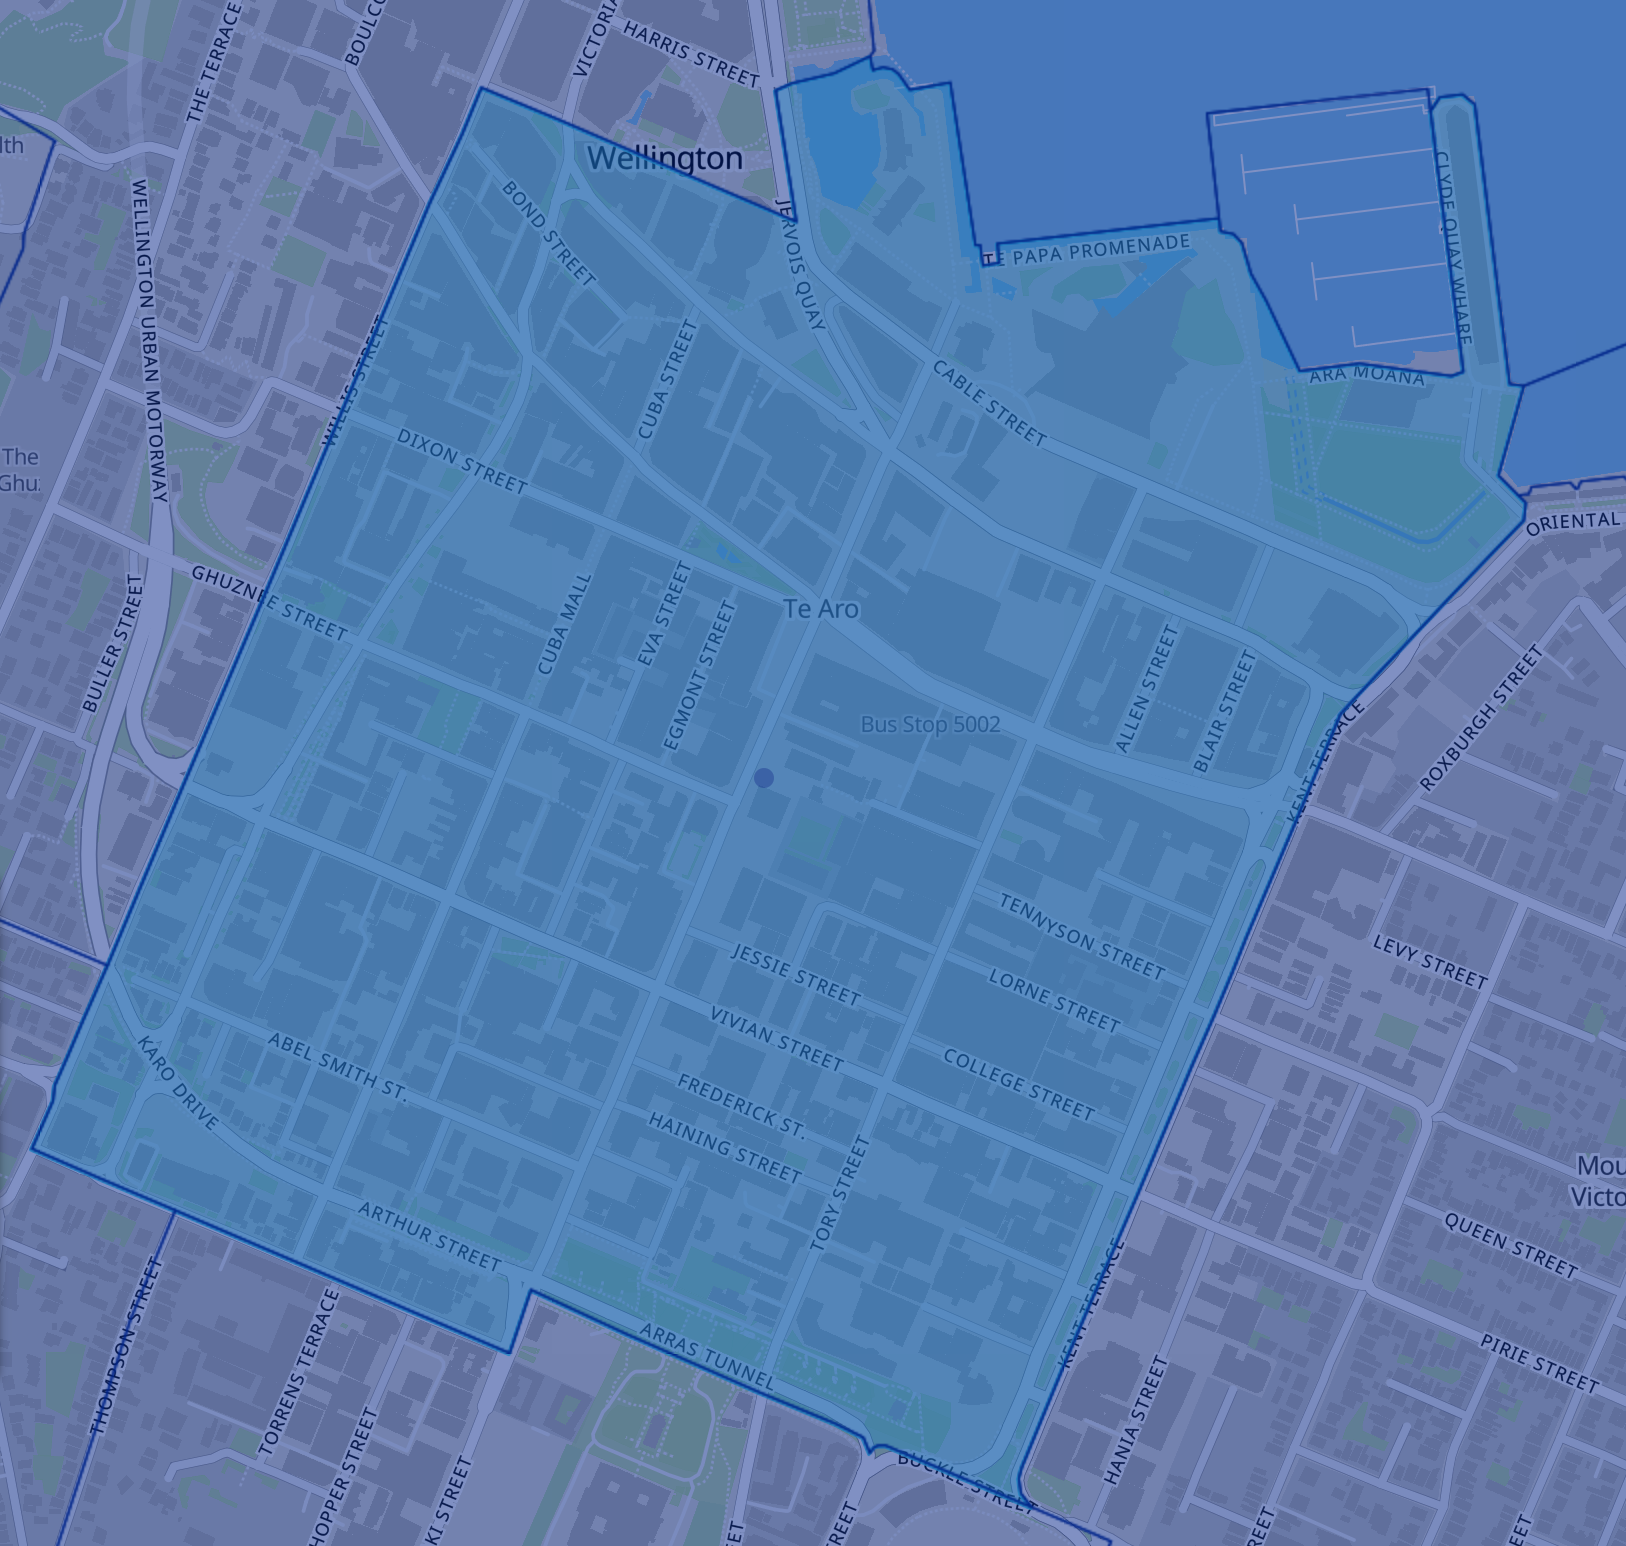
Now, since the story was focused on Courtenay Place and Cuba St, maybe the ‘ten times’ claim was supposed to apply there, rather than to ‘the capital’ as a whole and we should narrow down the geographic focus. The Census Area Unit covering Courtenay Place and Cuba St is “573101 Willis St – Cambridge Terrace”

In that area, there were 1858 ‘acts intended to cause injury’ over five years that happened in public, in an area with a population of 9230. On a per capita population basis that’s  10.8 times the rate for NZ as a whole, suggesting something like this is the analysis being reported.

But why are we dividing by the resident population of Te Aro? Most of the people out partying there don’t live there — they live all over the city and the Wellington region — but they, not the residents, are the relevant denominator. In fact, a lot of assaults of residents will not be in the statistics, because they will happen in someone’s home. At the other extreme, you could leave out population entirely and compare the 1858 assaults in the area unit to the average of 45 for census area units all over NZ — a factor of 40.   That also doesn’t answer any really useful question.

There seem to be two implied statistical questions that are more relevant to the news stories:

  1. Is going out to Te Aro substantially more dangerous than going to bars and nightclubs elsewhere in the country, on an individual party-goer basis?
  2. Would cracking down on the Courtenay Place/Cuba precinct reduce assaults?

Neither question can be answered with administrative data.  For the first question you’d need data on number of visitors to  the area on, say, Friday and Saturday nights and to other areas in the Wellington region and around the country.  For Wellington City it might be feasible to estimate this from parking, rideshare,  and public transport usage, or from cellphone densities, but it would be harder to get data for smaller centres.

The second question depends on the alternative. It’s pretty clear that if we banned going out  to bars and nightclubs the reported assault rate would fall  — we tried that, in April/May, and had about 25% fewer cases nationwide than in 2019 or 2018, and about 50% in the Courtenay Place/Cuba area. It’s also pretty clear we’re not actually going to tackle assaults with nationwide lockdowns.

If we just cracked down on unlawful behaviour in that area, or reduced the number of places selling alcohol, it’s not clear what would happen. It might be that people drink less and fight less. It might be that they just move the party to some other central area. It might be that they spread out across the city. Or, people might get drunk and fight in the comfort and safety of their own homes and streets — we know that assault and sexual assault in the home are badly under-reported (under-reported to police as well as not being in the public data set).

The right comparison will depend on what individual risk or potential policy change you are trying to evaluate, but it’s not likely to be this one.


* I emailed the NZ Police data address to ask about where the missing assaults were; my request is being actioned pursuant to the Official Information Act**

** Yes, I realise that just answering would count as actioning it pursuant to the Official Information Act, but the email still doesn’t make me expect*** a rapid reply

*** And I need to confess to having completely misjudged the police data people, who got back to me the next morning and were extremely helpful

October 22, 2020

Briefly

October 20, 2020

Super Rugby Unlocked Predictions for Round 3

Team Ratings for Round 3

The basic method is described on my Department home page.
Here are the team ratings prior to this week’s games, along with the ratings at the start of the season.

Current Rating Rating at Season Start Difference
Sharks 3.27 4.01 -0.70
Stormers 0.68 1.00 -0.30
Bulls -2.38 -1.45 -0.90
Lions -3.76 -4.82 1.10
Cheetahs -8.43 -10.00 1.60
Griquas -10.31 -10.00 -0.30
Pumas -10.33 -10.00 -0.30


Performance So Far

So far there have been 6 matches played, 4 of which were correctly predicted, a success rate of 66.7%.
Here are the predictions for last week’s games.

Game Date Score Prediction Correct
1 Cheetahs vs. Bulls Oct 10 19 – 17 -2.30 FALSE
2 Griquas vs. Pumas Oct 11 21 – 27 6.20 FALSE
3 Stormers vs. Lions Oct 11 23 – 17 9.60 TRUE


Predictions for Round 3

Here are the predictions for Round 3. The prediction is my estimated expected points difference with a positive margin being a win to the home team, and a negative margin a win to the away team.

Game Date Winner Prediction
1 Pumas vs. Stormers Oct 23 Stormers -6.50
2 Lions vs. Cheetahs Oct 24 Lions 9.20
3 Bulls vs. Sharks Oct 24 Sharks -1.20