January 24, 2019

Pro14 Predictions for Round 14

Team Ratings for Round 14

The basic method is described on my Department home page.
Here are the team ratings prior to this week’s games, along with the ratings at the start of the season.

Current Rating Rating at Season Start Difference
Leinster 13.09 9.80 3.30
Munster 10.43 8.08 2.40
Glasgow Warriors 7.73 8.55 -0.80
Scarlets 2.87 6.39 -3.50
Connacht 2.57 0.01 2.60
Ospreys 0.87 -0.86 1.70
Cardiff Blues 0.70 0.24 0.50
Edinburgh 0.65 -0.64 1.30
Ulster -0.07 2.07 -2.10
Cheetahs -2.21 -0.83 -1.40
Treviso -3.42 -5.19 1.80
Dragons -8.59 -8.59 0.00
Southern Kings -10.78 -7.91 -2.90
Zebre -13.28 -10.57 -2.70


Performance So Far

So far there have been 90 matches played, 71 of which were correctly predicted, a success rate of 78.9%.
Here are the predictions for last week’s games.

Game Date Score Prediction Correct
1 Southern Kings vs. Cheetahs Jan 20 17 – 24 -3.50 TRUE


Predictions for Round 14

Here are the predictions for Round 14. The prediction is my estimated expected points difference with a positive margin being a win to the home team, and a negative margin a win to the away team.

Game Date Winner Prediction
1 Glasgow Warriors vs. Ospreys Jan 26 Glasgow Warriors 11.40
2 Leinster vs. Scarlets Jan 26 Leinster 14.70
3 Ulster vs. Treviso Jan 26 Ulster 7.80
4 Cheetahs vs. Zebre Jan 27 Cheetahs 15.60
5 Dragons vs. Munster Jan 27 Munster -14.50
6 Southern Kings vs. Edinburgh Jan 27 Edinburgh -6.90
7 Cardiff Blues vs. Connacht Jan 27 Cardiff Blues 2.60


January 23, 2019

Meet Statistics Summer Scholar Xin Qian

Every summer, the Department of Statistics offers scholarships to high-achieving students so they can work with staff on real-world projects. Xin Qian, in the picture, 
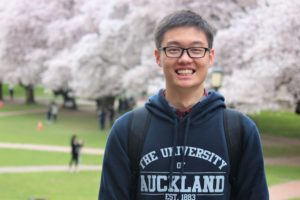
is working with Dr Ben Stevenson, an expert in statistical methods for estimating animal populations.

How can you work out how many creatures inhabit a space when they are elusive, small and have lots of places to hide? Sitting in the bush for months and trying to count what you hear won’t be accurate – and it’s probably not a good use of time.

Another way is to estimate animal abundance is through acoustic surveys, which use microphone arrays to record animal chirps and calls; statistical techniques are then used to estimate the population. This is called spatial capture-recapture (SCR), and at present we have several ways of analysing the data.

That’s where summer student Xin Qian comes in. He is working with SCR expert Dr Ben Stevenson on a simulation project that compares two ways of analysing acoustic data. They are using statistics gathered from surveys of the rare moss frog, which exists only on South Africa’s Cape Peninsula.  

“We want to find out which is the best method for providing an accurate and stable estimation of frog density, factoring in the time each method takes,” says Xin. The existing method, he explains, requires that you go and collect independent data about how often individual frogs chirp in order to estimate animal density, which takes time.

However, the new method, developed by Ben Stevenson’s former MSc student Callum Young, promises to estimate both call rates and therefore animal density from the main survey alone. Says Ben: “This can save time, but may possibly leave you with a less accurate answer. What we are hoping to do is resolve the trade-off. How is the precision of our estimates affected if we switch to the new method? My guess is that it will be worse. Is this sacrifice worth the saving in fieldwork time?”

For this work they are using R, a programming language for statistical computing and graphics developed in the Department of Statistics in the mid-1990s and now used all over the world.

The project is ideal for Xin, a third-year University of Auckland BSc student majoring in Statistics and Information Systems. “It is always interesting to get information from data; it makes me feel like I am having some secret conversation with data that people can’t hear,” he says. “I normally won’t get bored dealing with numbers, and I prefer things having a logic or a reason behind them.”

Xin was born and raised in China, in the small east-coast city of Jiaxing near Shanghai. After finishing secondary school in China, he moved to New Zealand to pursue tertiary studies, starting his degree in 2016.

The University of Auckland appealed to him “because of its good reputation and ranking.” Although education rather than environment drew him to this country, he says that “New Zealand is a beautiful place with splendid natural views, and most people here are nice and welcoming; I have made lots of friends here. I have also became more outgoing and willing to try various outdoor activities that I wouldn’t get a chance to try if staying in my hometown.”  

  • For general information on University of Auckland summer scholarships, click here.


January 22, 2019

Meet Lushi Cai, Statistics summer scholar

Every summer, the Department of Statistics offers scholarships to high-achieving students so they can work with staff on real-world projects. Lushi Cai is working with Professor Chris Wild on iNZight, a free data visualisation and analysis software he developed.

There’s a Chinese saying that goes “Travel ten thousand miles, read ten thousand books.” And that’s just what summer scholar Lushi Cai, in the picture, is doing.

Originally from Guangzhou in southern China, Lushi had done a year of undergraduate study in China before she moved with her family to New Zealand three years ago. She embarked on a Bachelor of Science majoring in computer science and statistics at the University of Auckland, finishing her degree last year. This year, Lushi will be on an honours programme.

As a summer scholar, Lushi is working on the Department of Statistics’ data analysis package, iNZight. This is a free, R-based environment started by statistics education expert Professor Chris Wild to help high-school students quickly and easily explore data and understand some statistical ideas. However, iNZight has grown, and now extends to multivariable graphics, time series, and generalised linear modelling, including modelling of data from complex surveys. It is available in web and desktop versions.

Lushi’s summer scholarship involves implementing interactive web graphs for R- generated statistics plots and enhancing the web version of iNZight by adding an interactive plot function.  “Users tell iNZight what to do and what analysis output they want using iNZight’s gui (graphical user interface),” she explains. “They don’t need to know how to write code.

“However, key modules also provide users with the R code that iNZight used to produce their output. This is great for learning how to do things in R, and it also makes iNZight analyses reproducible by others.”

But improvements are needed, she adds: “Unfortunately, the R code automatically generated by iNZight is not easy for humans to read. So I’m writing an auto-formatter that converts messy R code into tidy R code that’s easy to read.”

Students are a critical part of the development of iNZight, says Chris Wild. “It’s a student-driven project, so most of the big-scale changes occur over the New Zealand summer period. At other times, we mostly work on small changes and bug fixes.”

Lushi enjoys problem-solving, so this sort of project is a natural fit. In addition, “my interest is analysing huge data and producing a direct way, such as tables and graphs, to explore the features. I believe this is a powerful skill and can be applied to every field in the real world”.

  • For general information on University of Auckland summer scholarships, click here.


January 15, 2019

eScooter costs

There’s a story at Stuff saying the ACC have paid out more than $200,000 across 655 e-scooter related injuries.  If you don’t regularly work with ACC data it’s hard to get a feel for whether that’s a lot or not.

Two comparisons I saw on Twitter, and a bonus one

  • From Stuff: in the 2016/7 year, “[s]ome 3517 horse-injury claims added up to $6,867,869”,  a decrease from previous years
  • From the Herald: “The number of injuries involving avocados has increased over the past three years, with the nutritious fruit costing ACC just over $800,000.”
  • From the Herald: “Last year more than 4000 New Zealanders were injured on Christmas Day alone, accounting for $3,628,574 worth of ACC claims.”

First we need to look at time frames: the e-scooter data are over three months; the horse and Christmas data over a year; the avocados over three years. Annualised, we’d have $0.6 million/year for scooters, $3.6 million/year for Christmas, $6.9 million/year for horses, and $0.26 million/year for avocados.   Avocados aren’t in the running, but horses are looking strong.

There are a lot of horses in New Zealand, though. Apparently, over 100,000! They won’t each be ridden with the same frequency as the average Lime e-scooter, but it wouldn’t take that high a usage rate for scooters to be more dangerous than horses.  What we can see, though, is that horse injuries are more severe on average: the headline statistic gave five times as many injuries from horses and over 30 times the cost.   (Avocados look even safer if you count number of injuries rather than cost).

Since e-scooters are new and only cost a few dollars to try, there will be a lot of inexperienced users right now.  You’d assume that over time the typical user will become more experienced and probably more risk-averse, and so the risks should go down a bit. Also, there will probably be an increasing number of people who have their own scooter and are a bit more careful with it.

The obvious comparison, though, isn’t horses or avocados or Christmas: it’s cars.  ACC paid out $264 million for driving-related injuries in 2017-18. Spread out over 3 million cars or 4 million motor vehicles that’s still less than half the cost per vehicle that we’re seeing for e-scooters (assuming most e-scooter use is the Lime rentals). However, the ACC figure doesn’t attempt to count the cost of 378 road deaths last year.  At the Ministry of Transport’s cost-of-life valuation of just over $4 million, that’s another $1.5 billion.

Cars, um, win?


January 14, 2019

Briefly

  • Data definition drift: the impact of interventions to reduce hospital readmissions has been overestimated because of changes in how admissions are coded.  When systems change to allow more than 10 diagnoses to be entered, more than 10 are entered for a lot of people (Twitter thread)
  • Public transport data visualisation, from Twitter.  Sara Weber says (in translation) “My mother is a commuter in the Munich area. And avid knitter. She knitted a “rail delay scarf” in 2018. Two rows per day: Grey at under 5 minutes, pink at 5 to 30 minutes delay, red if delayed on both trips or once over 30 minutes.”
  • Pew Research, whose fault “millennial” is, remind us that they define millennials as born 1981-1996. The youngest millennials are now 22.  (via @drob)
  • Some years ago, there were stories about a young woman who was outed as pregnant by Target’s targeted advertising before she’d decided to tell people.  There’s a new ad for a firm called Zulily that is pushing this as a good thing. (via Amie Stepanovich)
  • There’s a story on Stuff about lead in eggs from backyard chickens.  The story ends with a quote from someone who keeps chickens “you’re breathing in more lead living next to a busy road more than the chickens going to lay in its lifetime.”. That might have been true forty years ago, but it isn’t true now — getting rid of unleaded petrol has resulted in lead air pollution from traffic largely going away.   Lead is the big success story of pollution reduction. Here’s a graph of average lead concentrations in the air across US air pollution monitoring stations (the trend would be similar in NZ)

Reeferendum polling

The Herald reports 60 per cent support for legal cannabis – new poll. There’s going to be a lot of this over the next couple of years, so here are some points to consider

  1. As the Herald says, the poll found a substantially higher number of daily cannabis users than other research: about three times higher than the NZ Drug Use Survey from the Ministry of Health and four or five times higher than a 2010 survey sponsored by NORML.  This has got to reduce our confidence in the results: either because it indicates the sample is unrepresentative or because it indicates that surveys on drugs are intrinsically unreliable.
  2. We don’t know what the question on the referendum will be, so the survey obviously wasn’t asking that question. I hope the actual question will be a choice between a specific proposed set of legislation and the status quo, though the Government will have to move quickly to get the legislation drafted, released for public comment, and revised in time. In any case, you’d expect (as with Brexit) more support for a generic ‘change’ proposal as in this survey than for any concrete and specific proposal.  Some people will support private growing but oppose commercialisation; others will argue that you can only get rid of the illegal market if the legal market is fairly open.  And so on.
  3. The poll results were weighted to agree demographically with the 2013 Census population.  That’s a standard thing to do with surveys, but in this case it would be more useful to weight them to look like the 2017 voting population.  The age groups who support legalisation more strongly are also historically less likely to vote.
January 10, 2019

“Induced demand” meets “One less car”

When peak-hour traffic congestion gets unbearable and new roads are built, there’s an initial reduction in congestion and everyone is happy.  The congestion comes back surprisingly fast — a phenomenon known as induced demand.  Before the new roads were built, people would have been avoiding them at peak times: they might have travelled at non-peak times, or car-pooled, or taken the bus, or gone somewhere closer instead, or just made fewer trips.  With the new space, these people can now drive. That’s good for them: they must benefit from being able to drive or they would still be doing whatever they were doing before.  It’s bad news for people who were already driving in peak traffic; their new lanes are being filled up and they’ve lost most of the benefit of the new road capacity. Car unenthusiasts such as Greater Auckland (and, um, me) love to tell you all about induced demand, but even car enthusiasts will often admit it’s a thing.

On the other hand, Auckland is going through an expansion in bus services, bike paths, and near-city housing.  As more people bus, walk, and cycle, pressure on congested urban streets will decrease, as will carbon emissions from transport.  Every mass transit or active transport user is One Less Car.  Studies of short-term disruptions such as transit strikes confirm that public transport, and probably bikes, really do reduce congestion.

There’s a bit of a contradiction here, though.

If extra space on the roads provided by new construction is quickly filled up by new demand, you’d expect extra space on the roads provided by One Less Car to be filled up in the same way.  Just as the short-term congestion effects of adding or subtracting new road lanes overestimate the long-term congestion effects, the short-term congestion harms of taking away buses for a day would overestimate the long-term congestion benefits they provide.  People adapt.

For example, Seattle, in the US, has made a big effort to increase public transport in recent years, with some success. The proportion of households with fewer than two cars is increasing (in contrast to similar cities).   On the other hand, congestion (as measured by TomTom) and  vehicle miles driven are both slightly up.  The policies have been successful — there are more non-car trips than before and the stable congestion and driving statistics are for an increasing population — but congestion hasn’t decreased.  In Auckland, more people now work in or near the city and many more people get to those jobs without driving. A lot of cars have, in some sense, been taken off the roads, but congestion hasn’t decreased and motorway traffic volumes are stable.

Now, there was a recent research paper from the University of Otago (press release) looking at new cycling and walking paths in New Plymouth and Hastings, which estimated a small but persistent decrease in car use (about 1%).  But these aren’t cities where car use is strongly limited by congestion, so you wouldn’t expect much induced car traffic demand.

Even with induced demand there are real, important, benefits when people use alternatives to cars. The people who switch to bike or bus will benefit (or they wouldn’t do it). The people who weren’t previously driving in peak traffic and who now get to supply the induced demand will benefit.  Some people who would otherwise have been forced out of peak driving will be able to continue, and they, too, will benefit. But people who are in peak-hour traffic anyway don’t really benefit.  To them, it’s not One Less Car. It’s One Different Car.

January 9, 2019

Pro14 Predictions for Round 11 Delayed Match

Team Ratings for Round 11 Delayed Match

The basic method is described on my Department home page.
Here are the team ratings prior to this week’s games, along with the ratings at the start of the season.

Current Rating Rating at Season Start Difference
Leinster 13.09 9.80 3.30
Munster 10.43 8.08 2.40
Glasgow Warriors 7.73 8.55 -0.80
Scarlets 2.87 6.39 -3.50
Connacht 2.57 0.01 2.60
Ospreys 0.87 -0.86 1.70
Cardiff Blues 0.70 0.24 0.50
Edinburgh 0.65 -0.64 1.30
Ulster -0.07 2.07 -2.10
Cheetahs -2.49 -0.83 -1.70
Treviso -3.42 -5.19 1.80
Dragons -8.59 -8.59 0.00
Southern Kings -10.50 -7.91 -2.60
Zebre -13.28 -10.57 -2.70


Performance So Far

So far there have been 89 matches played, 70 of which were correctly predicted, a success rate of 78.7%.
Here are the predictions for last week’s games.

Game Date Score Prediction Correct
1 Ospreys vs. Cardiff Blues Jan 05 20 – 11 3.80 TRUE
2 Treviso vs. Glasgow Warriors Jan 06 20 – 17 -7.60 FALSE
3 Leinster vs. Ulster Jan 06 40 – 7 16.30 TRUE
4 Scarlets vs. Dragons Jan 06 22 – 13 17.30 TRUE
5 Connacht vs. Munster Jan 06 24 – 31 -2.70 TRUE
6 Edinburgh vs. Southern Kings Jan 06 38 – 0 13.90 TRUE
7 Zebre vs. Cheetahs Jan 07 12 – 27 -5.40 TRUE


Predictions for Round 11 Delayed Match

Here are the predictions for Round 11 Delayed Match. The prediction is my estimated expected points difference with a positive margin being a win to the home team, and a negative margin a win to the away team.

Game Date Winner Prediction
1 Southern Kings vs. Cheetahs Jan 20 Cheetahs -3.50


January 3, 2019

Briefly

  • Dumb extrapolation watch:  An opinion piece in the NY Times says that if you gave up your smartphone for a year “you would have time to make love about 16,000 times”.  As various people including Elle Hunt worked out, that’s about 44 times per day. There are also some assumptions in there about priorities — has “sorry dear, I need to check Twitter” really replaced the canonical headache? And assumptions about definitions — “not counting foreplay“.
  • From Justin Falcone on Twitter: Google Trends shows how the spelling of ‘impostor syndrome’ has changed  over the past few years
  • Bad data watch: Katie Langin write“It’s not every day that you realize you’re a data point in a scientific study—and a misrepresented data point at that. But that’s what happened to a number of current and former scientists—including me—while reading a study reporting that scientific careers have become significantly shorter in the past 50 years”
  • Interesting piece in Stuff by Charlie Mitchell: “The ark, the algorithm,  and our conservation conundrum” on how species are prioritised for conservation efforts.  In particular, there’s more acknowledgement than usual that rejecting ‘algorithms’ doesn’t actually make anything better.
  • Chris Knox at Herald Insights has a visualisation of holiday road deaths — in particular, the problem of New Year’s Day morning.

Placebo genes?

From Ars Technica

Some psychologists at Stanford wondered if the perception of genetic risk could actually increase people’s risk, independent of their actual genetic risk. In other words, could simply learning that you have a genetic propensity for something elicit physiological changes akin to really having that propensity, regardless of whether you have it? The team designed experiments to find out.

That is, they were looking for a placebo effect of genetic information.  It’s not a ridiculous idea that there could be one. The placebo effect is a real phenomenon (at least in some settings) and there’s no obvious reason why it should work with pills and injections but not genetic information.  And I’m in favour of the principle that giving people health information (that they didn’t ask for) is an intervention that should be evaluated like any other. However, I’m not entirely convinced.

There were two experiments. One saw that people told they had a bad-at-exercise gene variant were worse at exercise.  The other saw that people told they had a staying-hungry gene variant stayed more hungry after drinking a nutrition shake. What the story (and the research paper) makes a lot of, though, is that physiological measurements changed too. It wasn’t all in the participants’ minds (or even all in their brains).

One issue is that the evidence isn’t all that strong (especially given the publication filtering it takes to get into the media) — even though the observed differences were surprisingly large. That makes it likely more that chance contributed to the results. Also, to the extent we’re seeing random variation in exercise or in hungriness we’d expect to see the same variation in biochemical measurements. If the explanation isn’t a placebo effect, the physiological differences are exactly what you’d expect.

It’s also worth noting that the biochemical difference seen in the hunger experiment (in something called glucagon-like-peptide-1) isn’t one of the differences that have been reported for the gene in question (at least in the references given). The researchers looked for a biochemical difference that had been seen for the gene (in ghrelin), and didn’t see it.  It would have been interesting to see whether information about the hunger-related gene affected exercise capacity — if there’s something there, is it somewhat specific or is it general to being told ‘bad genes’?

Even without necessarily believing the specific conclusions of the research, though, it’s another reminder that the evidence for health benefits of most sorts of genetic information is surprisingly weak.