Bus commuter services can be very useful in reducing traffic and parking congestion in the city center, but reducing the average number of cars per household requires buses that are available all the time. I used the Auckland Transport bus schedule data and the new StatsNZ meshblock data and boundary files
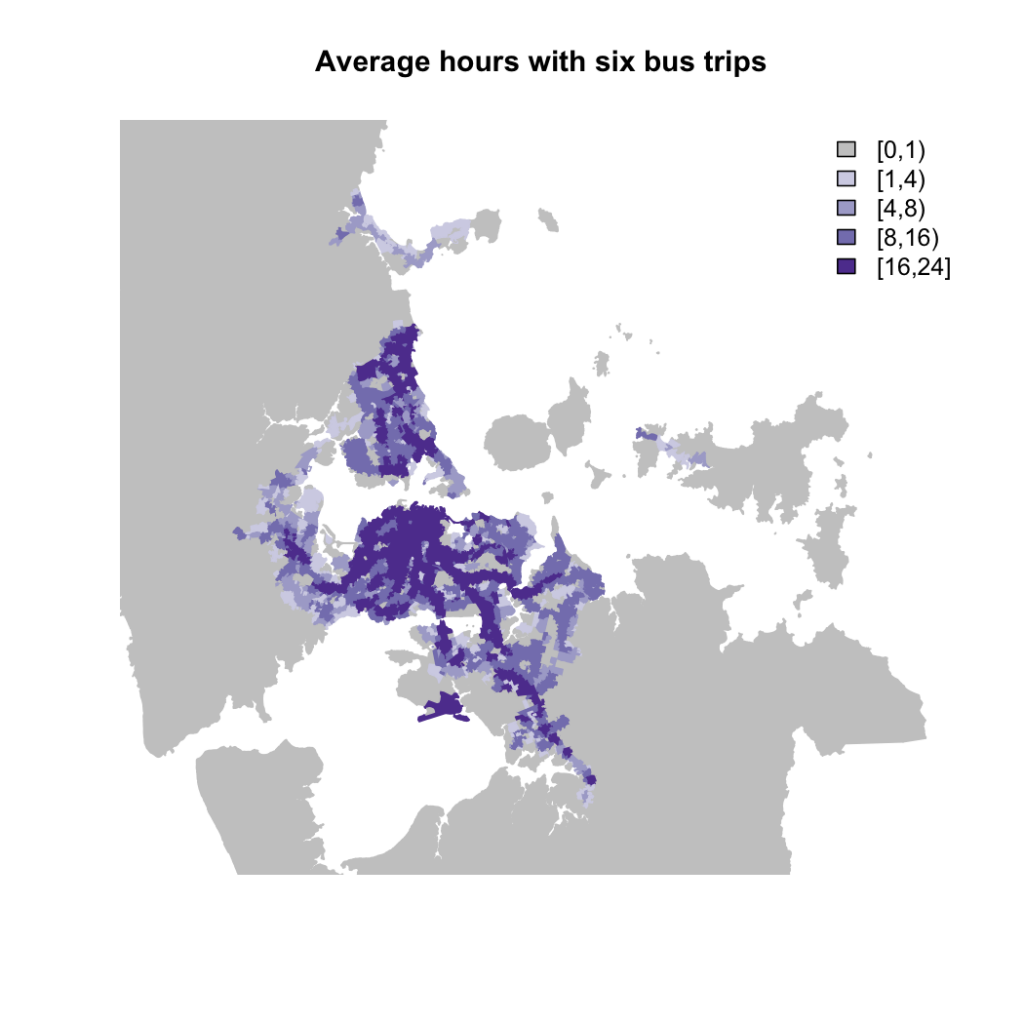
Here’s a map of Auckland showing how many hours per day (on average) there are at least six bus trips per hour stopping within 500m of each meshblock (actually, within 500m of the ‘label point’ for the meshblock).
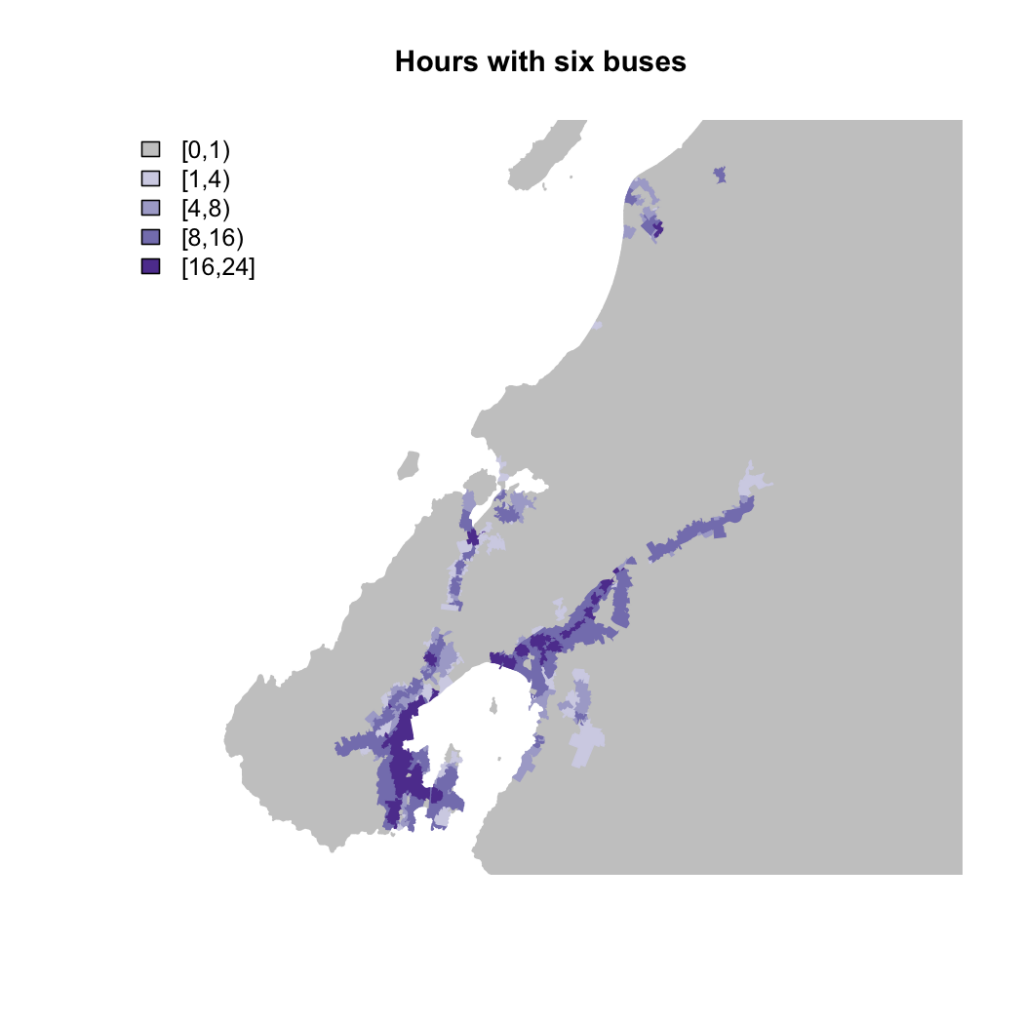
On a single road, six trips per hour is one trip in each direction every twenty minutes. The dark purple area has this level of service at least 16 hours a day on average. (Click for the honking great PDF version.)
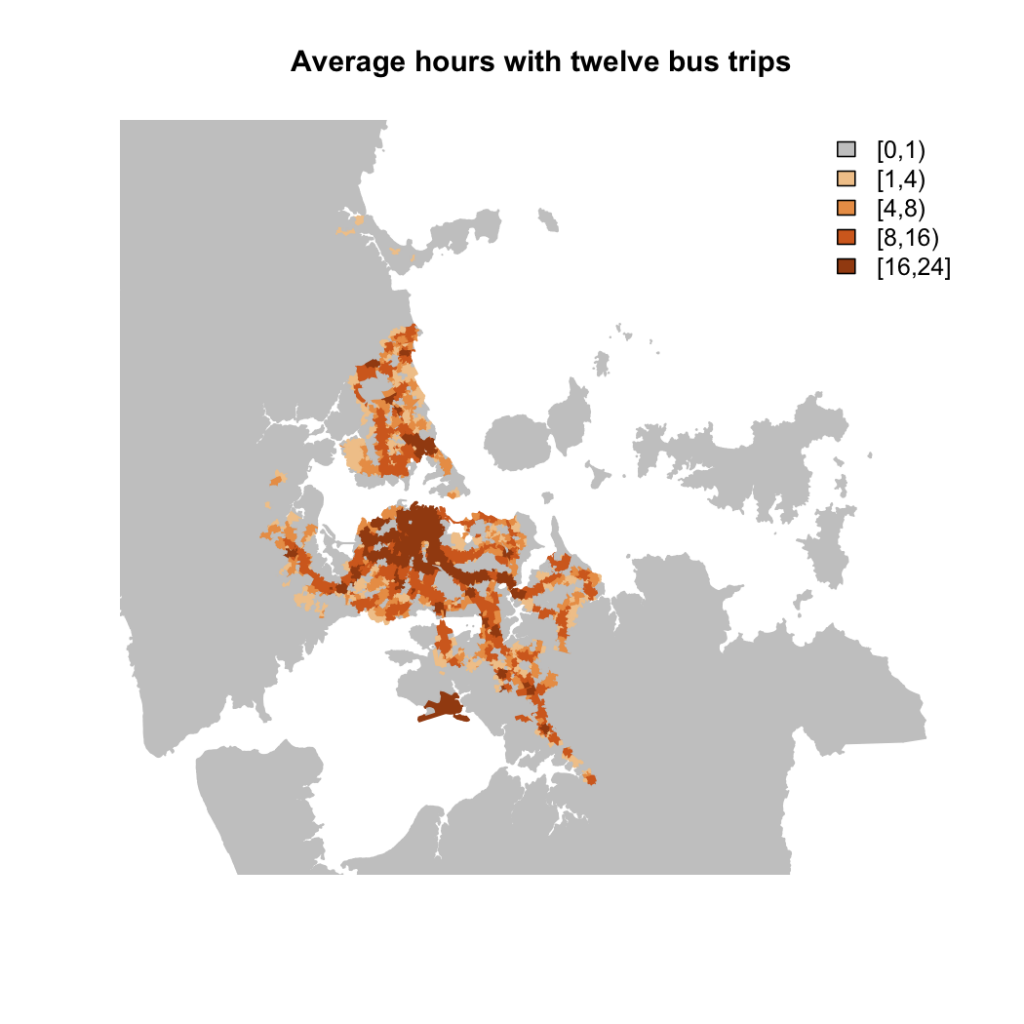
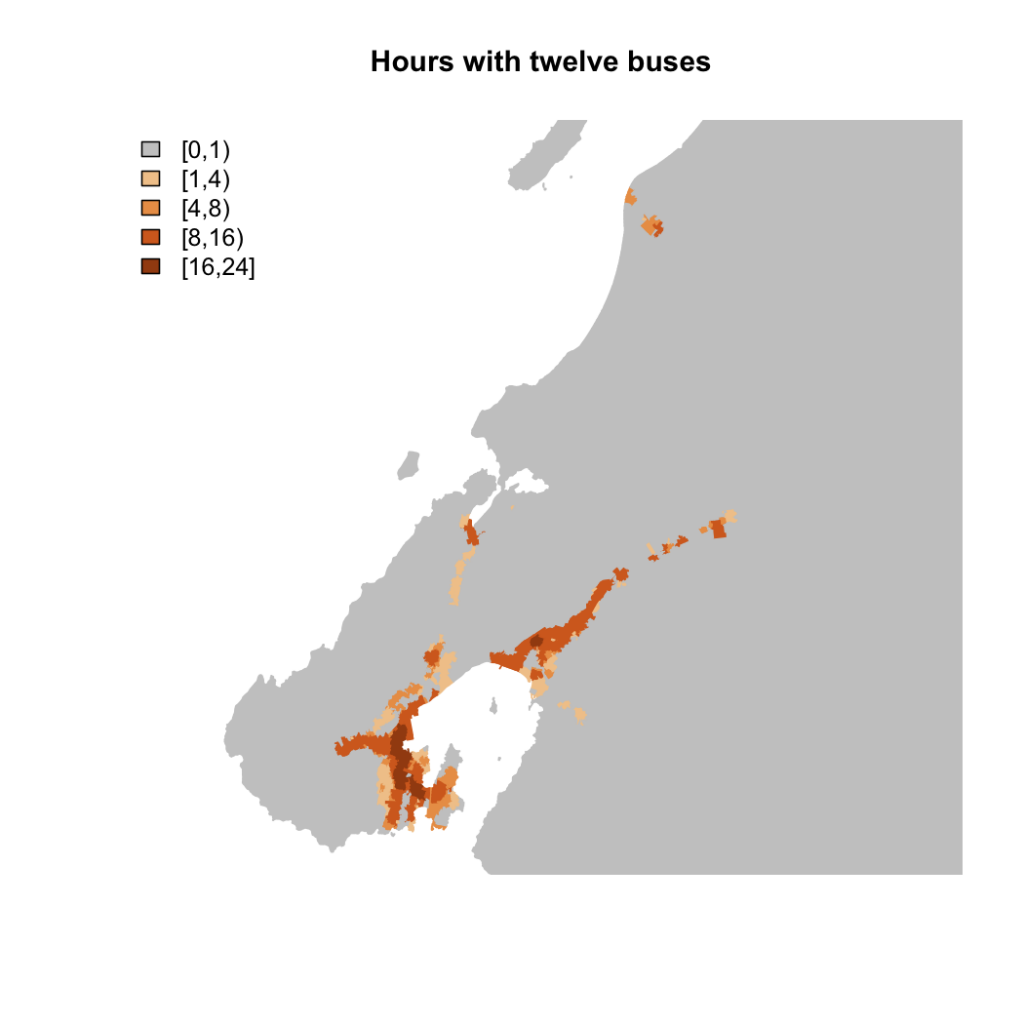
For twelve trips per hour (eg, one every twenty minutes on two different routes) the area shrinks a lot
The reason for using meshblocks in the map is that we can merge the bus files with the census files. For example, for Auckland as a whole, 50% of the population is in the grey busless emptiness, 17% in the 8-16 hour tolerable zone, and 12% in the pretty reasonable 16+ hour zone. People of Maori descent are more likely to be unbused (60%) and less likely to be well bused (8%), as are people over 65 (60% in the lowest category, 9% in the highest).
Recent (<10 years) migrants like transit: 18% of us are in the good bus category and only 40% in the busless category.

Recent comments