Posts filed under Careers (39)

May 28, 2013

Analytics is beating statistics

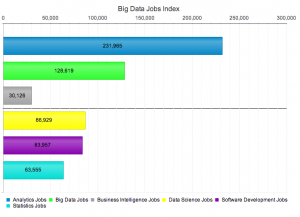
icrunchdata, which is a data-related jobs site, has introduced what it is calling the Big Data Jobs Index

crunchy


If you believe the numbers, it looks as though analytics is way ahead in the synonym game, followed by data science, but at least statistics is still ahead of business intelligence. And at least this is a bar chart, though not an index in any usual sense of the term.

The company describes Big Data as having ‘fueled one of the most hyper-growth niches of employment in a century’, but since their projection is for the sector to grow to nearly 1% of the US job market by 2015, we clearly need to be careful of the definition of fast growth

May 17, 2013

How do you get a career in statistics?

This is a common question from our students. Unfortunately our perspective does not always lend itself easily to life outside of research and academia, as what I look for in a curriculum vitae and in a job interview is usually with respect to hiring someone who will become an academic staff member. However, fellow statistician, and the Young Statisticians representative for the New Zealand Statistical Association executive committee, Kylie Maxwell has posted her own experience as part of the International Year of Statistics.


May 16, 2013

Future of applied statistics

Rafa Irizarry at Simply Statistics has a longish piece on the future of applied statistics:

Despite having expertise only in music, and a thesis that required a CD player to hear the data, fitted models and residuals , I was hired by the Department of Biostatistics at Johns Hopkins School of Public Health. Later I realized what was probably obvious to the School’s leadership: that regardless of the subject matter of my thesis, my time series expertise could be applied to several public health applications. The public health and biomedical challenges surrounding me were simply too hard to resist and my new department knew this. It was inevitable that I would quickly turn into an applied Biostatistician.

It makes a nice change from the people worrying that computer science will beat us up and steal our lunch.

April 27, 2013

New science journalists

Three journalists who have just finished internships in science journalism with NPR news in Washington, DC. Might be useful to follow in the future:


April 25, 2013

Infographic of the week

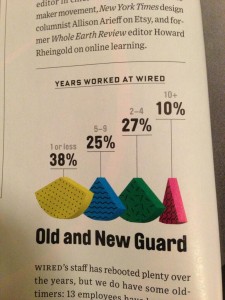
Every so often, someone comes up with a creative way to make pie charts less informative.  This week’s innovation comes to you from Wired magazine.

explodedpie

Note that it’s structured like a bar chart, except that all the `bars’ are the same height, and the wedges are turned at different angles, to make the widths harder to estimate.  The numbers are presented as if their heights mean something, but actually not.

There are also some subtleties to the design.  For example, at first glance you might think the left-to-right order of the wedges reflects the time period each one corresponds to, so that the fact they aren’t largest to smallest means something. Sadly, no.

(via @acfrazee and @kwbroman)

April 8, 2013

Briefly

  • Interesting post on how extreme income inequality is. The distribution is compared to a specific probability model, a ‘power law’, with the distribution of earthquake sizes given as another example. Unfortunately, although the ‘long tail’ point is valid, the ‘power law’ explanation is more dubious.   Earthquake sizes and wealth are two of the large number of empirical examples studied by Aaron Clauset, Cosma Shalizi, and Mark Newman, who find the power law completely fails to fit the distribution of wealth, and is not all that persuasive for earthquake sizes. As Cosma writes

If you use sensible, heavy-tailed alternative distributions, like the log-normal or the Weibull (stretched exponential), you will find that it is often very, very hard to rule them out. In the two dozen data sets we looked at, all chosen because people had claimed they followed power laws, the log-normal’s fit was almost always competitive with the power law, usually insignificantly better and sometimes substantially better. (To repeat a joke: Gauss is not mocked.)


April 1, 2013

Briefly

Despite the date, this is not in any way an April Fools post

  • “Data is not killing creativity, it’s just changing how we tell stories”, from Techcrunch
  • Turning free-form text into journalism: Jacob Harris writes about an investigation into food recalls (nested HTML tables are not an open data format either)
  • Green labels look healthier than red labels, from the Washington Post. When I see this sort of research I imagine the marketing experts thinking “how cute, they figured that one out after only four years”
  • Frances Woolley debunks the recent stories about how Facebook likes reveal your sexual orientation (with comments from me).  It’s amazing how little you get from the quoted 88% accuracy, even if you pretend the input data are meaningful.  There are some measures of accuracy that you shouldn’t be allowed to use in press releases.
March 27, 2013

Does data visualisation matter?

“I wish there were more examples where data viz actually mattered. The case studies for us to lean on are sparser than they should be.”

Amanda Cox, NY Times chartmaker, interviewed at Harvard Business Review.  Includes a graph showing how the same unemployment report might be viewed by partisans of opposing parties.

March 17, 2013

Briefly

  • When data gets more important, there’s more incentive to fudge it.  From the Telegraph: ” senior NHS managers and hospital trusts will be held criminally liable if they manipulate figures on waiting times or death rates.”
  • A new registry for people with rare genetic diseases, emphasizing the ability to customise what information is revealed and to whom.
  • Wall St Journal piece on Big Data. Some concrete examples, not just the usual buzzwords
  • Interesting visualisations from RevDanCat
January 23, 2013

Biologists want more statistics

An article in Nature (not free access, unfortunately) by Australian molecular biologist David L. Vaux

 “Experimental biologists, their reviewers and their publishers must grasp basic statistics, or sloppy science will continue to grow.”

This doesn’t come as a surprise to statisticians, but it is nice to get the support from the biology side.  His recommendations are also familiar and welcome

How can the understanding and use of elementary statistics be improved? Young researchers need to be taught the practicalities of using statistics at the point at which they obtain the results of their very first experiments.

[Journals] should refuse to publish papers that contain fundamental errors, and readily publish corrections for published papers that fall short. This requires engaging reviewers who are statistically literate and editors who can verify the process. Numerical data should be made available either as part of the paper or as linked, computer-interpretable files so that readers can perform or confirm statistical analyses themselves.

Professor Vaux goes on to say

When William Strunk Jr, a professor of English, was faced with a flood of errors in spelling, grammar and English usage, he wrote a short, practical guide that became The Elements of Style(also known as Strunk and White). Perhaps experimental biologists need a similar booklet on statistics.

And here I have to quibble. Experimental biologists already have too many guides like Strunk & White, full of outdated prejudices and policies that the authors themselves would not follow.  What we need is a guide that lays out how good scientists and statisticians actually do handle common types of experiment (ie, evidence-based standard recipes), together with some education on the basic principles: contrasts, blocking, randomization, sources of variation, descriptions of uncertainty. And perhaps a few entertaining horror stories of Doing It Rong and the consequences.