Posts filed under Education (86)

December 5, 2013

Anybody for a slice of PISA?

There has been significant coverage in the press of New Zealand’s slip in the OECD PISA (Programme for International Student Assessment) rankings for mathematics, reading, and science.
We probably should be concerned.

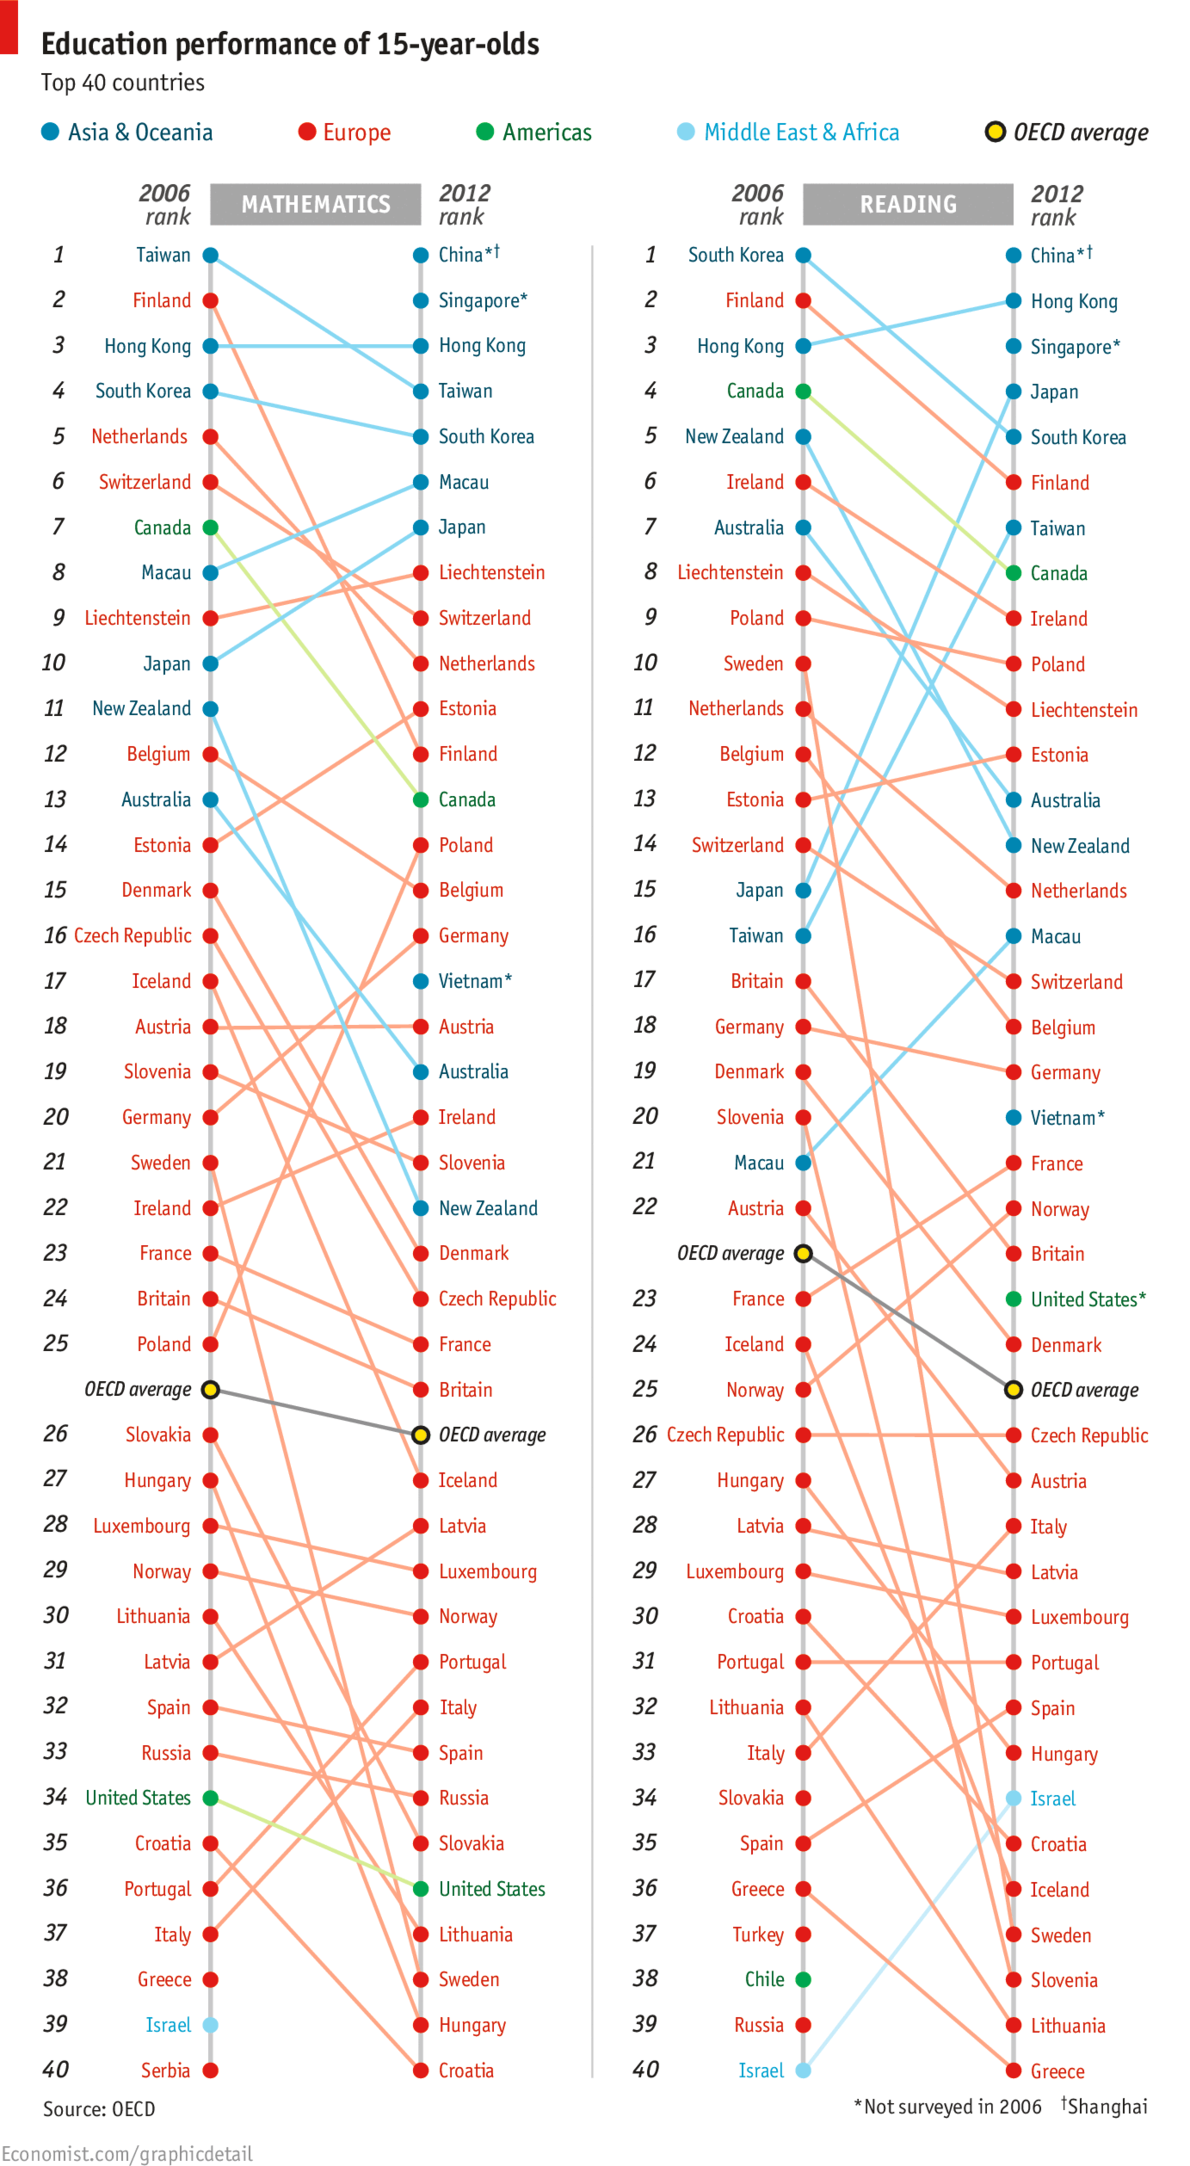
However, today I stumbled across the following chart: OECD PISA Rankings 2006 and 2012 in The Economist. Two things about it struck me. Firstly, part of the change (in the mathematics ranking at least) was driven by the addition of three countries/cities which did not participate in the 2006 round: Shanghai, Singapore, and Vietnam. The insertion of these countries is not enough to explain away New Zealand’s apparent drop, but it does move us from a change of down 11 places to a change of down 8 places. Secondly, I found it really hard to see what was going on in this graph. The colour coding does not help, because it reflects geographic location and the data is not grouped on this variable. Most of the emphasis is probably initially on the current ranking which one can easily see by just reading the right-hand ranked list from The Economist’s graphic. However, relative change is less easily discerned. It seems sensible, to me at least, to have a nice graphic that shows the changes as well. So here it is, again just for the mathematics ranking: Changes in PISA rankings for mathematics.
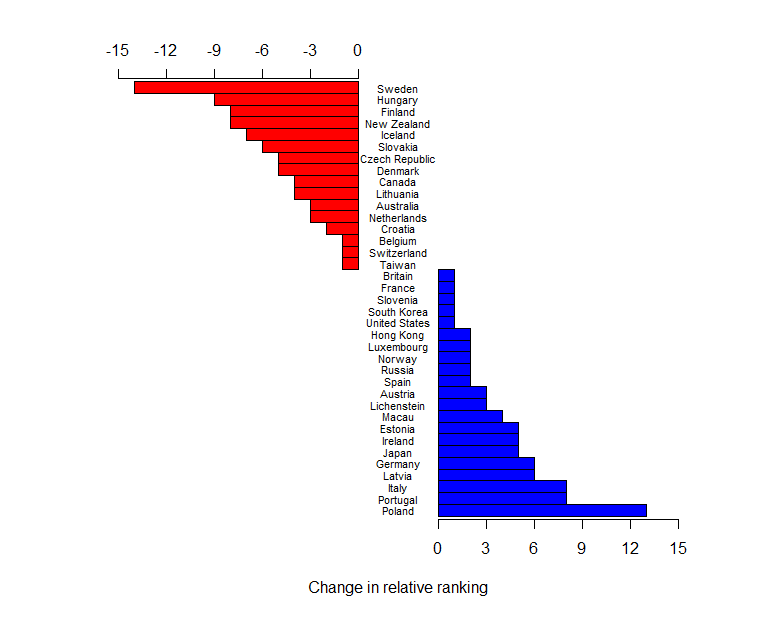
The raw data (entered by me from the graph) has been re-ranked omitting Greece, Israel, and Serbia who did not participate in 2012, and China, Singapore, and Vietnam, who did not participate in 2006. I am happy to supply the R script to anyone who wants to change the spacing – I have run out of interest.

It is also worth noting that these rankings are done on mean scores of samples of pupils. PISA’s own reports have groups of populations that cannot be declared statistically significantly different (if you like to believe in such tests). This may also change the rankings.

Updates:

Professor Neville Davies, Director of the Royal Statistical Society’s Centre for Statistical Education, and Elliot Lawes, kindly sent me the following links:

Firstly a blog article from the ever-thoughtful Professor David Spiegelhalter: The problems with PISA statistical methods

and secondly, a couple of articles from the Listener, which I believe Julie Middleton has also mentioned in the comments:
Education rankings “flawed” by Catherine Woulfe” and Q&A with Andreas Schieicher also by Catherine Woulfe.
November 20, 2013

What do statisticians do all day?

The annual posting of our second-semester MSc and Honours project topics, which were handed in this week.

  • Modelling paua (abalone) growth and investigating seasonal patterns of growth in relation to temperature and genetic family
  • Investigating spatial and temporal patterns in trawl survey time series
  • Identification of spatial and temporal patterns in, and the factors affecting New Zealand fishery catch composition
  • Are newspaper health stories reproducible?
  • Evaluating computer generated designs
  • Model selection methods for supersaturated designs
  • Bayesian Estimation of Undetectable Reverberation Lags
  • Interactive web graphics using widgets and gridSVG
  • Producing HTML Tables with the xtable Package
  • Software for Time Series of Counts
  • Prediction of Super 15 and NRL games
  • Optimal portfolio rebalancing strategies
  • Creating synthetic census datasets using multiple imputation
  • Sustainable Spending in retirement
  • Predictors of on-road particle concentrations
  • Geographic and other sources of variation in the normal range of echocardiographic measurement of the heart
  • Modelling air quality extremes
  • Confidence Regions for Categorical Data
  • Clustering Populations using short tandem repeats
  • Are invariant sites really necessary in phylogenetic inference?
  • Working Likelihood Test
  • Meta analysis of smoking cessation trials
  • Searching for significant differential rules
  • On the use of sequentially normalized maximum likelihood for selecting the order of autoregressions when the model parameters are estimated by forgetting factor least-squares algorithms
  • Connections between the coalescent and birth-death sampling processes
October 11, 2013

An visitor’s view of our school stats curriculum

Neville Davies, from the Royal Statistical Society Centre for Statistical Education, Plymouth University, UK, is visiting the Department of Statistics at The University of Auckland, the home of statschat.  I asked him to share his first impressions … 

Does New Zealand have one of the most innovative school statistics curriculums in the world? Yes! But how does it compare with the UK?

Well, in the UK for the last 50 years the school statistics curriculum has been hijacked by policymakers and maths teachers who believe the subject is a subset of maths and should be taught as such. And there is research evidence to support this.

This attitude has stifled curriculum development for statistics and helped to make the subject disliked by many school-aged learners. And many schoolteachers dislike teaching it too – it’s a bit of a nuisance that gets in the way of the maths.

But things are much better in New Zealand: here the school curriculum is data-driven throughout and is taught, learned and assessed accordingly. And that’s how it should be.

Everyone should have noticed that we are awash with data: bombarded with the stuff. As more and more people try to make sense of these mountains of data, very often information gleaned from them are at best untrustworthy and often misleading and wrong. It is a matter of common sense that young people should be taught to be confident with what to do about data they see in everyday life, as well as being sceptical about what others claim about them.

The best way to teach the skills necessary is precisely what the New Zealand school curriculum specifies.

By talking to the developers of the curriculum in New Zealand, visiting schools, talking to teachers, attending classes and chatting to students I am discovering how the statistics part of the mathematics and statistics curriculum is being implemented in refreshing and innovative ways. To coin a phrase used in New Zealand school statistics resources,  I am being a ‘data and information detective’  and I will take back to the UK lessons we can learn to try to change what is going in that distant land. It’s a case of grandmother needing to learn new ways to suck statistical eggs!

Watch this space for updates.


October 9, 2013

Bell curves, bunnies, and dragons

Keith Ng points me to something that’s a bit more technical than we usually cover here on StatsChat, but it was in the New York Times, and it does have  redeeming levels of cutesiness: an animation of the central limit theorem using bunnies and dragons

The point made by the video is that the Normal distribution, or ‘bell curve’, is a good approximation to the distribution of averages even when it is a very poor approximation to the distribution of individual measurements.  Averaging knocks all the corners off a distribution, until what is left can be described just by its mean and spread.  (more…)

September 27, 2013

Nuclear warming?

From the Guardian, some time ago

Jeremy Clarkson had a point – and that’s not something you hear me say every day (indeed, any day) – when in a recent Sun column he challenged the scientists […] who had described a slab of ice that had broken away from Antarctica as “the size of Luxembourg”.

“I’m sorry but Luxembourg is meaningless,” said Clarkson, pointing out that the standard units of measurement in the UK are double-decker London buses, football pitches and Wales. He could have added the Isle of Wight, Olympic-sized swimming pools and Wembley stadiums to the list.

These journalist units of measurements are useful only to the extent that they are more familiar and easily understood than the actual numbers.

From The Conversation, more recently, David Holmes begins

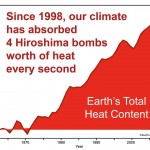
The planet is building up heat at the equivalent of four Hiroshima bombs worth of energy every second. And 90% of that heat is going into the oceans.

This image comes originally from John Cook, who writes

bomb

So I suggest a sticky way to communicate global warming is to express it in units of Hiroshima bombs worth of heat. This ticks all the sticky boxes:

  • It’s simple – nothing communicates a lot of heat like an A-bomb.
  • It’s unexpected – whenever I explain this to audiences, their eyes turn into saucers. Almost noone realises just how much heat our climate system is accumulating.
  • It’s concrete – nobody has trouble conceptualising an A-bomb. Well, much of the younger generation don’t know about Hiroshima – when I test-drived this metaphor on my teenage daughter, she asked “what’s Hiroshima?”. But it’s easily recommunicated as an atomic bomb.
  • It tells a story – the idea that second after second, day after day, the greenhouse effect continues to blaze away and our planet continues to build up heat.
  • The only downside of this metaphor is it is emotional – the Hiroshima bomb does come with a lot of baggage. However, this metaphor isn’t used because it’s scary – it’s simply about communicating the sheer amount of heat that our climate is accumulating. I’ve yet to encounter a stickier way of communicating the scale of the planet’s energy imbalance.

I think he’s wrong about the  downside.  The real downside is that the image of Hiroshima has nothing to do with heat production.  The Hiroshima bomb was important because it killed lots of people, many of them civilians, ended the war, and ushered in the age of nuclear weapons where a small number of military or political leaders had the ability to destroy industrial civilisation and kill the majority of our species (which nearly happened, 30 years ago today).

If we set off four Hiroshima-scale bombs per second, global warming would become a relatively unimportant side issue — and in fact, nuclear weapons are much more widely associated with nuclear winter.

You could also invoke public health concerns and describe the heat accumulation as equivalent to everyone in the world smoking seven cigarettes per second (1185 cal/cig: data). That would be wrong in the same ways.

Displaying uncertainty

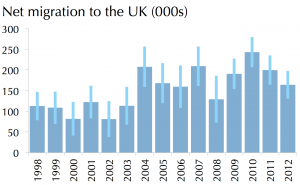
Currently making the rounds of the Internet, a barchart that animates to show uncertainty, from Oliver Hawkins. The basic data are on immigration to the UK, and a traditional way to show the uncertainty (if you were going to both) would be with error bars. Click on the image to go to the animated version.

uncertainty-bar


Those of you who are NZ high-school teachers or students may recognise this idea from Chris Wild’s Visual Inference Tools

September 19, 2013

Briefly

  • An interactive graphic showing variation as well as trends in unemployment in the US. From eager eyes
  • Some people just can’t do simple mathematical computations, but  for those that can, they can easily be distracted by political bias. Grist describes a nice experiment by psychologist Dan Kahan and colleagues
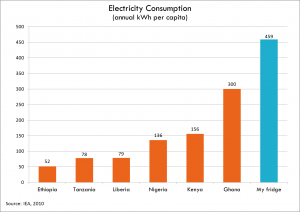
  • Your refrigerator uses more power than many people in AfricaElectricity-consumption-Todd-Moss
September 13, 2013

Briefly

From this morning’s Twitter feed

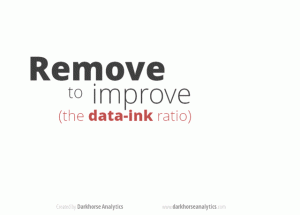
  • An animated GIF (click on it to wake it up) showing how to improve a barchart by removing junk. [from Darkhorse Analytics: Data looks better naked]

data-ink


  • Data journalism: how the data sausage gets made.  Jacob Harris describes how he collected and summarised data on meat recalls in the US
  • The Royal Statistical Society has repeated the simple maths test they gave politicians last year, this time for senior professionals and managers. Less than half of them could give the probability of getting two heads from tossing two coins.
  • However, the same Royal Statistical Society news item ends “The figures have been weighted and are representative of all GB adults (aged 18+)”. This seems to me to fall in the “not even wrong” category. The target group aren’t remotely representative of all British adults, and I’d be surprised if it was even possible to reweight them to the national age distribution.
  • Cathy O’Neill (mathbabe.org) asks why rankings of eg, cars or universities don’t allow the user to change priorities for different attributes (as the OECD Better Life Index does, for example)
September 11, 2013

New Zealand women in public life, by the numbers


Statistics New Zealand is marking 120 years of women’s suffrage with a nice little infograph (click to enlarge).


The graphics are a recent development, and long may they continue (and that the print media and teachers make the most of them). The last SNZ graphic I saw marked the birth of a certain baby called George, and looked at a range of facts and figures to do with child-rearing in New Zealand.


June 27, 2013

Hand-washing study awash in misunderstanding …


The New York Times has reported on a study in which observers sat discreetly in bathrooms and observed whether people “properly” washed their hands (I reckon it would be quite hard to sit discreetly in a bathroom unless you’re in a cubicle). Anyway, the description of the study gave careful attention to the stats: 10.3% of women and over 15 percent of men didn’t wash at all. Of those who did wash, 22.8% did not use soap. And only 5.8% washed for more than 15 seconds.

The lead author said, “Forty-eight million people a year get sick from contaminated food, and the (American) Centre for Communicable Diseases says 50% would not have gotten sick if people had washed their hands properly. Do as your mum said: Wash your hands.”

Surely there’s some basic confusion over percentages here: 50% of those who got sick wouldn’t have if everyone had washed their hands properly, but we have no idea what percentage of those who don’t wash actually get sick.

As a matter of fact, there is no indication that these particular non-handwashers have anything to do at all with the fact that people eat contaminated food. Does it matter what bathroom activity was being carried out? Whether you use toilet paper or your foot to flush? Whether you work in food services? Whether you subsequently wash your hands before eating dinner?

Though mum may have had good advice, this sort of scare-mongering about food-borne illnesses resulting from not washing one’s hands may actually distract us from the real concerns over germs.

  • Read the full analysis by Rebecca Goldin, here. She is Director of Research for STATS, an American non-profit, non-partisan service that  helps journalists think quantitatively through providing education, workshops and direct assistance with data analysis.