Posts filed under General (3152)

April 5, 2017

Briefly

  • If someone told me a longstanding problem in mathematical statistics had been solved, but then admitted the proof was short, used fairly elementary techniques, was written with Microsoft Word, and was published in the Far East Journal of Theoretical Statistics, I might not be in a hurry to look it up.  These are all genuinely reasonable filters for mathematical papers that are worth putting effort into. But, in this case, they were all false positives. Quanta Magazine has the story.
  • From The Conversation,”The seven deadly sins of statistical misinterpretation, and how to avoid them“.
  • From Newsroom (who seem to be quite good so far) Interaction of recreational genotyping and health insurance in NZ
  • From The Conversation, how website terms of use (and their potential criminal enforcement in the US) affect research into fairness and transparency of algorithms.
  • Good Herald interview on air pollution with NIWA scientist Elizabeth Somervell
April 4, 2017

Attack of the killer margarine: the reboot

In 2015, the Herald had a story from the Daily Telegraph on the alleged risks of margarine:

Saturated fat found in butter, meat or cream is unlikely to kill you, but margarine just might, new research suggests.

Traditionally people have been advised to reduce animal fats, but the biggest ever study has shown they do not increase the risk of stroke, heart disease or diabetes. However, trans fats, found in processed foods such as margarine, raise the risk of death by 34 per cent in less than a decade.

“For years everyone has been advised to cut out fats,” said study lead author Doctor Russell de Souza, an assistant professor in the Department of Clinical Epidemiology and Biostatistics, at McMaster University in Canada.

It’s a bit unclear exactly what “raise the risk of death by 34 per cent in less than a decade” is supposed to mean, but we’ll get to that. The research paper was in the BMJ, and came out on the same day the story did.

Today, in 2017, the Herald had a story from the Daily Telegraph on the alleged risks of margarine:

Saturated fat found in butter, meat or cream is unlikely to kill you, but margarine just might, new research suggests.

Although traditionally dieticians have advised people to cut down on animal fats, the biggest ever study has shown that it does not increase the risk of stroke, heart disease or diabetes.

However trans-fats, found in processed foods like margarine raises the risk of death by 34 per cent.

“For years everyone has been advised to cut out fats,” said study lead author Doctor Russell de Souza, an assistant professor in the Department of Clinical Epidemiology and Biostatistics, at McMaster University in Canada.

It’s a bit unclear exactly what “raise the risk of death by 34 per cent in less than a decade” is supposed to mean, but we’ll get to that. The research paper was in the BMJ, and came out nearly two years before the story did.

Yes, it really seems to be the same ‘new reasearch’: Dr de Souza hasn’t just published another meta-analysis. It even seems to be the same Telegraph story; I couldn’t find a new one.

So, how scared should we be of trans fats in our diets?  Food Standards Australia New Zealand say

Monitoring of TFAs in the Australian and New Zealand food supply has found that Australians obtain on average 0.5 per cent of their daily energy intake from TFAs and New Zealanders on average 0.6 per cent. This is well below the WHO recommendation of no more than 1 per cent.

They also say that the majority of that 0.6% is made by bacteria in the rumens of cows and sheep, not by industrial hydrogenation; the evidence of harm is weaker for these natural trans fats.

Now, back to the 34% statistic. This is based on two studies. One compared the 20% of people with the highest and lowest trans fat intakes and found a rate ratio of 1.24. The other, smaller, one estimated the ratio as 1.71 between the highest and lowest 25%.   These are rate ratios estimated from people in their 60. Since the actual probability of death in any given year would have been about 1% the absolute risk increase is smaller than “34% in less than a decade” sounds — but not at all trivial.  For comparison, the all-cause mortality rate ratio for current smoking is about 3.0, or 200% higher than non-smokers.

More importantly, though, we’re talking about a lot of trans fat in these studies. In the larger study with the less-scary rate ratio, people in the lowest 20% of trans fat intake got an average of 1.6% of their calories from it. That is, the lowest-risk group were eating three times as much trans fat as an average Kiwi today.  In the smaller study, they don’t give actual trans fat information for the groups they are comparing, but the average for the whole study was about 9% of fat in the blood was trans fat: if that even roughly translates to proportions of dietary fat they were also getting more than the typical Kiwi today.

There just isn’t that much trans fat in most margarine any more, less than 1% on average (according to Food Standards Oz/NZ, table 2) . There used to be a lot, but then we found out it’s bad for you.  Those scary numbers are actually good news if they’re true: they’d measure how much better off margarine consumers are today than twenty years ago.

(via Mark Hanna)
How big is that (2)

In yesterday’s Official StatsChat Bogus Poll, about two-thirds of the respondents got one of the reasonable answers.

Here’s how we could work out most of the answer without looking it up.

First, a hectare is 10,000 square meters, or 2.5 acres (you might need to look that up).

Now, a ‘full section’ for a house is typically less than 1000 square meters (a quarter acre), so you get 10-20 of them per hectare, and maybe 100,000 of them in 7000 ha.  That’s definitely bigger than Eden Park, and it’s pretty clearly bigger than One Tree Hill Domain + Cornwall Park.  In the other direction, 100,000 full sections must be smaller than the Auckland isthmus, and so (look at a map) smaller than Manukau Harbour.

The comparison to Epsom electorate is a little harder, and you might need actual data to decide.

Now, actual data:

The areas are

Eden Park:  originally `about 15 acres’, or 6 ha

One Tree Hill Domain + Cornwall Park: 270 ha

Epsom: 20 sq km, so 2,000 ha

Manukau Harbour: 394 sq km, or 39,400 ha.

Waikato Region: 2.5 million ha.

If you look up the area of  the Auckland isthmus for comparison with Manukau Harbour, you’ll probably get a figure of 638 sq km. That’s the area of the old Auckland City: it includes the Gulf Islands that were part of the city (in particular, Great Barrier and Waiheke make up more than half of it). It’s surprisingly hard to find the area of the isthmus itself on the internet.

Super 18 Predictions for Round 7

Team Ratings for Round 7

The basic method is described on my Department home page.

Here are the team ratings prior to this week’s games, along with the ratings at the start of the season.

Current Rating Rating at Season Start Difference
Hurricanes 17.51 13.22 4.30
Chiefs 10.80 9.75 1.00
Crusaders 9.42 8.75 0.70
Highlanders 8.55 9.17 -0.60
Lions 7.10 7.64 -0.50
Stormers 4.09 1.51 2.60
Brumbies 3.71 3.83 -0.10
Blues 1.70 -1.07 2.80
Sharks 1.16 0.42 0.70
Waratahs 0.59 5.81 -5.20
Jaguares -1.58 -4.36 2.80
Bulls -2.38 0.29 -2.70
Force -8.24 -9.45 1.20
Reds -9.59 -10.28 0.70
Cheetahs -10.03 -7.36 -2.70
Rebels -12.72 -8.17 -4.60
Kings -17.75 -19.02 1.30
Sunwolves -19.45 -17.76 -1.70


Performance So Far

So far there have been 49 matches played, 39 of which were correctly predicted, a success rate of 79.6%.
Here are the predictions for last week’s games.

Game Date Score Prediction Correct
1 Highlanders vs. Rebels Mar 31 51 – 12 23.40 TRUE
2 Blues vs. Force Apr 01 24 – 15 14.60 TRUE
3 Chiefs vs. Bulls Apr 01 28 – 12 17.30 TRUE
4 Reds vs. Hurricanes Apr 01 15 – 34 -23.70 TRUE
5 Stormers vs. Cheetahs Apr 01 53 – 10 14.20 TRUE
6 Lions vs. Sharks Apr 01 34 – 29 10.10 TRUE
7 Waratahs vs. Crusaders Apr 02 22 – 41 -2.90 TRUE


Predictions for Round 7

Here are the predictions for Round 7. The prediction is my estimated expected points difference with a positive margin being a win to the home team, and a negative margin a win to the away team.

Game Date Winner Prediction
1 Hurricanes vs. Waratahs Apr 07 Hurricanes 20.90
2 Sunwolves vs. Bulls Apr 08 Bulls -13.10
3 Highlanders vs. Blues Apr 08 Highlanders 10.40
4 Brumbies vs. Reds Apr 08 Brumbies 16.80
5 Sharks vs. Jaguares Apr 08 Sharks 6.70
6 Stormers vs. Chiefs Apr 08 Chiefs -2.70
7 Force vs. Kings Apr 09 Force 13.50


NRL Predictions for Round 6

Team Ratings for Round 6

The basic method is described on my Department home page.

Here are the team ratings prior to this week’s games, along with the ratings at the start of the season.

Current Rating Rating at Season Start Difference
Storm 9.40 8.49 0.90
Raiders 8.76 9.94 -1.20
Cowboys 5.01 6.90 -1.90
Broncos 4.95 4.36 0.60
Sharks 4.70 5.84 -1.10
Panthers 4.61 6.08 -1.50
Roosters 1.19 -1.17 2.40
Sea Eagles 0.87 -2.98 3.80
Eels -0.66 -0.81 0.10
Dragons -1.85 -7.74 5.90
Bulldogs -2.91 -1.34 -1.60
Rabbitohs -3.38 -1.82 -1.60
Titans -3.48 -0.98 -2.50
Warriors -7.44 -6.02 -1.40
Wests Tigers -8.02 -3.89 -4.10
Knights -13.81 -16.94 3.10


Performance So Far

So far there have been 40 matches played, 22 of which were correctly predicted, a success rate of 55%.
Here are the predictions for last week’s games.

Game Date Score Prediction Correct
1 Bulldogs vs. Broncos Mar 30 10 – 7 -5.80 FALSE
2 Roosters vs. Sea Eagles Mar 31 12 – 18 5.70 FALSE
3 Cowboys vs. Rabbitohs Mar 31 20 – 6 11.40 TRUE
4 Sharks vs. Knights Apr 01 19 – 18 25.80 TRUE
5 Raiders vs. Eels Apr 01 30 – 18 13.10 TRUE
6 Storm vs. Panthers Apr 01 28 – 6 5.70 TRUE
7 Warriors vs. Titans Apr 02 28 – 22 -1.10 FALSE
8 Wests Tigers vs. Dragons Apr 02 6 – 28 0.80 FALSE


Predictions for Round 6

Here are the predictions for Round 6. The prediction is my estimated expected points difference with a positive margin being a win to the home team, and a negative margin a win to the away team.

Game Date Winner Prediction
1 Broncos vs. Roosters Apr 06 Broncos 7.30
2 Knights vs. Bulldogs Apr 07 Bulldogs -7.40
3 Panthers vs. Rabbitohs Apr 07 Panthers 11.50
4 Sea Eagles vs. Dragons Apr 08 Sea Eagles 6.20
5 Titans vs. Raiders Apr 08 Raiders -8.70
6 Cowboys vs. Wests Tigers Apr 08 Cowboys 16.50
7 Warriors vs. Eels Apr 09 Eels -2.80
8 Storm vs. Sharks Apr 09 Storm 8.20


March 28, 2017

Super 18 Predictions for Round 6

Team Ratings for Round 6

The basic method is described on my Department home page.

Here are the team ratings prior to this week’s games, along with the ratings at the start of the season.

Current Rating Rating at Season Start Difference
Hurricanes 17.79 13.22 4.60
Chiefs 10.88 9.75 1.10
Crusaders 8.45 8.75 -0.30
Highlanders 7.61 9.17 -1.60
Lions 7.41 7.64 -0.20
Brumbies 3.71 3.83 -0.10
Stormers 2.36 1.51 0.90
Blues 2.04 -1.07 3.10
Waratahs 1.55 5.81 -4.30
Sharks 0.85 0.42 0.40
Jaguares -1.58 -4.36 2.80
Bulls -2.46 0.29 -2.70
Cheetahs -8.30 -7.36 -0.90
Force -8.57 -9.45 0.90
Reds -9.87 -10.28 0.40
Rebels -11.78 -8.17 -3.60
Kings -17.75 -19.02 1.30
Sunwolves -19.45 -17.76 -1.70


Performance So Far

So far there have been 42 matches played, 32 of which were correctly predicted, a success rate of 76.2%.
Here are the predictions for last week’s games.

Game Date Score Prediction Correct
1 Crusaders vs. Force Mar 24 45 – 17 20.10 TRUE
2 Rebels vs. Waratahs Mar 24 25 – 32 -10.20 TRUE
3 Blues vs. Bulls Mar 25 38 – 14 6.40 TRUE
4 Brumbies vs. Highlanders Mar 25 13 – 18 0.80 FALSE
5 Sunwolves vs. Stormers Mar 25 31 – 44 -18.50 TRUE
6 Kings vs. Lions Mar 25 19 – 42 -21.50 TRUE
7 Cheetahs vs. Sharks Mar 25 30 – 38 -5.30 TRUE
8 Jaguares vs. Reds Mar 25 22 – 8 12.10 TRUE


Predictions for Round 6

Here are the predictions for Round 6. The prediction is my estimated expected points difference with a positive margin being a win to the home team, and a negative margin a win to the away team.

Game Date Winner Prediction
1 Highlanders vs. Rebels Mar 31 Highlanders 23.40
2 Blues vs. Force Apr 01 Blues 14.60
3 Chiefs vs. Bulls Apr 01 Chiefs 17.30
4 Reds vs. Hurricanes Apr 01 Hurricanes -23.70
5 Stormers vs. Cheetahs Apr 01 Stormers 14.20
6 Lions vs. Sharks Apr 01 Lions 10.10
7 Waratahs vs. Crusaders Apr 02 Crusaders -2.90


NRL Predictions for Round 5


Team Ratings for Round 5

The basic method is described on my Department home page.

Here are the team ratings prior to this week’s games, along with the ratings at the start of the season.

Current Rating Rating at Season Start Difference
Raiders 8.86 9.94 -1.10
Storm 8.13 8.49 -0.40
Sharks 6.61 5.84 0.80
Panthers 5.89 6.08 -0.20
Broncos 5.66 4.36 1.30
Cowboys 4.78 6.90 -2.10
Roosters 2.12 -1.17 3.30
Sea Eagles -0.06 -2.98 2.90
Eels -0.76 -0.81 0.00
Titans -2.90 -0.98 -1.90
Rabbitohs -3.15 -1.82 -1.30
Dragons -3.60 -7.74 4.10
Bulldogs -3.62 -1.34 -2.30
Wests Tigers -6.26 -3.89 -2.40
Warriors -8.03 -6.02 -2.00
Knights -15.71 -16.94 1.20


Performance So Far

So far there have been 32 matches played, 18 of which were correctly predicted, a success rate of 56.2%.
Here are the predictions for last week’s games.

Game Date Score Prediction Correct
1 Rabbitohs vs. Roosters Mar 23 6 – 20 0.50 FALSE
2 Panthers vs. Knights Mar 24 40 – 0 22.30 TRUE
3 Broncos vs. Raiders Mar 24 13 – 12 0.10 TRUE
4 Sea Eagles vs. Bulldogs Mar 25 36 – 0 1.90 TRUE
5 Eels vs. Sharks Mar 25 6 – 20 -2.00 TRUE
6 Titans vs. Cowboys Mar 25 26 – 32 -3.80 TRUE
7 Wests Tigers vs. Storm Mar 26 14 – 22 -11.50 TRUE
8 Dragons vs. Warriors Mar 26 26 – 12 7.30 TRUE


Predictions for Round 5

Here are the predictions for Round 5. The prediction is my estimated expected points difference with a positive margin being a win to the home team, and a negative margin a win to the away team.

Game Date Winner Prediction
1 Bulldogs vs. Broncos Mar 30 Broncos -5.80
2 Roosters vs. Sea Eagles Mar 31 Roosters 5.70
3 Cowboys vs. Rabbitohs Mar 31 Cowboys 11.40
4 Sharks vs. Knights Apr 01 Sharks 25.80
5 Raiders vs. Eels Apr 01 Raiders 13.10
6 Storm vs. Panthers Apr 01 Storm 5.70
7 Warriors vs. Titans Apr 02 Titans -1.10
8 Wests Tigers vs. Dragons Apr 02 Wests Tigers 0.80


March 27, 2017

Nice to know it’s not men’s fault

Q: Did you see the headline? “Science proves beautiful women do make men cheat on their partners”?

A: Yes.

Q: Isn’t that a bit unethical? Doing experiments to make men cheat on their partners?

A: That’s not what they did.

Q: Well, not “make”, I suppose. “Encourage”.

A: “Seduce”, perhaps?

Q: Yes!

A: ◔_◔.  No.

Q: No what?

A: No actual cheating on partners was measured.  The study participants ‘cheated’ with small amounts of money — a few dollars.

Q: Oh. Did the researchers say this would extend to cheating on partners?

A: In the research paper they say “sexy women can seduce men away from behaving honestly and may more readily attract males who lie than was previously thought” and “For men whose mating motivation is heightened by exposure to sexual stimuli, dishonesty appears to be a tactic for projecting characteristics preferred by women (e.g., large economic resources)

Q: So beautiful women make men cheat to get small amounts of money, because then they’ll look rich and desirable.

A: That seems to be the theory.

Q: And this is the women’s fault.

A: They don’t quite come out and say that. But it makes men lose self-control

Q: Yes, this evidence that sexualised pictures make men lose self-control. How did they measure that?

A: The men took longer to answer computer questions involving the Stroop Effect: like “what colour is the word RED

Q: Is it just me who finds this slightly anticlimactic in context?

A: No.

Q: Isn’t the whole thing probably just chance?

A: They did have a preregistered replication of their main result, so that’s less likely than usual.

Q: How about that participants thought experimenters showing sexualised pictures of women were jerks and deserved to be taken for small sums of money?

A: Conceivable, I suppose. But that’s not an evolutionary explanation, and this is an evolutionary journal.

Q: Seriously, though, this wasn’t very novel or surprising (even to the researchers). Why is this research international news?

A: Because the Daily Mail evolved in an environment where sensationalising any research connected with sex or cancer was rewarded, and it can’t help itself.


Briefly

  • There’s yet another ‘breakthrough’ test for future Alzheimers. The story is better than usual, pointing out “while the score could help to identify people for trials, it was too early to apply it as a genetic testing tool for use in the clinic.
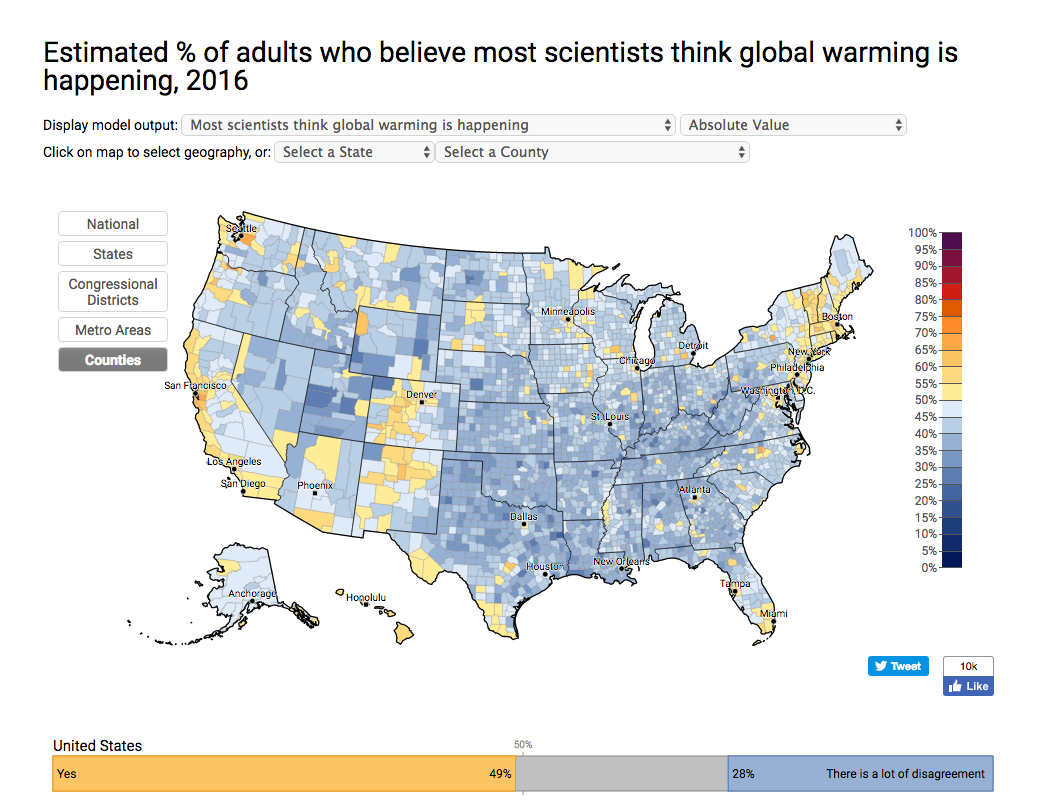
  • Research from Yale finds that (in the US) a lot of the people who don’t accept that climate change is real do say they trust climate scientists, they just  don’t believe that most scientists believe in it. Which is actually weirder.
    warming
  • The Boston school system has switched from the Mercator projection to the Peters projection for maps in schools. Which is a step forward. But some of the coverage is repeating the myth that the Mercator projection became popular because it makes Europe look big. Here’s a guest post at mathbabe.org on the topic by Ernie Davis, and here’s the XKCD take
March 24, 2017

Present exaggerated, future hypothetical

There’s a story at Stuff with the headline “Blood test picks up cancer before symptoms start to show“. It’s attributed to the Telegraph but doesn’t seem to have run there yet.( It’s here. I don’t think it was up when I wrote that, but I might have missed it).  The test looks at tiny amounts of tumour DNA that are circulating in the blood.

It’s not straightforward to demonstrate that a new test is better for early cancer detection than current methods. You need to use the test on a group of people who have cancer but don’t know it yet. Recruiting them is hard. In this story, the researchers didn’t do that. They made imaginary people with undetected cancer in a computer, and tested their imaginary blood to see if the cancer would be picked up.  That’s a good idea, but it’s a very early stage in the research process.

The researchers also went on to use the method on some real blood samples of people with lung, liver, or breast cancer, and without cancer. These aren’t the currently-undiagnosable people who might benefit in the future, but most of the cancer patients had early-stage disease by current standards.

The story says these results were very good

It picked up eight out of 10 cancers, and gave a false positive on fewer than one in 100 occasions.

The press release and the paper itself aren’t as positive. The test did pick up 8 out of 10 early-stage cancers, but the false positive rate was 20%.  That’s far too high for a screening test in people with no symptoms.  The test also did a lot better on liver cancer than on lung cancer or breast cancer, which isn’t very helpful for NZ or for the UK, since liver cancer is relatively rare in both countries.

As the story does say, this research is in its infancy, and the new test did much better than some standard machine-learning methods run on the same data. But it’s nowhere near ready for prime time: the headline is referring to potential future benefits of a different, further-developed test, but is using the present tense.