Posts filed under General (3152)

November 4, 2016

Fighting wrinkles

Q: So, lots of good health news today!

A: <suspiciously> Yes?

Q: Eating tomatoes prevents wrinkles and skin cancer! And it’s going to be tomato season soon.

A: Not convinced

Q: Why? Did the people have to eat too many tomatoes? Is that even possible?

A: No tomatoes were involved in the study. People took capsules of oil with tomato extract high in lycopene or lutein.

Q: Sounds a bit of a waste. But still, reducing wrinkles and sun damage generally must be good.

A: They didn’t measure wrinkles or skin cancer either.

Q: So what did they measure?

A: Activity of some genes related to skin damage by ultraviolet light.

Q: And these were significantly reduced, right?

A: Yes, but ‘significantly’ here just means ‘detectably’. It doesn’t necessarily translate into a lot of protection.

Q: Do they have an estimate of how much protection?

A: The Herald story says an earlier study found taking lycopene supplements to be as effective as an SPF 1.3 sunscreen.

Q: Only SPF 13? Still, if that’s just from the supplement it’s pretty impressive.

A: Not 13. SPF 1.3.

Q: Ok, so that’s not so impressive. But tomato season and sunscreen season peak at the same time, and every bit helps.

A: Actually, if it really is the lycopene, your horiatiki salad isn’t going to work — lycopene isn’t well absorbed from fresh tomatoes.


November 3, 2016

Briefly

  • Story about startup company claiming to tailor wine advice to your genome. “Their motto of ‘A little science and a lot of fun’ would be more accurately put as ‘No science and a lot of fun,’”
  • “US Broadband Providers Will Need Permission to Collect Private Data” from the New York Times. Providers get to see exactly what websites you visit and how many pages you read there.  And they know where you live and where you internet. Selling that information will now be opt-in.
  • Insurance firm Swiss Re thinks health insurance rates will soon be targeted using social media. But the heart-disease research they mention only looked at predicting the heart disease for county of residence — and even before Big Data insurance companies have known where you live.
  • Along the same lines, car insurance firm Admiral was planning to set rates for young drivers based on social media data. Facebook is Not Happy. But actually, this  looks more like AMI’s current advertising pitch “We treat young drivers like good drivers”.  You get people to sign up, and raise their rates if you find out they aren’t good drivers.
  • SMBC comic on survivor bias: “Nobody wants to read about the hero who left the farm and immediately got stabbed by highwaymen”
  • Insider trading involves misuse of “material, non-public information.” With predictive analytics, it gets much harder to decide what’s material and what’s non-public
October 30, 2016

Briefly

  • A long post on the use and misuse of the ‘Twitter firehose’, from Bloomberg View
  • A long story at Stuff about discharge without conviction, though a bit undermined by the fact that, as the story says, “[the] number of discharges without conviction has plummeted, from 3189 in 2011, to 2103 in 2015,
  • While the idea of  predicting the US election using mako sharks (carchariamancy?) is no sillier than psychic meerkats or lucky lotto retailers, I don’t think the story really works unless the people pushing it at least pretend to believe it.
  • On the other hand, some people did seriously argue that shark attacks affected the results of presidential elections. And were wrong
October 29, 2016

Uncertainty and symmetry in the US elections

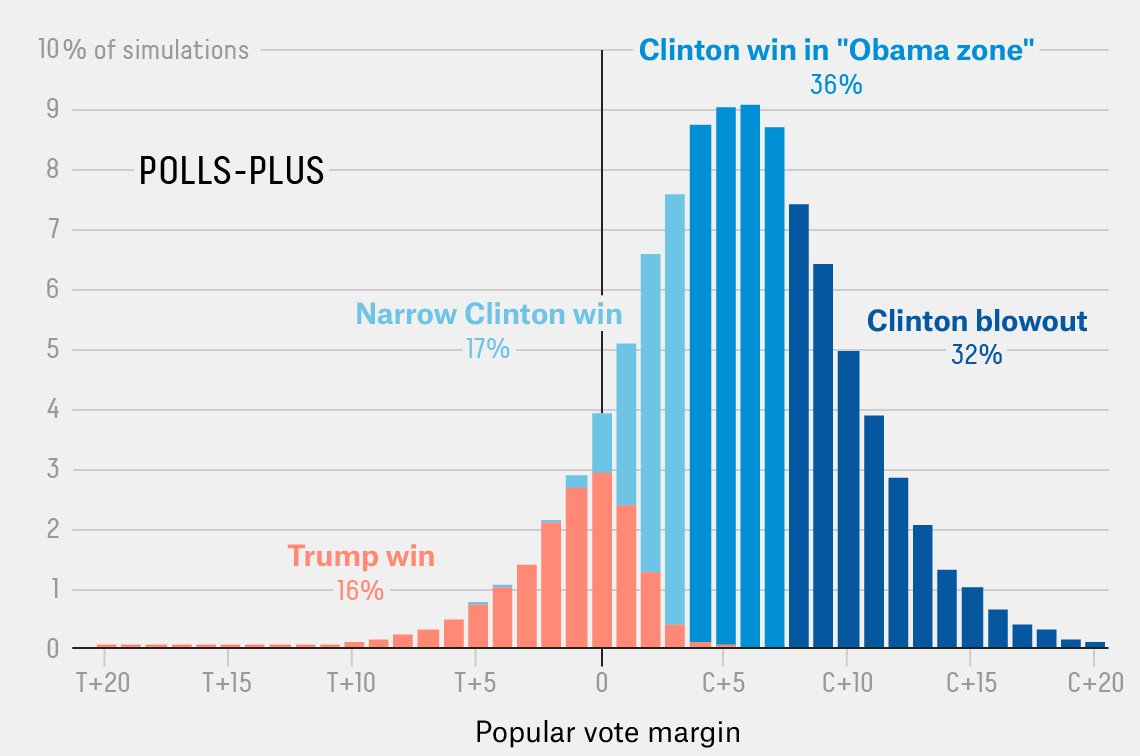
Nate Silver’s predictions at 538 give Donald Trump a much higher chance of winning the election than anyone else’s: at the time of writing, 20% vs 8% from the Upshot, 5% from Daily Kos, or 1% from Sam Wang at the Princeton Election Consortium.

That’s mostly not because Nate Silver thinks Trump is doing much better: 538 estimates 326 Electoral College votes for Clinton; Daily Kos has 334; the Princeton folks have 335.  The popular vote margin is estimated as 5.7% by 538 and about 8.4% by Princeton (their ‘meta-margin’ is 4.2%).

Everyone also pretty much agrees that the uncertainty in the votes is symmetric: if the polls are wrong, the estimated support for Clinton could as easily be too high as too low.  But that’s the uncertainty in the margin, not in the chance of winning.  Probabilities can’t go above 100% or below 0%, and when they get close to these limits, a symmetric uncertainty in the vote margin has to turn into an asymmetric uncertainty in the probability prediction, and a larger uncertainty has to pull the probability further away from the boundaries.

Nate Silver’s model thinks that opinion polls can be off by 6 or 7 percent in either direction even this close to the elections; the others don’t. It’s question that history can’t definitively answer, because there isn’t enough  history to work with. If Silver is wrong, we won’t know even after the election; even if he’s right, the most likely outcome is for the results to look pretty much like everyone predicts.

October 28, 2016

False positives

Before a medical diagnostic test is introduced, it is supposed to be evaluated carefully for accuracy. In particular, if the test is going to be used on the whole population, it’s important to know the false positive rate: of the people who test positive, what proportion really have a problem?  Part of  this process is to make sure that the test works as a biological or chemical assay: is it accurately measuring, say, carbon monoxide or glucose in the blood.  But that’s only part of the process.  You also need to worry about what threshold to use — how high is ‘high’ — and whether people could have high carbon monoxide levels without being smokers, or high glucose levels without being diabetic.

I haven’t heard any suggestion that the tests for methamphetamine contamination in houses fail the first step. There’s meth present when they find it. But Housing NZ were treating the high assay value as evidence that (a) the house was dangerous to live in, and (b) that the tenant was responsible. The false positive rates for (a) and (b) were not established, and appear to be shockingly high given the consequences.

The Ministry of Health has now released new guidelines on meth contamination, with concentration thresholds based on evidence (though towards the low end of what their evidence would support).  They claim to have repeatedly warned Housing NZ. Russell Brown has an excellent summary of the situation at Public Address.

While this is all a step forward, it’s not addressing the question of (b) above: if there’s methamphetamine present at above the new action threshold, it appears that this is still going to be taken as evidence of the tenant’s culpability. That would only make sense if, contrary to the advertising from the meth-testing companies, low-level meth contamination were very rare in rented NZ houses.

October 25, 2016

Oversampling

From the election on the other side of the Pacific.

Wikileaks also shows how John Podesta rigged the polls by oversampling democrats, a voter suppression technique.

Now, as Josh Marshall at Talking Points Memo goes on to point out, the email in question is not to or from John Podesta, is eight years old, and refers to the Democrats internal polls not to public polls. So it’s kind of uninteresting. Except to me.  I’m a professional sampling nerd. I do research on oversampling; I publish papers on it; I write software about it: ways to do it and ways to correct for it. And just like a sailing nerd who has heard Bermuda rigging described as a threat to democracy, I’m going to explain more than you ever needed to know about oversampling.

The most basic form of oversampling in medical research has been widely used for over sixty years. If you want to study whether, say, smoking causes lung cancer, it’s very inefficient to take a representative sample of the population because most people, fortunately, don’t have lung cancer. You need to sample maybe 1000 people to get two people with lung cancer. If you have access to hospital records you could find maybe 200 people with lung cancer and 800 healthy control people.   Your case-control sample would have about the same cost as a representative sample of 1000 people, but nearly 100 times more information.  And there are more complex versions of the same idea.

Your case-control sample isn’t representative, but you can still learn things from it.  At a simple level, if the lung cancer cases are more likely to smoke than the controls in the sample, that will also be true in the population. The relationship won’t be the same as in the population, but it will be in the same direction.  For more detailed analysis we can undo the oversampling. Suppose we want to estimate the proportion of smokers in the population. The proportion of smokers in the sample is going to be too high, because we’ve oversampled lung-cancer patients, who are more likely to smoke. To be precise, we’ve got one hundred times too many lung cancer patients in the sample. We can fix that by giving each of them one hundred times less weight in estimating the population total. If 180 of the 200 lung cancer patients smoked, and 100 of the 800 controls did, you’d have a weighted numerator of 180×(1/100)+100×1, and a weighted denominator of 200×(1/100)+800×1, for an unbiased estimate of  12.7%, compared to the unweighted, biased (180+200)/1000 = 38%.

In polling, your question might be what issues are important to swing voters. You’d try to oversample swing voters to ask them, and not waste time and money annoying people whose minds were made up.  Obviously that would make your sample un-representative of the whole population. That’s the point; you want to talk to swing voters, not to a representative sample.  Or you might want to compare the thinking of (generally pro-trump) evangelical Christians and (often anti-Trump) Mormons. Again, if you oversampled conservative religious groups you’d end up with an unrepresentative sample; again, that would be the point. Oversampling isn’t the best strategy when your primary purpose is finding out what a representative sample thinks; it often is the best strategy when you want to know more about some smaller group of people.

However, if you also wanted an estimate of the overall popular vote you could easily undo the oversampling and downweight the swing voters in your sample to get an unbiased estimate as we did with the smoking rates.  You have to do that anyway;  even if you try to get a representative sample it probably won’t work because some groups of people are less likely to answer their phones and agree to talk to you.  The weighting you use to fix up accidental over- and under- sampling is exactly the same as the weighting you use when it’s deliberate.
 

Mitre 10 Cup Predictions for the Mitre 10 Cup Finals

Team Ratings for the Mitre 10 Cup Finals

The basic method is described on my Department home page.

Here are the team ratings prior to this week’s games, along with the ratings at the start of the season.

Current Rating Rating at Season Start Difference
Canterbury 14.53 12.85 1.70
Tasman 10.59 8.71 1.90
Taranaki 7.38 8.25 -0.90
Auckland 6.55 11.34 -4.80
Counties Manukau 5.89 2.45 3.40
Otago 0.44 0.54 -0.10
Waikato -0.37 -4.31 3.90
Wellington -1.72 4.32 -6.00
North Harbour -2.53 -8.15 5.60
Manawatu -3.94 -6.71 2.80
Bay of Plenty -4.25 -5.54 1.30
Hawke’s Bay -5.76 1.85 -7.60
Northland -13.35 -19.37 6.00
Southland -16.96 -9.71 -7.30


Performance So Far

So far there have been 74 matches played, 52 of which were correctly predicted, a success rate of 70.3%.
Here are the predictions for last week’s games.

Game Date Score Prediction Correct
1 Otago vs. Bay of Plenty Oct 21 27 – 20 9.10 TRUE
2 Wellington vs. North Harbour Oct 22 37 – 40 6.50 FALSE
3 Canterbury vs. Counties Manukau Oct 23 22 – 7 12.10 TRUE
4 Taranaki vs. Tasman Oct 23 29 – 41 3.60 FALSE


Predictions for the Mitre 10 Cup Finals

Here are the predictions for the Mitre 10 Cup Finals. The prediction is my estimated expected points difference with a positive margin being a win to the home team, and a negative margin a win to the away team.

Game Date Winner Prediction
1 Otago vs. North Harbour Oct 28 Otago 7.00
2 Canterbury vs. Tasman Oct 29 Canterbury 7.90


October 24, 2016

Why so negative?

My StatsChat posts, and especially the ‘Briefly’ links, tend to be pretty negative about big data and algorithmic decision-making. I’m a statistician, and I work with large-scale personal genomic data, so you’d expect me to be more positive. This post is about why.

The phrase “devil’s advocate” has come to mean a guy on the internet arguing insincerely, or pretending to argue insincerely, just for the sake of being a dick. That’s not what it once meant. In the early eighteenth century, Pope Clement XI created the position of “Promoter of the Faith” to provide a skeptical examination of cases for sainthood. By the time a case for sainthood got to the Vatican, there would be a lot of support behind it, and one wouldn’t have to be too cynical to suspect there had been a bit of polishing of the evidence. The idea was to have someone whose actual job it was to ask the awkward questions — “devil’s advocate” was the nickname.  Most non-Catholics and many Catholics would argue that the position obviously didn’t achieve what it aimed to do, but the idea was important.

In the research world, statisticians are often regarded this way. We’re seen as killjoys: people who look at your study and find ways to undermine your conclusions. And we do. In principle you could imagine statisticians looking at a study and explaining why the results were much stronger than the investigators thought, but since people are really good at finding favourable interpretations without help, that doesn’t happen so much.

Machine learning includes some spectacular achievements, and has huge potential for improving our lives. It also has a lot of built-in support both because it scales well to making a few people very rich, and because it fits in with the human desire to know things about the world and about other people.

It’s important to consider the risks and harms of algorithmic decision making as well as the very real benefits. And it’s important that this isn’t left to people who can be dismissed as not understanding the technical issues.  That’s why Cathy O’Neil’s book Weapons of Math Destruction is important, and on a much smaller scale it’s why you’ll keep seeing stories about privacy or algorithmic prejudice here on StatsChat. As Section 162 (4) (a) (v) of the Education Act indicates, it’s my actual job.


Briefly

  • I would never have guessed this was a problem, but “Data from three national surveys indicated that people are unaware that age is a risk factor for cancer. Moreover, those who were least aware perceived the highest risk of cancer regardless of age.” (free abstract but paywalled paper, via @RolfDegen)
  • Useful graph of uncertainty in vote margin and winner from Nate Silver on Twitter.
    us-uncertainty
  • There’s a computer-personalised education system supported by Facebook that seems to be getting good results. On the other hand, the evidence for the effectiveness isn’t very good quality, and the handling of data privacy is weak. There’s going to be a lot of this sort of issue coming up in the data-based policy world. (Washington Post)
October 23, 2016

Psychic meerkats and Halloween masks

Prediction is hard — especially,  as the Danish proverb says, when it comes to the future. In the Rugby World Cup we had psychic meerkats. For the US elections the new bogus prediction trend is Halloween masks: allegedly, more masks are sold with the face of the candidate who goes on to win.

The first question with a claim like this one, especially given some of the people making it, is whether the historical claim is true.  In this case it’s true-ish.  The claim was made before the 2012 election, and while the data aren’t comprehensive, they are from the same big chain of stores each year. From 1980 to 2012, the mask rule has predicted the eventual winner of the presidency.  That’s actually an argument against it.

If there’s more to the mask sales than there is to psychic meerkats, it would have to be as a prediction of the popular vote — you’d need data from individual states to predict the weird US Electoral College. But if the mask rule got the 2000 election right, it must have got the popular vote wrong that year — George W. Bush won the electoral college, but lost the popular vote to Al Gore. From that point of view, we’re looking at 8 out of 9.

More importantly, 9 out of 9 isn’t all that impressive. Suppose you got your predictions by flipping a coin.  Your chance of getting either all heads for the Republican wins or all heads for the Democratic wins is 1 in 256, increasing to 1 in 128 if you’re allowed to choose which way to treat the 2000 election.  The chance of getting 8 of 9 agreement is much better: about 1 in 13.  If only one in a million people in the US had tried coming up with just one prediction rule each, you’d expect someone to get it perfect and dozens to get it nearly right.

Given these odds, it wouldn’t be surprising if, say, a US professional sports team had results agreeing with the Presidential results — and in fact, there was a rule based on the results for the Washington Redskins football team that worked from 1940 to 2000, was fudged to work in 2004, and then failed completely in 2012.    That’s 17/19 correct, but since the rule was first publicised in the run-up to the 2000 election, it’s 2/4 correct in actual use.

If you’re allowed to combine multiple variables it gets even easier to find rules. With anything from basic linear regression to a neural network you’d expect to get perfect prediction from five unrelated variables. Even restricting the models to be simple doesn’t help much.  I downloaded some OECD data on national GDP for various countries, and found that since 1980 the Republicans have won the popular vote precisely in years when the GDP of Sweden increased more than the GDP of Norway.

My advice is to stick with the psychic meerkats for entertainment and the opinion poll aggregators or the betting markets for prediction.