Posts filed under General (3152)

September 8, 2016

For small values of ‘infinitely’

Q: Did you see “women are infinitely more likely than men to suffer from virtually every form of headache there is”?

A: What would that even mean?

Q: Well, it says “statistically’, so you should know.

A: No.

Q: Could it be like ‘literally’ and it just means ‘a lot’. Like ‘five times as much’ or something?

A: I suppose, but it still isn’t true.

Q: What does the story say?

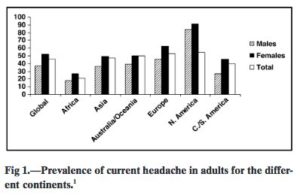
A: “a review of 24 worldwide studies published in the journal Headache in 2011 found that while more than half of women polled (52 per cent) reported having a problem with headaches at the time of the research, only 37 per cent of men did.”

Q: And is that right?

A: My English teachers would say they’re missing commas after “studies” and “2011”, but I might not have the high ground in that kind of debate.

Q: Restricting to statistical pedantry, is it right?

A: Well, the first step would be to find the paper, which they don’t make all that easy.

Q: You mean they don’t link?

A: That’s part of it, as Mark Hanna eloquently complained on Twitter. But they also don’t give the author names or the month.

Q: Did you find it?

A: Yes.

Q: And?

A: Here’s the relevant graph
crzs68jvuaaoufl

Q: Wait, what? More than 80% of men and women in North America have headaches right now? But only about 50% of people in total?

A: Looking up the reference that little 1 points to, it seems ‘current’ headache really means ‘in the past three months’, or even ‘in the past year’, depending on the study.

Q: And the total being much less than either men or women separately?

A: ¯\_(ツ)_/¯   If I had to guess, maybe the studies that separated out men and women used a longer time period

Q: And is the time period why there are more headaches in North America than Europe?

A: Could be. Or the quality of the cheese. Or the fact that they’re in an election campaign, like, half the time.

Q: I’m sensing you don’t like this graph.

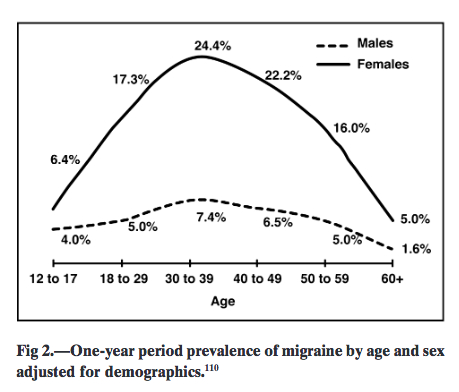
A: There are others
headache

Q:  Right. 7.4% in women is less than 6.4% in men. ಠ_ಠ

A: Actually, the lines are ok, it’s just that the numbers are in the wrong places. If they’d written the numbers on the y-axis like we’ve been doing for centuries, they’d be ok.

Q: Ok. But we nearly digress. You’re saying ‘infinitely more” means something in the range 1.5 times to three or four times more?

A: And that some of the comparisons are a bit dodgy.

Q: It seems to have taken more work than necessary to establish that.

A: It sure has.

Q: Would you like to quote some of Mark Hanna’s tweets on linking?

A: “Listen up, reporters & editors. Every day I see you publish articles using “studies say” that make it hard or impossible to find the studies. You should be improving public understanding of science, but instead you are training your audience to believe in “studies say”. 

Yes, do write about research. But let your readers read it too. Being able to criticise research is, erm, critical to scientific literacy. You are reinforcing the perception that science is opaque, impenetrable, and not for the eyes of laypeople. But that’s not true at all.

Worse than that, by training your readers to believe in “studies say” you are priming them to be fooled by pseudoscience.”

Q: Yes, that’ll preach.
Theory and data

From the Herald (from the Daily Telegraph)

A revolutionary blood test, which acts like a smoke detector to spot cancer up to 10 years before symptoms appear, could be available within five years.

It looks like this is genuinely impressive research, and deserves its spot at the British Science Festival, but it’s harder to assess the realism of the claims. What do we actually know now? Well, less than we should, because the claim is based on a press release and interviews about unpublished research. However, earlier research by the same group is available, with a bit of detective work.

In a conference abstract published in February, they report what they were trying to do: measure mutations in a specific gene in red blood cells. As the Herald story says:

Scientists at Swansea University have discovered that mutations occur in red blood cells way before any signs of cancer are evident.

But it’s more than that. Mutations in red blood cells occur before cancer even exists — another reason this test is potentially useful is for studying low levels of mutations that would have a very low chance of leading to cancer, so that the risk of realistic doses of potential carcinogens can be assessed. Since the test picks up mutations in the absence of cancer, there’s justification for worrying about false positives.

In the February abstract they had used the test on 121 people, and were claiming five-times-higher mutation rates in people with cancer than healthy people. Now they have 300 people and are claiming ten-times-higher rates — one possible explanation is that they’ve made the test more selective somehow and so are picking up fewer uninteresting mutations.  In any case, progress. The earlier data didn’t look as if it could support a useful test; the new data might be able to.

We still don’t know about the false-positive rate — with 300 people tested, it’s too early to say.  The false-positive rate is important for another reason, though.  The Independent has another story, quoting the lead researcher

Professor Jenkins said they needed to find evidence that it would work for other cancers, but added it would be hard to imagine that it would not.

“It would be really difficult to think why it would only affect oesophageal cancer,” he said.

As he says, it’s hard to think why oesophageal cancer would be unique — though you might expect some cancers to be different. For example, in cervical cancer, the mutations are caused by a virus that only infects certain cell types, so it might not cause mutations that show up in red blood cells.  But if we assume many cancers show the same pattern of red blood cell mutations, assessing the usefulness of the test gets more difficult. Suppose a positive result means you’re going to get some type of cancer over the next ten years, but it could be almost any type. What would the next step be?

There’s another important point in the first sentence of the Herald story. It contains two numbers. One is bigger than the other.  As far as I can tell, this test is done on freshly-collected blood, and hasn’t been done on large numbers of healthy people yet. If the test is available within five years, it will, at best only come with reliable information for five years after testing.

September 7, 2016

NRL Predictions for Finals Week 1

Team Ratings for Finals Week 1

The basic method is described on my Department home page.

Here are the team ratings prior to this week’s games, along with the ratings at the start of the season.

Current Rating Rating at Season Start Difference
Raiders 10.54 -0.55 11.10
Storm 9.17 4.41 4.80
Cowboys 8.95 10.29 -1.30
Panthers 5.73 -3.06 8.80
Broncos 4.60 9.81 -5.20
Sharks 3.91 -1.06 5.00
Roosters -0.08 11.20 -11.30
Bulldogs -0.32 1.50 -1.80
Titans -0.75 -8.39 7.60
Eels -0.82 -4.62 3.80
Rabbitohs -1.55 -1.20 -0.30
Sea Eagles -2.83 0.36 -3.20
Wests Tigers -4.05 -4.06 0.00
Warriors -6.26 -7.47 1.20
Dragons -7.44 -0.10 -7.30
Knights -17.13 -5.41 -11.70


Performance So Far

So far there have been 192 matches played, 123 of which were correctly predicted, a success rate of 64.1%.
Here are the predictions for last week’s games.

Game Date Score Prediction Correct
1 Broncos vs. Roosters Sep 01 24 – 14 7.20 TRUE
2 Bulldogs vs. Rabbitohs Sep 02 10 – 28 7.70 FALSE
3 Dragons vs. Knights Sep 03 28 – 26 14.40 TRUE
4 Cowboys vs. Titans Sep 03 32 – 16 12.10 TRUE
5 Storm vs. Sharks Sep 03 26 – 6 6.30 TRUE
6 Warriors vs. Eels Sep 04 18 – 40 1.80 FALSE
7 Wests Tigers vs. Raiders Sep 04 10 – 52 -6.90 TRUE
8 Panthers vs. Sea Eagles Sep 04 36 – 6 8.60 TRUE


Predictions for Finals Week 1

Here are the predictions for Finals Week 1. The prediction is my estimated expected points difference with a positive margin being a win to the home team, and a negative margin a win to the away team.

Game Date Winner Prediction
1 Broncos vs. Titans Sep 09 Broncos 8.40
2 Raiders vs. Sharks Sep 10 Raiders 9.60
3 Storm vs. Cowboys Sep 10 Storm 3.20
4 Panthers vs. Bulldogs Sep 11 Panthers 6.10


Mitre 10 Cup Predictions for Round 4

Team Ratings for Round 4

The basic method is described on my Department home page.

Here are the team ratings prior to this week’s games, along with the ratings at the start of the season.

Current Rating Rating at Season Start Difference
Canterbury 16.55 12.85 3.70
Auckland 9.26 11.34 -2.10
Taranaki 9.09 8.25 0.80
Tasman 6.35 8.71 -2.40
Counties Manukau 3.78 2.45 1.30
Wellington 2.37 4.32 -2.00
Otago 1.95 0.54 1.40
Waikato -2.91 -4.31 1.40
Hawke’s Bay -3.34 1.85 -5.20
Bay of Plenty -4.67 -5.54 0.90
North Harbour -6.57 -8.15 1.60
Manawatu -7.40 -6.71 -0.70
Southland -12.61 -9.71 -2.90
Northland -15.36 -19.37 4.00


Performance So Far

So far there have been 22 matches played, 19 of which were correctly predicted, a success rate of 86.4%.
Here are the predictions for last week’s games.

Game Date Score Prediction Correct
1 Otago vs. Northland Aug 31 33 – 28 26.40 TRUE
2 Hawke’s Bay vs. Counties Manukau Sep 01 20 – 48 2.30 FALSE
3 Southland vs. Auckland Sep 02 16 – 51 -14.10 TRUE
4 Tasman vs. Taranaki Sep 03 25 – 20 0.40 TRUE
5 Wellington vs. North Harbour Sep 03 21 – 17 14.90 TRUE
6 Northland vs. Canterbury Sep 03 34 – 52 -32.00 TRUE
7 Bay of Plenty vs. Otago Sep 04 32 – 33 -4.90 TRUE
8 Waikato vs. Manawatu Sep 04 19 – 10 8.40 TRUE


Predictions for Round 4

Here are the predictions for Round 4. The prediction is my estimated expected points difference with a positive margin being a win to the home team, and a negative margin a win to the away team.

Game Date Winner Prediction
1 Hawke’s Bay vs. Auckland Sep 07 Auckland -8.60
2 Taranaki vs. Southland Sep 08 Taranaki 25.70
3 Bay of Plenty vs. Northland Sep 09 Bay of Plenty 14.70
4 Counties Manukau vs. Wellington Sep 09 Counties Manukau 5.40
5 North Harbour vs. Manawatu Sep 10 North Harbour 4.80
6 Otago vs. Tasman Sep 10 Tasman -0.40
7 Canterbury vs. Hawke’s Bay Sep 11 Canterbury 23.90
8 Auckland vs. Waikato Sep 11 Auckland 16.20


Currie Cup Predictions for Round 6

Team Ratings for Round 6

The basic method is described on my Department home page.

Here are the team ratings prior to this week’s games, along with the ratings at the start of the season.

Current Rating Rating at Season Start Difference
Lions 9.55 9.69 -0.10
Western Province 5.25 6.46 -1.20
Blue Bulls 1.79 1.80 -0.00
Sharks 1.79 -0.60 2.40
Cheetahs 0.90 -3.42 4.30
Griquas -11.01 -12.45 1.40
Pumas -11.15 -8.62 -2.50
Cavaliers -12.27 -10.00 -2.30
Kings -16.30 -14.29 -2.00


Performance So Far

So far there have been 19 matches played, 12 of which were correctly predicted, a success rate of 63.2%.
Here are the predictions for last week’s games.

Game Date Score Prediction Correct
1 Cavaliers vs. Pumas Sep 02 25 – 22 2.20 TRUE
2 Cheetahs vs. Kings Sep 02 57 – 25 19.20 TRUE
3 Blue Bulls vs. Lions Sep 03 31 – 17 -6.50 FALSE
4 Western Province vs. Sharks Sep 03 34 – 27 7.00 TRUE


Predictions for Round 6

Here are the predictions for Round 6. The prediction is my estimated expected points difference with a positive margin being a win to the home team, and a negative margin a win to the away team.

Game Date Winner Prediction
1 Lions vs. Western Province Sep 09 Lions 7.80
2 Griquas vs. Cavaliers Sep 10 Griquas 4.80
3 Sharks vs. Cheetahs Sep 10 Sharks 4.40
4 Pumas vs. Blue Bulls Sep 10 Blue Bulls -9.40


September 6, 2016

Briefly

  • A preview of Cathy O’Neil’s book about data science and its potential dangers, coming out tomorrow.
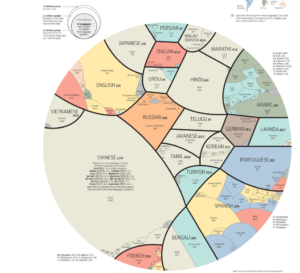
  • A map of the world’s languages — showing the difficulties in definition, since all the Chinese languages are lumped in together when probably equally distinctive languages from different countries are given separately.
    languages
August 31, 2016

Be afraid

From the Herald (from the Daily Mail)

Patients should be warned about the dangers of chemotherapy after research showed that cancer drugs are killing up to 50 per cent of patients in some UK hospitals.

That’s almost completely untrue.

Firstly, the research looked at deaths from any cause within 30 days of starting treatment, and did not claim these were all due to chemotherapy. Secondly,  the 50% figure was in one hospital. Thirdly, it was for a subset of one particular type of cancer.  And, the conclusion from the news story cannot be found anywhere in the research paper.

The researchers do think that chemotherapy is probably being used suboptimally in some of the hospitals, including the one where about 5 out of 10 of the patients being treated ‘with curative intent’ for lung cancer died within 30 days. That hospital stood out, despite the tiny numbers, because the average death rate across all hospitals for similar patients was about 3%.

As the researchers say

The identification of hospitals with significantly higher 30-day mortality rates will promote review of clinical decision making in these hospitals.

It probably will, but that doesn’t tell us much about risks here on the other side of the world


NRL Predictions for Round 26

Team Ratings for Round 26

The basic method is described on my Department home page.

Here are the team ratings prior to this week’s games, along with the ratings at the start of the season.

Current Rating Rating at Season Start Difference
Cowboys 8.64 10.29 -1.70
Storm 8.21 4.41 3.80
Raiders 8.19 -0.55 8.70
Sharks 4.87 -1.06 5.90
Broncos 4.38 9.81 -5.40
Panthers 4.26 -3.06 7.30
Bulldogs 1.43 1.50 -0.10
Roosters 0.14 11.20 -11.10
Titans -0.44 -8.39 7.90
Sea Eagles -1.36 0.36 -1.70
Wests Tigers -1.70 -4.06 2.40
Eels -2.45 -4.62 2.20
Rabbitohs -3.29 -1.20 -2.10
Warriors -4.64 -7.47 2.80
Dragons -6.57 -0.10 -6.50
Knights -18.01 -5.41 -12.60


Performance So Far

So far there have been 184 matches played, 117 of which were correctly predicted, a success rate of 63.6%.
Here are the predictions for last week’s games.

Game Date Score Prediction Correct
1 Bulldogs vs. Cowboys Aug 25 16 – 24 -3.50 TRUE
2 Storm vs. Broncos Aug 26 16 – 26 9.50 FALSE
3 Sea Eagles vs. Raiders Aug 27 30 – 44 -5.30 TRUE
4 Titans vs. Panthers Aug 27 14 – 15 -1.80 TRUE
5 Sharks vs. Roosters Aug 27 37 – 12 5.00 TRUE
6 Warriors vs. Wests Tigers Aug 28 24 – 36 3.20 FALSE
7 Knights vs. Rabbitohs Aug 28 12 – 34 -10.00 TRUE
8 Eels vs. Dragons Aug 29 30 – 18 6.20 TRUE


Predictions for Round 26

Here are the predictions for Round 26. The prediction is my estimated expected points difference with a positive margin being a win to the home team, and a negative margin a win to the away team.

Game Date Winner Prediction
1 Broncos vs. Roosters Sep 01 Broncos 7.20
2 Bulldogs vs. Rabbitohs Sep 02 Bulldogs 7.70
3 Dragons vs. Knights Sep 03 Dragons 14.40
4 Cowboys vs. Titans Sep 03 Cowboys 12.10
5 Storm vs. Sharks Sep 03 Storm 6.30
6 Warriors vs. Eels Sep 04 Warriors 1.80
7 Wests Tigers vs. Raiders Sep 04 Raiders -6.90
8 Panthers vs. Sea Eagles Sep 04 Panthers 8.60


Mitre 10 Cup Predictions for Round 3

Team Ratings for Round 3

The basic method is described on my Department home page.

Here are the team ratings prior to this week’s games, along with the ratings at the start of the season.

Current Rating Rating at Season Start Difference
Canterbury 17.64 12.85 4.80
Taranaki 9.51 8.25 1.30
Auckland 7.38 11.34 -4.00
Tasman 5.94 8.71 -2.80
Otago 4.05 0.54 3.50
Wellington 3.35 4.32 -1.00
Counties Manukau 1.05 2.45 -1.40
Hawke’s Bay -0.61 1.85 -2.50
Waikato -2.96 -4.31 1.30
Bay of Plenty -4.85 -5.54 0.70
Manawatu -7.34 -6.71 -0.60
North Harbour -7.55 -8.15 0.60
Southland -10.73 -9.71 -1.00
Northland -18.37 -19.37 1.00


Performance So Far

So far there have been 14 matches played, 12 of which were correctly predicted, a success rate of 85.7%.
Here are the predictions for last week’s games.

Game Date Score Prediction Correct
1 Otago vs. Wellington Aug 25 44 – 21 0.70 TRUE
2 Manawatu vs. Southland Aug 26 34 – 31 8.40 TRUE
3 Auckland vs. Northland Aug 26 37 – 15 31.50 TRUE
4 Waikato vs. North Harbour Aug 27 26 – 15 8.10 TRUE
5 Taranaki vs. Hawke’s Bay Aug 27 55 – 28 11.30 TRUE
6 Canterbury vs. Tasman Aug 28 45 – 14 12.30 TRUE
7 Counties Manukau vs. Bay of Plenty Aug 28 39 – 34 11.00 TRUE


Predictions for Round 3

Here are the predictions for Round 3. The prediction is my estimated expected points difference with a positive margin being a win to the home team, and a negative margin a win to the away team.

Game Date Winner Prediction
1 Otago vs. Northland Aug 31 Otago 26.40
2 Hawke’s Bay vs. Counties Manukau Sep 01 Hawke’s Bay 2.30
3 Southland vs. Auckland Sep 02 Auckland -14.10
4 Tasman vs. Taranaki Sep 03 Tasman 0.40
5 Wellington vs. North Harbour Sep 03 Wellington 14.90
6 Northland vs. Canterbury Sep 03 Canterbury -32.00
7 Bay of Plenty vs. Otago Sep 04 Otago -4.90
8 Waikato vs. Manawatu Sep 04 Waikato 8.40


Currie Cup Predictions for Round 5

Team Ratings for Round 5

The basic method is described on my Department home page.

Here are the team ratings prior to this week’s games, along with the ratings at the start of the season.

Rating at Season Start Difference
Lions 10.67 9.69 1.00
Western Province 5.25 6.46 -1.20
Sharks 1.80 -0.60 2.40
Blue Bulls 0.67 1.80 -1.10
Cheetahs 0.13 -3.42 3.50
Griquas -11.01 -12.45 1.40
Pumas -11.07 -8.62 -2.40
Cavaliers -12.35 -10.00 -2.30
Kings -15.53 -14.29 -1.20


Performance So Far

So far there have been 15 matches played, 9 of which were correctly predicted, a success rate of 60.0%.
Here are the predictions for last week’s games.

Game Date Score Prediction Correct
1 Kings vs. Western Province Aug 26 6 – 36 -15.60 TRUE
2 Pumas vs. Griquas Aug 26 35 – 41 4.80 FALSE
3 Lions vs. Cavaliers Aug 27 60 – 12 24.00 TRUE
4 Sharks vs. Blue Bulls Aug 27 26 – 19 4.00 TRUE


Predictions for Round 5

Here are the predictions for Round 5. The prediction is my estimated expected points difference with a positive margin being a win to the home team, and a negative margin a win to the away team.

Game Date Winner Prediction
1 Cavaliers vs. Pumas Sep 02 Cavaliers 2.20
2 Cheetahs vs. Kings Sep 02 Cheetahs 19.20
3 Blue Bulls vs. Lions Sep 03 Lions -6.50
4 Western Province vs. Sharks Sep 03 Western Province 7.00