Posts filed under General (3152)

May 26, 2016

What budget coverage should do

It’s unavoidable that the government’s presentation of the Budget will try to make it look good, and the the various opposition replies will try to make it look bad. What journalists can do is translate some of it.

For example, the total health budget is going up $2.2 billion over four years. It’s hard to interpret that, because there are at least four trends involved

  1. Dollars are getting smaller
  2. The population is getting larger
  3. The average age is increasing
  4. There are exciting and overpriced new medications available

It should be fairly easy to say whether the increase in the health budget keeps up with 1 and 2. That gives some idea of how much real per capita increase there is to keep up with 3, and whether extra money allocated for 4 will have to compete with what the budget currently buys.

Media organisations should have someone who can look at 1 and 2, and major media organisations should have been able to get an expert opinion of how big 3 is going to be.

Whether real age-adjusted per-capita NZ health expenditure should be stable, increasing, or decreasing is a policy question that we elect representatives to answer. Whether it is stable, increasing, or decreasing is the sort of fact question that we underpay the media to check for us.
May 25, 2016

Life expectancy quiz

Life expectancy at birth for men in NZ is about 77 years, but life expectancy is more complicated than it sounds


(answers here)

Super 18 Predictions for Round 14

Team Ratings for Round 14

The basic method is described on my Department home page.

Here are the team ratings prior to this week’s games, along with the ratings at the start of the season.

Current Rating Rating at Season Start Difference
Crusaders 10.23 9.84 0.40
Highlanders 7.33 6.80 0.50
Hurricanes 6.75 7.26 -0.50
Chiefs 5.60 2.68 2.90
Waratahs 4.08 4.88 -0.80
Brumbies 2.95 3.15 -0.20
Sharks 2.86 -1.64 4.50
Lions 2.72 -1.80 4.50
Stormers 0.59 -0.62 1.20
Bulls -0.87 -0.74 -0.10
Blues -5.34 -5.51 0.20
Rebels -5.87 -6.33 0.50
Cheetahs -7.27 -9.27 2.00
Jaguares -8.05 -10.00 1.90
Reds -9.34 -9.81 0.50
Force -11.03 -8.43 -2.60
Sunwolves -16.35 -10.00 -6.40
Kings -22.22 -13.66 -8.60


Performance So Far

So far there have been 100 matches played, 72 of which were correctly predicted, a success rate of 72%.
Here are the predictions for last week’s games.

Game Date Score Prediction Correct
1 Crusaders vs. Waratahs May 20 29 – 10 8.90 TRUE
2 Reds vs. Sunwolves May 21 35 – 25 11.20 TRUE
3 Chiefs vs. Rebels May 21 36 – 15 14.70 TRUE
4 Force vs. Blues May 21 13 – 17 -1.40 TRUE
5 Lions vs. Jaguares May 21 52 – 24 13.00 TRUE
6 Sharks vs. Kings May 21 53 – 0 25.30 TRUE
7 Bulls vs. Stormers May 21 17 – 13 1.80 TRUE


Predictions for Round 14

Here are the predictions for Round 14. The prediction is my estimated expected points difference with a positive margin being a win to the home team, and a negative margin a win to the away team.

Game Date Winner Prediction
1 Hurricanes vs. Highlanders May 27 Hurricanes 2.90
2 Waratahs vs. Chiefs May 27 Waratahs 2.50
3 Kings vs. Jaguares May 27 Jaguares -10.20
4 Blues vs. Crusaders May 28 Crusaders -12.10
5 Brumbies vs. Sunwolves May 28 Brumbies 23.30
6 Stormers vs. Cheetahs May 28 Stormers 11.40
7 Bulls vs. Lions May 28 Lions -0.10
8 Rebels vs. Force May 29 Rebels 8.70


NRL Predictions for Round 12

Team Ratings for Round 12

The basic method is described on my Department home page.

Here are the team ratings prior to this week’s games, along with the ratings at the start of the season.

Current Rating Rating at Season Start Difference
Broncos 12.27 9.81 2.50
Cowboys 11.90 10.29 1.60
Storm 7.33 4.41 2.90
Sharks 6.19 -1.06 7.20
Bulldogs 2.97 1.50 1.50
Roosters 1.29 11.20 -9.90
Raiders 1.12 -0.55 1.70
Eels 0.22 -4.62 4.80
Rabbitohs -0.34 -1.20 0.90
Panthers -0.43 -3.06 2.60
Sea Eagles -0.48 0.36 -0.80
Dragons -3.79 -0.10 -3.70
Titans -4.16 -8.39 4.20
Warriors -7.72 -7.47 -0.30
Wests Tigers -8.95 -4.06 -4.90
Knights -15.75 -5.41 -10.30


Performance So Far

So far there have been 88 matches played, 51 of which were correctly predicted, a success rate of 58%.
Here are the predictions for last week’s games.

Game Date Score Prediction Correct
1 Rabbitohs vs. Dragons May 19 34 – 24 2.40 TRUE
2 Cowboys vs. Broncos May 20 19 – 18 2.90 TRUE
3 Wests Tigers vs. Knights May 21 20 – 12 10.10 TRUE
4 Warriors vs. Raiders May 21 12 – 38 -1.50 TRUE
5 Sharks vs. Sea Eagles May 21 20 – 12 10.00 TRUE
6 Panthers vs. Titans May 22 24 – 28 8.50 FALSE
7 Bulldogs vs. Roosters May 22 32 – 20 3.50 TRUE
8 Eels vs. Storm May 23 6 – 18 -2.80 TRUE


Predictions for Round 12

Here are the predictions for Round 12. The prediction is my estimated expected points difference with a positive margin being a win to the home team, and a negative margin a win to the away team.

Game Date Winner Prediction
1 Broncos vs. Wests Tigers May 27 Broncos 24.20
2 Dragons vs. Cowboys May 28 Cowboys -12.70
3 Raiders vs. Bulldogs May 29 Raiders 1.10
4 Knights vs. Eels May 30 Eels -13.00


May 22, 2016

Knowing what you’re predicting

From a Sydney Morning Herald story about brain wave reading.

The faux insurgents were asked to hatch a mock terrorist plot by selecting one of four dates in July, one of four locations in Houston and one of four types of bomb, then jot it all down in a letter to their terrorist boss.

EEG caps on, they were later shown a slew of months of the year, US cities and varieties of terror attack on a computer; and when “July”, “Houston” and “bomb” appeared among them, the P300 spikes were big enough to nab all 12 “culprits”.

The brain fingerprinting technique relies on picking up a signal that the brain recognises some piece of information. The people who make the gadgetry claim this can be done with 100% accuracy (not everyone agrees). However, even if the brain waves can be picked up with 100% accuracy, that’s not 100% accuracy for the real question.

Consider DNA evidence. In the ideal case of a high-quality DNA sample from the scene of a crime, and a high-quality sample from a suspect, and the right combination of ancestries, it is possible to be almost 100% sure that the suspect’s DNA (or that of an identical twin) is present in the crime sample. The scene-of-crime sample could be billions of times more likely if the suspect contributed to it than if a random person from the population did. The DNA expert won’t (or shouldn’t) testify that the suspect is almost certainly guilty, because that’s not a DNA question. Even ruling out police fraud or incompetence, the suspect’s DNA could have present in the sample for some innocent reason. Guilt is not a question that capillary electrophoresis can answer.

The situation is worse for the brain fingerprinting technique, because it’s intended to be used before a terrorist attack has been committed, and potentially before the suspects have even committed a crime such as conspiracy.  Maybe they recognised an attack plan because they’d been thinking about it, or because they’d read a Tom Clancy novel about it. Maybe they recognised “July” and “Houston” from baseball and the bomb from somewhere else entirely.  None of these would be counted as an error by the brain wave enthusiasts — they are entirely genuine indications of recognition — but they aren’t specific evidence of past or future crime.


May 20, 2016

Briefly

  • The Princeton Web CensusToday I’m pleased to release initial analysis results from our monthly, 1-million-site measurement. This is the largest and most detailed measurement of online tracking to date, including measurements for stateful (cookie-based) and stateless (fingerprinting-based) tracking, the effect of browser privacy tools, and “cookie syncing”.  These results represent a snapshot of web tracking, but the analysis is part of an effort to collect data on a monthly basis and analyze the evolution of web tracking and privacy over time.”
  • Nate Silver on TwitterAn irony is that our early Trump forecasts weren’t based on a statistical model. Just a guesstimate that I got stubborn anchoring myself to. So one lesson is “when in doubt, build a model”. Doesn’t have to be your final answer. But it’s a great starting point. Provides discipline.”
  • From Flowing Data, a visualisation of the changing US diet
  • A visualisation of 24 hours of data flow in a health insurance company: pretty, but not necessarily useful
  • “Mukherjee gives us a Whig history of the gene, told with verve and color, if not scrupulous accuracy. “ A book review/essay at the Atlantic, by Nathaniel Comfort
  • There’s a new White House report on Big Data and Civil RightsUsing case studies on credit lending, employment, higher education, and criminal justice, the report we are releasing today illustrates how big data techniques can be used to detect bias and prevent discrimination. It also demonstrates the risks involved, particularly how technologies can deliberately or inadvertently perpetuate, exacerbate, or mask discrimination.” (via mathbabe.org)
May 18, 2016

Super 18 Predictions for Round 13

Team Ratings for Round 13

The basic method is described on my Department home page.

Here are the team ratings prior to this week’s games, along with the ratings at the start of the season.

Current Rating Rating at Season Start Difference
Crusaders 9.63 9.84 -0.20
Highlanders 7.33 6.80 0.50
Hurricanes 6.75 7.26 -0.50
Chiefs 5.22 2.68 2.50
Waratahs 4.69 4.88 -0.20
Brumbies 2.95 3.15 -0.20
Lions 1.82 -1.80 3.60
Sharks 1.19 -1.64 2.80
Stormers 0.72 -0.62 1.30
Bulls -1.01 -0.74 -0.30
Rebels -5.49 -6.33 0.80
Blues -5.50 -5.51 0.00
Jaguares -7.15 -10.00 2.80
Cheetahs -7.27 -9.27 2.00
Reds -9.27 -9.81 0.50
Force -10.87 -8.43 -2.40
Sunwolves -16.42 -10.00 -6.40
Kings -20.56 -13.66 -6.90


Performance So Far

So far there have been 93 matches played, 65 of which were correctly predicted, a success rate of 69.9%.
Here are the predictions for last week’s games.

Game Date Score Prediction Correct
1 Highlanders vs. Crusaders May 13 34 – 26 0.30 TRUE
2 Rebels vs. Brumbies May 13 22 – 30 -4.50 TRUE
3 Hurricanes vs. Reds May 14 29 – 14 20.70 TRUE
4 Waratahs vs. Bulls May 14 31 – 8 7.90 TRUE
5 Sunwolves vs. Stormers May 14 17 – 17 -14.90 FALSE
6 Cheetahs vs. Kings May 14 34 – 20 17.20 TRUE
7 Lions vs. Blues May 14 43 – 5 7.70 TRUE
8 Jaguares vs. Sharks May 14 22 – 25 -4.50 TRUE


Predictions for Round 13

Here are the predictions for Round 13. The prediction is my estimated expected points difference with a positive margin being a win to the home team, and a negative margin a win to the away team.

Game Date Winner Prediction
1 Crusaders vs. Waratahs May 20 Crusaders 8.90
2 Reds vs. Sunwolves May 21 Reds 11.20
3 Chiefs vs. Rebels May 21 Chiefs 14.70
4 Force vs. Blues May 21 Blues -1.40
5 Lions vs. Jaguares May 21 Lions 13.00
6 Sharks vs. Kings May 21 Sharks 25.30
7 Bulls vs. Stormers May 21 Bulls 1.80


NRL Predictions for Round 11

Team Ratings for Round 11

The basic method is described on my Department home page.

Here are the team ratings prior to this week’s games, along with the ratings at the start of the season.

Current Rating Rating at Season Start Difference
Broncos 12.11 9.81 2.30
Cowboys 12.06 10.29 1.80
Storm 6.67 4.41 2.30
Sharks 6.35 -1.06 7.40
Bulldogs 2.36 1.50 0.90
Roosters 1.90 11.20 -9.30
Eels 0.88 -4.62 5.50
Panthers 0.45 -3.06 3.50
Raiders -0.55 -0.55 0.00
Sea Eagles -0.64 0.36 -1.00
Rabbitohs -0.89 -1.20 0.30
Dragons -3.24 -0.10 -3.10
Titans -5.04 -8.39 3.30
Warriors -6.04 -7.47 1.40
Wests Tigers -8.78 -4.06 -4.70
Knights -15.92 -5.41 -10.50


Performance So Far

So far there have been 80 matches played, 44 of which were correctly predicted, a success rate of 55%.
Here are the predictions for last week’s games.

Game Date Score Prediction Correct
1 Dragons vs. Raiders May 12 16 – 12 -0.40 FALSE
2 Eels vs. Rabbitohs May 13 20 – 22 5.90 FALSE
3 Panthers vs. Warriors May 14 30 – 18 5.60 TRUE
4 Storm vs. Cowboys May 14 15 – 14 -6.50 FALSE
5 Broncos vs. Sea Eagles May 14 30 – 6 14.40 TRUE
6 Knights vs. Sharks May 15 0 – 62 -12.80 TRUE
7 Wests Tigers vs. Bulldogs May 15 4 – 36 -7.80 TRUE
8 Titans vs. Roosters May 16 26 – 6 -7.70 FALSE


Predictions for Round 11

Here are the predictions for Round 11. The prediction is my estimated expected points difference with a positive margin being a win to the home team, and a negative margin a win to the away team.

Game Date Winner Prediction
1 Rabbitohs vs. Dragons May 19 Rabbitohs 2.40
2 Cowboys vs. Broncos May 20 Cowboys 2.90
3 Wests Tigers vs. Knights May 21 Wests Tigers 10.10
4 Warriors vs. Raiders May 21 Raiders -1.50
5 Sharks vs. Sea Eagles May 21 Sharks 10.00
6 Panthers vs. Titans May 22 Panthers 8.50
7 Bulldogs vs. Roosters May 22 Bulldogs 3.50
8 Eels vs. Storm May 23 Storm -2.80


May 17, 2016

Housing prices, SF edition

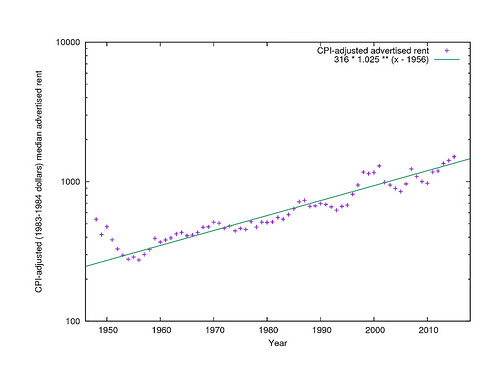
Eric Fischer set out to look at rental price trends in San Francisco. The standard dataset goes back only to 1979, which was also the start of rent control. Most people would have stopped there. But no:

I set out to replicate the DataBook’s methodology over a wider range of years, … Mostly I used the San Francisco Public Library’s page scans of the newspaper but resorted to microfilm for the few later years where no page scans are available.

That is, he copied down and entered the prices from the ads by hand.

There has been a remarkable constant trend in SF rental prices since the mid-1950s, with median real prices increasing steadily by 2.5%/year, decade after decade.26941938971_ea9415db14

For the years since 1975, when employment data are available, most of the deviations from this trend can be explained by increases or decreases in numbers of homes in the city, increases or decreases in number of jobs, and increases or decreases in total real salaries and wages paid (specifically salaries and wages, not all income).

Rent control didn’t have a big impact. Speculation didn’t have a big impact — prices were higher during the boom of the 1990s, but only as much as would be expected from more people in the city and the higher salaries and wages they were paid.

San Francisco County already has a population density of over 7000 people per square km — lower than the Auckland CBD, but higher than anywhere else in Auckland. It’s hard for them to increase supply enough to reduce prices, but they might manage to increase supply enough to stabilise prices.

(via Michael Andersen and @BarbsNZgarden)

Briefly

  • You’ve probably seen this, but Facebook’s news feed editing wasn’t as algorithmic as they were suggesting. Of course, that tells you nothing one way or the other about bias, as people including Cathy O’Neil point out.
  • The difficulties of turning data science into gobs and gobs of money, as illustrated by Palantir. From Roger Peng at Simply Statistics.
  • Finally for stats/literature dual nerds, an excerpt from the new book by historian of statistics Stephen Stigler