Posts filed under General (3156)

September 23, 2015

Briefly

  • Properly conducted web-based surveys aren’t necessarily that bad (from Pew Research) “Of 406 separate estimates taken from nine waves of the American Trends Panel, just nine of them differed by 5 percentage points or more. Perhaps not surprisingly, all nine are related to internet or digital technology use. A Web-only survey estimated that 82% of the public uses the internet on a daily basis, while the full sample (including non-internet users) finds 69% go online daily.”
  • Aardwolf Research is doing a flag-preference poll (mentioned in Stuff).  On the good side, they have sensible ways of looking at lots of possible flags. On the bad side, we don’t have lots of possible flags any more. On the good side they collect demographic data that could be used to get fairly representative weighted results from their self-selected internet sample. On the bad side, their results from the first wave don’t seem to use the demographic data at all.

Expensive drugs for a different reason

Usually, when there’s a very expensive medication in the news it’s because some company has just invented it and is trying to make as much money as possible before there’s competition– either from other similar drugs or from generic versions.   This is (presumably) the issue that Hillary Clinton is planning to address. The manufacturer is charging all the market will bear, but it’s not precisely a case of the uncaring free market. The drugs can only be that expensive because the government deliberately gives one company a monopoly, which we do as a strategy by society to bribe companies to invent drugs that work.  Like lots of people, I think the details could be improved but the basic idea is sensible.

Yesterday’s story (Stuff, Herald) is somewhat different. An existing, off-patent, treatment is having its price jacked up enormously. It’s about 50 times what it was recently, and 750 times what it was in 2010 when the drug was owned by a huge multinational, GSK. Derek Lowe (a drug company chemist) has some good posts about this. I’m mostly summarising.

There have been a few of these cases over the past few years, with different mechanisms.  The first is a well-meaning but poorly-designed idea of the FDA to collect evidence about drugs that were already in use when effectiveness testing was brought in. For some of these drugs, knowing whether (or how well) they actually work would be valuable. In return for doing the clinical trials to modern standards, a company can get a period of ‘marketing exclusivity’ on an old off-patent drug. Unfortunately, a company can pick up a drug where there isn’t any real doubt about effectiveness, so the trials provide little benefit, and then raise the price through the roof.

The second approach is to pick a drug that has no alternatives but where the total market is small enough that getting through the FDA approval process even for a generic is enough of an obstacle to keep out competitors.  One of the recent stories was about cycloserine, a last-ditch treatment for drug-resistant tuberculosis. There are still very few cases of this in the US — about 90 per year — so even a twenty-fold price increase doesn’t open up much of a market opportunity. The regulatory problem here is the impact of high standards for demonstrating manufacturing safety. Ordinarily that’s something you want, but for very rare diseases it provides a barrier to competition.

The third mechanism really looks like a regulatory loophole, and that’s what just happened with Daraprim for treating toxoplasmosis. The active ingredient of Daraprim, pyrimethamine, is off patent. There isn’t any FDA marketing exclusivity, either. But you can’t sell it as a drug unless you show that your formulation of pyrimethamine delivers a sufficiently-similar dose with sufficiently-similar timing to the formulation that was originally approved.

Toxoplasmosis isn’t as rare as drug-resistant TB, and historically the idea was that  an attempt to charge extortionate prices couldn’t work because someone would make a generic competitor. The trick is that you would need a supply of Daraprim to show that your formulation is close enough. You can’t do that if they won’t sell it to you.

As a concept, this goes back to a lawsuit over thalidomide (which now has a couple of genuine medical uses). One US company, Celgene, had the patent. Another company, Lannett, wanted to buy some of their drug to do bioequivalence studies, and claimed Celgene was refusing only to block competition. Celgene claimed they were just worried about Lannett’s safety procedures — which, in the case of thalidomide, could be fair enough.  They settled the case and it doesn’t really matter who was right; whether Lannett was paranoid or Celgene was cheating the system, the idea was out.

Rugby World Cup Predictions for Week 2

Team Ratings for Week 2

The basic method is described on my Department home page.

Here are the team ratings prior to this week’s games, along with the ratings at the start of the Rugby World Cup.

Current Rating Rating at RWC Start Difference
New Zealand 28.37 29.01 -0.60
South Africa 21.15 22.73 -1.60
Australia 20.36 20.36 0.00
Ireland 18.15 17.48 0.70
England 18.04 18.51 -0.50
Wales 13.35 13.93 -0.60
France 12.10 11.70 0.40
Argentina 8.02 7.38 0.60
Scotland 4.84 4.84 -0.00
Samoa -2.71 -2.28 -0.40
Fiji -3.76 -4.23 0.50
Italy -6.26 -5.86 -0.40
Tonga -7.23 -6.31 -0.90
Japan -9.60 -11.18 1.60
USA -15.54 -15.97 0.40
Georgia -16.56 -17.48 0.90
Canada -18.73 -18.06 -0.70
Romania -21.20 -21.20 -0.00
Uruguay -30.46 -31.04 0.60
Namibia -35.62 -35.62 -0.00


Performance So Far

So far there have been 8 matches played, 6 of which were correctly predicted, a success rate of 75%.
Here are the predictions for last week’s games.

Game Date Score Prediction Correct
1 England vs. Fiji Sep 18 35 – 11 29.20 TRUE
2 Tonga vs. Georgia Sep 19 10 – 17 11.20 FALSE
3 Ireland vs. Canada Sep 19 50 – 7 35.50 TRUE
4 South Africa vs. Japan Sep 19 32 – 34 33.90 FALSE
5 France vs. Italy Sep 19 32 – 10 17.60 TRUE
6 Samoa vs. USA Sep 20 25 – 16 13.70 TRUE
7 Wales vs. Uruguay Sep 20 54 – 9 51.50 TRUE
8 New Zealand vs. Argentina Sep 20 26 – 16 21.60 TRUE


Predictions for Week 2

Here are the predictions for Week 2. The prediction is my estimated expected points difference with a positive margin being a win to the first-named team, and a negative margin a win to the second-named team.

Game Date Winner Prediction
1 Scotland vs. Japan Sep 23 Scotland 14.40
2 Australia vs. Fiji Sep 23 Australia 24.10
3 France vs. Romania Sep 23 France 33.30
4 New Zealand vs. Namibia Sep 24 New Zealand 64.00
5 Argentina vs. Georgia Sep 25 Argentina 24.60
6 Italy vs. Canada Sep 26 Italy 12.50
7 South Africa vs. Samoa Sep 26 South Africa 23.90
8 England vs. Wales Sep 26 England 11.20


NRL Predictions for the Preliminary Finals

Team Ratings for the Preliminary Finals

The basic method is described on my Department home page.

Here are the team ratings prior to this week’s games, along with the ratings at the start of the season.

Current Rating Rating at Season Start Difference
Roosters 13.13 9.09 4.00
Cowboys 9.47 9.52 -0.10
Broncos 8.88 4.03 4.80
Storm 6.15 4.36 1.80
Bulldogs 1.51 0.21 1.30
Sea Eagles 0.46 2.68 -2.20
Dragons -0.09 -1.74 1.60
Rabbitohs -0.24 13.06 -13.30
Raiders -1.13 -7.09 6.00
Sharks -1.65 -10.76 9.10
Panthers -2.78 3.69 -6.50
Eels -5.07 -7.19 2.10
Wests Tigers -5.16 -13.13 8.00
Knights -5.46 -0.28 -5.20
Warriors -7.47 3.07 -10.50
Titans -9.20 -8.20 -1.00


Performance So Far

So far there have been 198 matches played, 117 of which were correctly predicted, a success rate of 59.1%.
Here are the predictions for last week’s games.

Game Date Score Prediction Correct
1 Roosters vs. Bulldogs Sep 18 38 – 12 12.80 TRUE
2 Cowboys vs. Sharks Sep 19 39 – 0 10.20 TRUE


Predictions for the Preliminary Finals

Here are the predictions for the Preliminary Finals. The prediction is my estimated expected points difference with a positive margin being a win to the home team, and a negative margin a win to the away team.

Game Date Winner Prediction
1 Broncos vs. Roosters Sep 25 Roosters -1.20
2 Storm vs. Cowboys Sep 26 Cowboys -0.30


ITM Cup Predictions for Round 7

Team Ratings for Round 7

The basic method is described on my Department home page.

Here are the team ratings prior to this week’s games, along with the ratings at the start of the season.

Current Rating Rating at Season Start Difference
Canterbury 13.67 10.90 2.80
Tasman 11.53 12.86 -1.30
Taranaki 10.21 7.70 2.50
Auckland 7.35 5.14 2.20
Hawke’s Bay 3.83 -0.57 4.40
Wellington 3.66 -4.62 8.30
Counties Manukau 1.06 7.86 -6.80
Otago -2.63 -4.84 2.20
Waikato -6.67 -6.96 0.30
Southland -7.11 -6.01 -1.10
Manawatu -7.82 -1.52 -6.30
Bay of Plenty -7.94 -9.77 1.80
North Harbour -8.78 -10.54 1.80
Northland -14.35 -3.64 -10.70


Performance So Far

So far there have been 46 matches played, 32 of which were correctly predicted, a success rate of 69.6%.
Here are the predictions for last week’s games.

Game Date Score Prediction Correct
1 Tasman vs. North Harbour Sep 16 39 – 20 29.30 TRUE
2 Wellington vs. Otago Sep 17 36 – 37 12.80 FALSE
3 Taranaki vs. Waikato Sep 18 41 – 0 16.50 TRUE
4 Hawke’s Bay vs. Bay of Plenty Sep 19 23 – 17 17.90 TRUE
5 Southland vs. Manawatu Sep 19 49 – 14 -1.90 FALSE
6 Northland vs. Counties Manukau Sep 19 17 – 42 -8.40 TRUE
7 North Harbour vs. Canterbury Sep 20 10 – 17 -21.90 TRUE
8 Tasman vs. Auckland Sep 20 19 – 28 12.90 FALSE


Predictions for Round 7

Here are the predictions for Round 7. The prediction is my estimated expected points difference with a positive margin being a win to the home team, and a negative margin a win to the away team.

Game Date Winner Prediction
1 Canterbury vs. Waikato Sep 23 Canterbury 24.30
2 Hawke’s Bay vs. Auckland Sep 24 Hawke’s Bay 0.50
3 Northland vs. Bay of Plenty Sep 25 Bay of Plenty -2.40
4 Counties Manukau vs. Tasman Sep 26 Tasman -6.50
5 Otago vs. Southland Sep 26 Otago 8.50
6 Manawatu vs. North Harbour Sep 26 Manawatu 5.00
7 Waikato vs. Wellington Sep 27 Wellington -6.30
8 Canterbury vs. Taranaki Sep 27 Canterbury 7.50


Currie Cup Predictions for Round 8

Team Ratings for Round 8

The basic method is described on my Department home page.

Here are the team ratings prior to this week’s games, along with the ratings at the start of the season.

Current Rating Rating at Season Start Difference
Lions 5.01 3.04 2.00
Western Province 4.92 4.93 -0.00
Blue Bulls 1.54 0.17 1.40
Sharks 1.46 3.43 -2.00
Cheetahs -1.59 -1.75 0.20
Pumas -6.55 -6.47 -0.10
Griquas -9.20 -7.81 -1.40
Kings -9.48 -9.44 -0.00


Performance So Far

So far there have been 28 matches played, 20 of which were correctly predicted, a success rate of 71.4%.
Here are the predictions for last week’s games.

Game Date Score Prediction Correct
1 Pumas vs. Kings Sep 18 20 – 9 5.90 TRUE
2 Western Province vs. Blue Bulls Sep 18 29 – 14 6.40 TRUE
3 Lions vs. Sharks Sep 19 26 – 18 6.90 TRUE
4 Cheetahs vs. Griquas Sep 19 44 – 24 10.60 TRUE


Predictions for Round 8

Here are the predictions for Round 8. The prediction is my estimated expected points difference with a positive margin being a win to the home team, and a negative margin a win to the away team.

Game Date Winner Prediction
1 Sharks vs. Blue Bulls Sep 25 Sharks 3.40
2 Cheetahs vs. Lions Sep 26 Lions -3.10
3 Western Province vs. Pumas Sep 26 Western Province 15.00
4 Kings vs. Griquas Sep 26 Kings 3.20


September 22, 2015

Minimum, median

From the Herald

Auckland renters can expect to pay a minimum $400 a week – regardless of property type or size, according to Trade Me Property’s monthly report on median rents across New Zealand.

From a quick TradeMe search for Auckland rentals, with an upper limit of $350 a week: 525 listings.

trademe

What they mean is that the median is at least $400/week in every category of property type or size, not the minimum.  That’s a bit clearer from the press release, which has data tables that the Herald didn’t print, but even that starts

A property renter in Auckland can now expect to pay $400 per week regardless of property size or type


September 21, 2015

Dominating social media?

dominating

No. No, it isn’t.

According to my searches, maybe half a dozen people asked a version of that question before the Herald headline turned up. If you count the retweets and favourites you might possibly get to twenty.

As a failure to actually search, this might beat the Netsafe CTO saying, a couple of years ago

You type ‘kiwi chicks’ into Google and the images that come back won’t be small feathered birds.”


It’s bad enough without exaggerating

This UK survey report is being a bit loose with the details, in a situation where that’s not even needed

stem for boys

The survey of more than 4,000 girls, young women, parents and teachers, demonstrates clearly that there is a perception that STEM subjects and careers are better suited to male personalities, hobbies and brains. Half (51 percent) of the teachers and 43 percent of the parents surveyed believe this perception helps explain the low uptake of STEM subjects by girls. [emphasis added]

Those aren’t the same thing at all.  I believe this perception helps explain the low uptake of STEM subjects by girls. Michelle ‘Nanogirl’ Dickinson believes this perception helps explain the low uptake of STEM subjects by girls. It’s worrying that nearly more than half of UK teachers don’t believe this perception helps explain the low uptake of STEM subjects by girls.

On the other hand, this is depressing and actually does seem to be what the survey said:

Nearly half (47 percent) of the young girls surveyed said they believe such subjects are a better match for boys.

as does this

difficult subjects It would fit with NZ experience if a lot of boys felt the same about the difficulty of science and maths, but that wouldn’t actually make it any better.


September 17, 2015

Kids these days

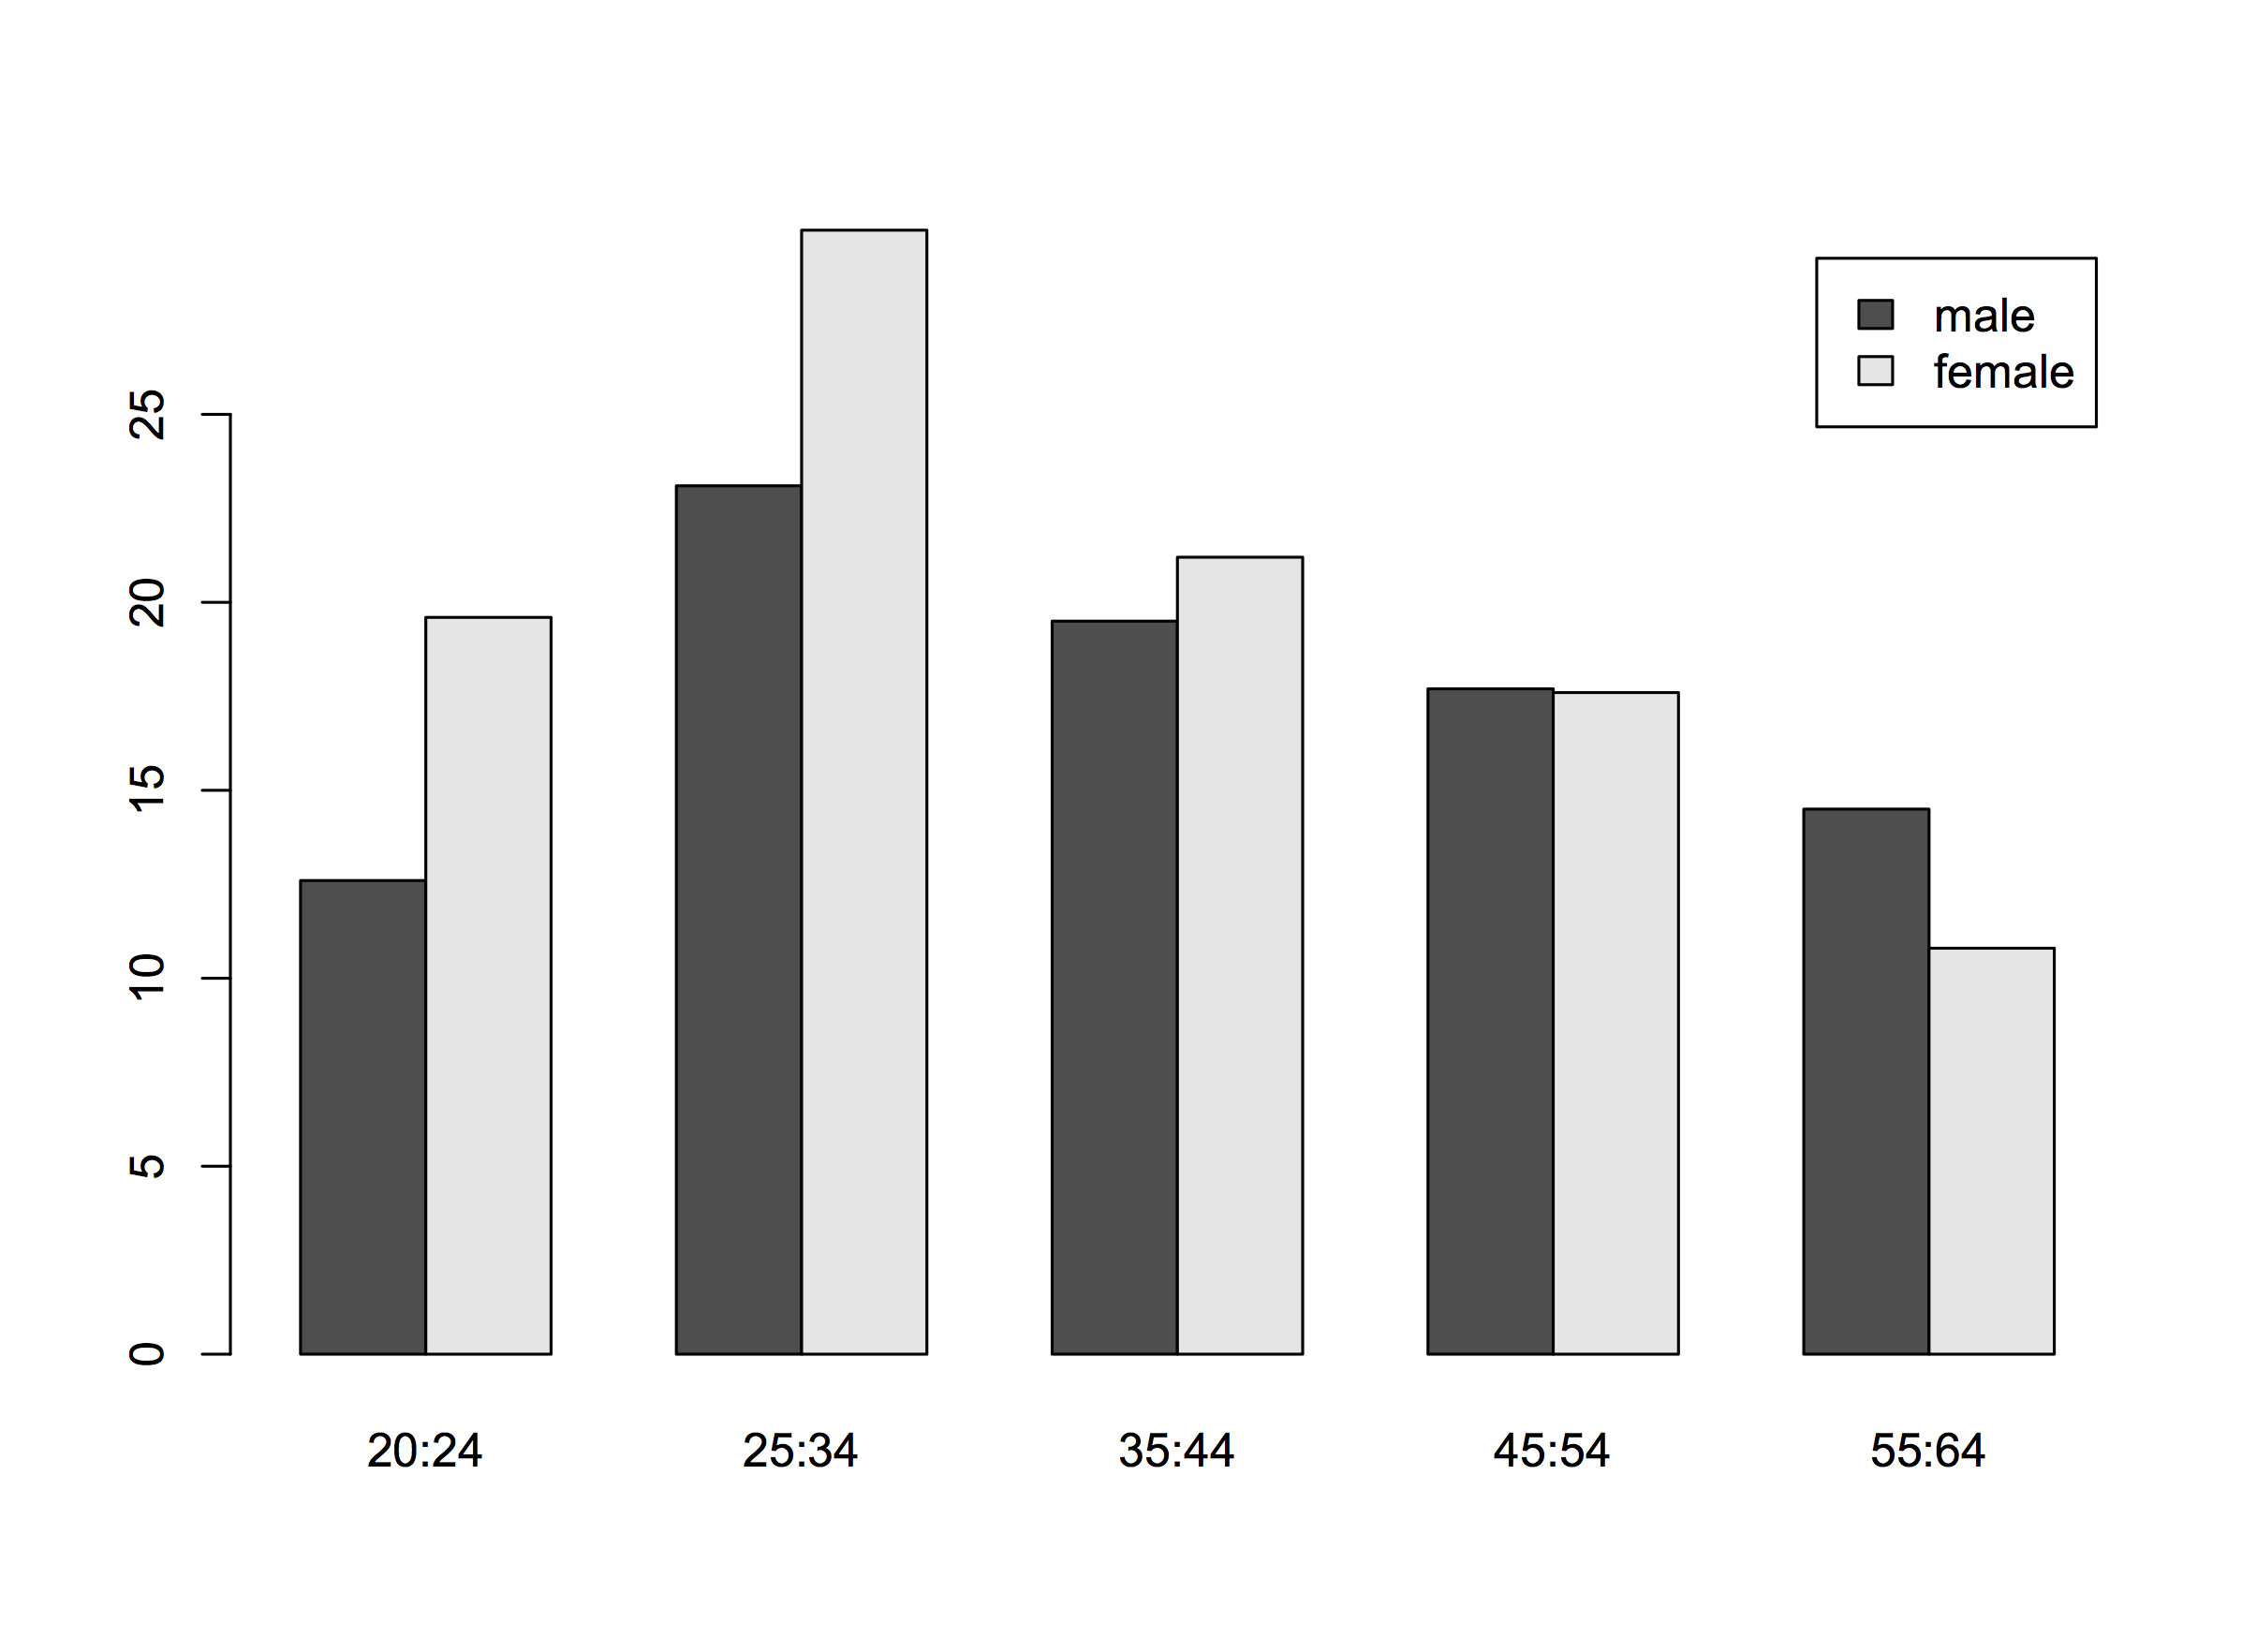
I made this graph for a lecture on longitudinal data, then thought I’d share it. It shows the percentage of New Zealanders with post-secondary qualifications, by age and sex (data from 2006). The proportion with qualifications goes down after age 35.

age-cohort-degree

Obviously NZ universities aren’t taking people’s degrees away (except occasionally), so as individual get older, their qualifications either stay the same or increase. The downward trend is a cohort effect — people born in the 1950s are less likely to end up with post-secondary qualifications than people born in the 1970s.  Ten years earlier, the proportion in the 25-34 age group was 14.7% for men and 13.1% for women, so this cohort of people, now 35-44, do have more qualifications than they did ten years ago.

In this case the explanation is obvious, but often news stories talk about Kids These Days and how they should, eg, Get Off Our Lawns The Internet. After checking that the trend is real (a disturbingly important step) it’s worth asking whether the story’s attribution of the problem to age effects or cohort effects is right.