Posts filed under General (3156)

April 7, 2015

Briefly

  • NPR’s Science Friday covers BAHfest, a competition to produce what look like scientific arguments for nutty conclusions. Hilarious, but also important: serious and scammy pseudoscience uses the same tricks.
  • Emma Pierson, a scientist who studies dating analyses a year of emails with her boyfriend
    Him
    : You’re going to find some weird pattern and break up with me.

    Me: Either that will be warranted by the data, in which case it’s a good thing, or it won’t, in which case I’m a bad statistician. Are you saying I’m a bad statistician?

  • And a post by Emma Pierson at 538.com: “people just want to date themselves”
  • Another story about changes in cancer risk that just uses number of diagnoses, without even gesturing in the direction of screening bias.

What’s wrong with this picture?

So, I was on a plane from Sydney yesterday that was old enough they told us to switch off our books half an hour before landing. As a result, I actually looked at the Auckland information on the flight map channel (photo taken after we were allowed technology, naturally):

CB6H2HkUoAAnW3i

It’s interesting to see where these numbers come from, given all the different ways these things can be defined. Two of these numbers are inconsistent with each other and somewhat obsolete, and the third isn’t even wrong.

According to the Google, the population number 1,377,200 is the June 2011 estimate of the urban population of the Auckland metropolitan area.  Ok, that’s a bit old but so was the plane. Slightly more strange is that StatsNZ thinks the urban Auckland population at 30 June 2011 was 1,351,200, but that’s probably a matter of projections being made in advance and then adjusted as more information comes in. The current (June 2014) estimate is 1,413,500.

So if the population is urban Auckland, what’s the area? With a bit of searching, you can find it’s the area of the old Auckland City, the central Auckland isthmus plus various islands. Auckland City had a population of 450,000 when it was absorbed into the Supercity in 2010. The population and area numbers are for very different entities, and the population number, although old, dates from after the area number became completely obsolete.

The area that goes with the 1,377,200 number is 1,102.9km2, the size of the Statistical Urban Area. You could reasonably want the urbanised area (483km2) or the Metropolitan Urban Limits (560km2) as better summaries of the size of Auckland, but they don’t match the quoted population.

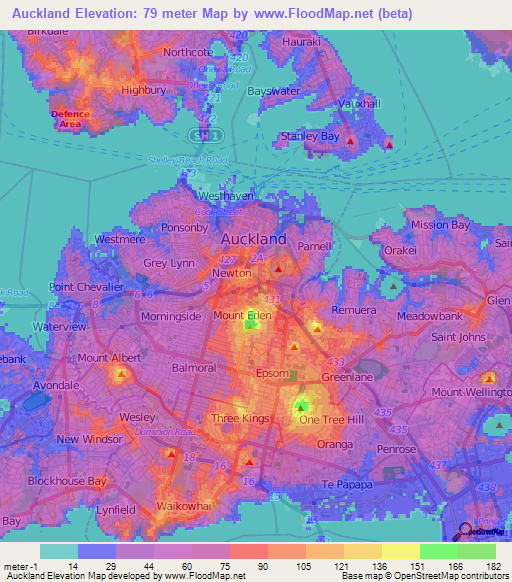
That leaves elevation. The picture next to the statistics shows that 78m is not a completely satisfactory characterisation of the elevation of Auckland. The blue stuff with boats floating on it is at sea level (up to tidal variation). Here’s a map (from FloodMap.net) of Auckland elevation; the change from pink to red is at 75m.
www.floodmap

Overall, population and area, which could have multiple satisfactory definitions, are defined incompatibly with each other.  Elevation doesn’t really have a satisfactory definition, but isn’t 78m.

 

April 1, 2015

NRL Predictions for Round 5

Team Ratings for Round 5

The basic method is described on my Department home page.

Here are the team ratings prior to this week’s games, along with the ratings at the start of the season.

Current Rating Rating at Season Start Difference
Rabbitohs 11.79 13.06 -1.30
Roosters 11.30 9.09 2.20
Cowboys 4.98 9.52 -4.50
Storm 4.64 4.36 0.30
Broncos 4.61 4.03 0.60
Panthers 4.41 3.69 0.70
Warriors 2.15 3.07 -0.90
Knights 1.72 -0.28 2.00
Bulldogs 1.03 0.21 0.80
Sea Eagles -0.61 2.68 -3.30
Dragons -3.09 -1.74 -1.40
Eels -3.63 -7.19 3.60
Raiders -7.94 -7.09 -0.90
Wests Tigers -9.21 -13.13 3.90
Titans -9.71 -8.20 -1.50
Sharks -11.11 -10.76 -0.40


Performance So Far

So far there have been 32 matches played, 19 of which were correctly predicted, a success rate of 59.4%.

Here are the predictions for last week’s games.

Game Date Score Prediction Correct
1 Eels vs. Rabbitohs Mar 27 29 – 16 -16.40 FALSE
2 Wests Tigers vs. Bulldogs Mar 27 24 – 25 -8.30 TRUE
3 Dragons vs. Sea Eagles Mar 28 12 – 4 -0.70 FALSE
4 Knights vs. Panthers Mar 28 26 – 14 -1.60 FALSE
5 Sharks vs. Titans Mar 28 22 – 24 2.20 FALSE
6 Roosters vs. Raiders Mar 29 34 – 6 21.30 TRUE
7 Warriors vs. Broncos Mar 29 16 – 24 3.10 FALSE
8 Cowboys vs. Storm Mar 30 18 – 17 3.80 TRUE


Predictions for Round 5

Here are the predictions for Round 5. The prediction is my estimated expected points difference with a positive margin being a win to the home team, and a negative margin a win to the away team.

Game Date Winner Prediction
1 Bulldogs vs. Rabbitohs Apr 03 Rabbitohs -7.80
2 Titans vs. Broncos Apr 03 Broncos -11.30
3 Knights vs. Dragons Apr 04 Knights 7.80
4 Sea Eagles vs. Raiders Apr 04 Sea Eagles 10.30
5 Roosters vs. Sharks Apr 05 Roosters 25.40
6 Eels vs. Wests Tigers Apr 06 Eels 8.60
7 Panthers vs. Cowboys Apr 06 Panthers 2.40
8 Storm vs. Warriors Apr 06 Storm 6.50


Super 15 Predictions for Round 8

Team Ratings for Round 8

The basic method is described on my Department home page.

Here are the team ratings prior to this week’s games, along with the ratings at the start of the season.

Current Rating Rating at Season Start Difference
Crusaders 8.34 10.42 -2.10
Waratahs 8.34 10.00 -1.70
Hurricanes 6.07 2.89 3.20
Brumbies 4.50 2.20 2.30
Chiefs 3.86 2.23 1.60
Bulls 2.95 2.88 0.10
Sharks 2.26 3.91 -1.70
Stormers 1.68 1.68 -0.00
Blues 0.02 1.44 -1.40
Highlanders -0.23 -2.54 2.30
Lions -3.78 -3.39 -0.40
Force -4.56 -4.67 0.10
Cheetahs -7.05 -5.55 -1.50
Rebels -7.53 -9.53 2.00
Reds -7.87 -4.98 -2.90


Performance So Far

So far there have been 47 matches played, 31 of which were correctly predicted, a success rate of 66%.

Here are the predictions for last week’s games.

Game Date Score Prediction Correct
1 Hurricanes vs. Rebels Mar 27 36 – 12 17.20 TRUE
2 Reds vs. Lions Mar 27 17 – 18 0.70 FALSE
3 Chiefs vs. Cheetahs Mar 28 37 – 27 16.30 TRUE
4 Highlanders vs. Stormers Mar 28 39 – 21 0.50 TRUE
5 Waratahs vs. Blues Mar 28 23 – 11 13.00 TRUE
6 Sharks vs. Force Mar 28 15 – 9 12.20 TRUE
7 Bulls vs. Crusaders Mar 28 31 – 19 -2.70 FALSE


Predictions for Round 8

Here are the predictions for Round 8. The prediction is my estimated expected points difference with a positive margin being a win to the home team, and a negative margin a win to the away team.

Game Date Winner Prediction
1 Hurricanes vs. Stormers Apr 03 Hurricanes 8.90
2 Rebels vs. Reds Apr 03 Rebels 4.30
3 Chiefs vs. Blues Apr 04 Chiefs 7.80
4 Brumbies vs. Cheetahs Apr 04 Brumbies 16.00
5 Sharks vs. Crusaders Apr 04 Crusaders -1.60
6 Lions vs. Bulls Apr 04 Bulls -2.70


March 31, 2015

Beautiful and trustworthy

The Herald has pictures of the most beautiful faces in the world

BEAUTIFUL-FACES_3249636b_620x310

and NPR reports on a computer algorithm that can tell if you sound trustworthy or calming or engaging.

The Herald story at least admits these faces are only world-famous in New Zealand (or, rather, the UK)

“It’s important to note that these are the idealised faces according to those living in the UK, so a study in Asia or Africa for example would no doubt have different results.”

The NPR story instead doubles down by saying

But algorithms have stamina, and they do not factor in things like age, race, gender or sexual orientation.

There’s a sense in which this is true, but it’s not a very useful sense. If we can guess age, race, or gender from the sound of someone’s voice, and these perceptions affect whether we think the voice is engaging,calming or trustworthy, our prejudices will show up in the training data and any competent black-box algorithm will learn them.


March 30, 2015

Briefly

  • Two data-related notes about the Northland by-election: the polls were amazingly accurate given how hard by-elections are to predict, and the Electoral Commission did a wonderful job in getting the vote counted and reported fast.
  • The Medical Council of New Zealand has released a Discussion Paper on the value of performance and outcome data.
March 26, 2015

Understanding Ebola

From the BBC, Hans Rosling on the Ebola epidemic

rosling-ebola

(That’s a diagram of the data collection system behind him)

(via Harkanwal Singh)

March 25, 2015

Gimme that old time nutrition

Q: Did you see that eating a bowl of quinoa every day helps you live longer?

A: No.

Q: There’s story on Stuff (well, from the West Island branches). Is it true?

A: Hard to say.

Q: Well, does the research claim it’s true?

A: Hard to say.

Q: Why? Didn’t they link?

A: No, they linked, and the paper is even open-access. It just doesn’t say anything about the effects of quinoa.

Q: But the story said “A new study by Harvard Public School of Health has found that eating a daily bowl of the protein-packed, gluten-free grain significantly reduces the risk of premature death from cancer, heart disease, respiratory disease and diabetes.”

A: Sadly, yes.

Q: This is your correlation and causation thing again, isn’t it?

A: No, the paper just doesn’t mention quinoa. It talks about grains and cereals.

Q: Ok. So they just didn’t break out the data for quinoa separately. It’s still a grain and a cereal, isn’t it?

A: Yes, as long as you aren’t even more pedantic than me. But it’s not just data analysis. They didn’t even ask their study participants about eating quinoa.

Q: So? Some of the grain they ate must have been quinoa, and there’s no reason to expect it’s different from other grains, is there? Won’t it all get averaged in somehow?

A: I suppose so. But there can’t have been that much of it getting “averaged in”

Q: Why not? You old folks may not have caught on, but quinoa’s getting popular now.

A: The study was in people over 50. That’s older than both of us. Even assuming we weren’t the same person.

Q: Even so. Things are changing. People have more adventurous diets. It’s not the twentieth century any more.

A: It is in the study.

Q: Huh?

A: The dietary data were collected in 1995 and 1997, from people with average age 61 years.

Q: Oh.

NRL Predictions for Round 4

Team Ratings for Round 4

The basic method is described on my Department home page.

Here are the team ratings prior to this week’s games, along with the ratings at the start of the season.

Current Rating Rating at Season Start Difference
Rabbitohs 13.78 13.06 0.70
Roosters 10.81 9.09 1.70
Panthers 5.37 3.69 1.70
Cowboys 5.19 9.52 -4.30
Storm 4.43 4.36 0.10
Broncos 3.83 4.03 -0.20
Warriors 2.94 3.07 -0.10
Bulldogs 1.56 0.21 1.40
Knights 0.77 -0.28 1.00
Sea Eagles 0.01 2.68 -2.70
Dragons -3.71 -1.74 -2.00
Eels -5.62 -7.19 1.60
Raiders -7.45 -7.09 -0.40
Wests Tigers -9.74 -13.13 3.40
Titans -10.02 -8.20 -1.80
Sharks -10.80 -10.76 -0.00


Performance So Far

So far there have been 24 matches played, 16 of which were correctly predicted, a success rate of 66.7%.

Here are the predictions for last week’s games

Game Date Score Prediction Correct
1 Broncos vs. Cowboys Mar 20 44 – 22 -1.60 FALSE
2 Sea Eagles vs. Bulldogs Mar 20 12 – 16 2.40 FALSE
3 Raiders vs. Dragons Mar 21 20 – 22 -0.50 TRUE
4 Storm vs. Sharks Mar 21 36 – 18 18.30 TRUE
5 Warriors vs. Eels Mar 21 29 – 16 12.50 TRUE
6 Rabbitohs vs. Wests Tigers Mar 22 20 – 6 28.60 TRUE
7 Titans vs. Knights Mar 22 18 – 20 -8.80 TRUE
8 Roosters vs. Panthers Mar 23 20 – 12 8.50 TRUE


Predictions for Round 4

Here are the predictions for Round 4. The prediction is my estimated expected points difference with a positive margin being a win to the home team, and a negative margin a win to the away team.

Game Date Winner Prediction
1 Eels vs. Rabbitohs Mar 27 Rabbitohs -16.40
2 Wests Tigers vs. Bulldogs Mar 27 Bulldogs -8.30
3 Dragons vs. Sea Eagles Mar 28 Sea Eagles -0.70
4 Knights vs. Panthers Mar 28 Panthers -1.60
5 Sharks vs. Titans Mar 28 Sharks 2.20
6 Roosters vs. Raiders Mar 29 Roosters 21.30
7 Warriors vs. Broncos Mar 29 Warriors 3.10
8 Cowboys vs. Storm Mar 30 Cowboys 3.80


Super 15 Predictions for Round 7

Team Ratings for Round 7

The basic method is described on my Department home page.

Here are the team ratings prior to this week’s games, along with the ratings at the start of the season.

Current Rating Rating at Season Start Difference
Crusaders 9.22 10.42 -1.20
Waratahs 8.43 10.00 -1.60
Hurricanes 5.61 2.89 2.70
Brumbies 4.50 2.20 2.30
Chiefs 4.29 2.23 2.10
Stormers 2.70 1.68 1.00
Sharks 2.68 3.91 -1.20
Bulls 2.06 2.88 -0.80
Blues -0.07 1.44 -1.50
Highlanders -1.26 -2.54 1.30
Lions -3.93 -3.39 -0.50
Force -4.98 -4.67 -0.30
Rebels -7.07 -9.53 2.50
Cheetahs -7.48 -5.55 -1.90
Reds -7.72 -4.98 -2.70


Performance So Far

So far there have been 40 matches played, 26 of which were correctly predicted, a success rate of 65%.

Here are the predictions for last week’s games.

Game Date Score Prediction Correct
1 Highlanders vs. Hurricanes Mar 20 13 – 20 -2.20 TRUE
2 Rebels vs. Lions Mar 20 16 – 20 2.20 FALSE
3 Crusaders vs. Cheetahs Mar 21 57 – 14 18.50 TRUE
4 Bulls vs. Force Mar 21 25 – 24 13.00 TRUE
5 Sharks vs. Chiefs Mar 21 12 – 11 3.30 TRUE
6 Waratahs vs. Brumbies Mar 22 28 – 13 6.90 TRUE


Predictions for Round 7

Here are the predictions for Round 7. The prediction is my estimated expected points difference with a positive margin being a win to the home team, and a negative margin a win to the away team.

Game Date Winner Prediction
1 Hurricanes vs. Rebels Mar 27 Hurricanes 17.20
2 Reds vs. Lions Mar 27 Reds 0.70
3 Chiefs vs. Cheetahs Mar 28 Chiefs 16.30
4 Highlanders vs. Stormers Mar 28 Highlanders 0.50
5 Waratahs vs. Blues Mar 28 Waratahs 13.00
6 Sharks vs. Force Mar 28 Sharks 12.20
7 Bulls vs. Crusaders Mar 28 Crusaders -2.70