Posts filed under General (3156)

January 15, 2014

Meet Geyang Mao, Statistics summer scholar

Every year, the Department of Statistics offers summer scholarships to a number of students so they can work with our staff on real-world projects. Geyang is working with Dr Ian Tuck on a project called Correlations between air pollutants.  Geyang, below, explains:

“It is likely that the levels of air pollutants are somehow related in time if they arise from a common source such as vehicle emissions. Relationships between levels of pollutants could also be influenced by meteorological conditions, such as wind speed. Furthermore, the relationship may change in time as the nature of emissions changes due to technological change or emission controls.

Geyang Mao

“My research is about investigating the nature of the correlation between a number of key air pollutants, using data collected by Auckland Council and National Institute of Water and Atmospheric Research.  This project mainly focuses on predicting PM2.5 from PM10 and investigating correlation between particle number concentration (PNC) and nitrogen oxides (NOx).

“PM2.5 refers to particles smaller than 2.5 micrometers, which tend to penetrate into the gas-exchange regions of the lung. They can adversely affect human health and also have impacts on climate and precipitation. It is becoming very important to measure PM2.5 level in Auckland Council’s air-quality monitoring network. However, most weather stations in New Zealand monitor just the level of PM10. It is too expensive to measure all pollutants at all times, therefore, this project will be very useful if we can establish the relationship between correlated pollutants so that concentrations of one may be estimated from concentrations of the other.

“I have just finished my third year of a Bachelor of Science/ Bachelor of Commerce conjoint majoring in Statistics, Accounting and Finance, and I plan to pursue postgraduate studies in Statistics after I graduate.

“Statistics appeals to me because of its relevance to a lot of real-world problems. Stats can be widely applied to almost every industry. It helps us to make sense of data and extract useful information from large datasets. Furthermore, Statistics provides me with many quantitative skills that are transferable across a wide range of fields and has improved my problem-solving ability significantly. I have found learning stats at the University of Auckland to be very enjoyable due to the great learning environment and friendly lecturers.

“Over the summer, I’m also doing a lot of relaxing: catching up with friends, watching movies, spending some time at the beach and playing computer games.”

 

January 14, 2014

Meet Bor-Kuan Song, Statistics summer scholar

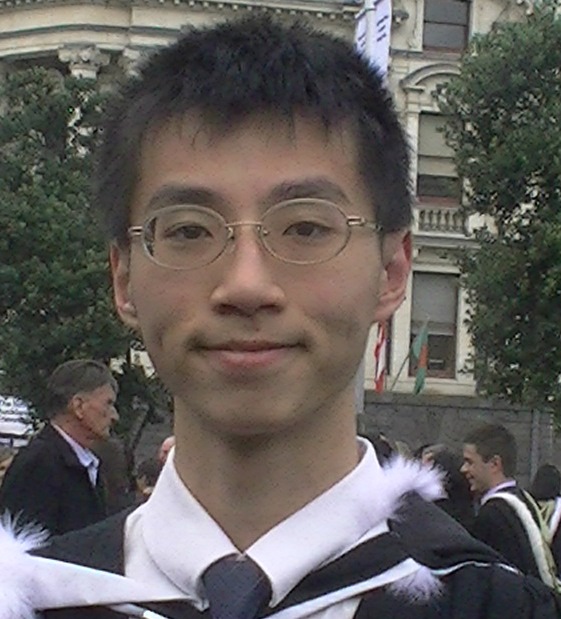
Every year, the Department of Statistics at the University of Auckland offers summer scholarships to a number of students so they can work with our staff on real-world projects.  Hongbin is working with Dr. Steffen Klaere on a project called Comparing and visualising measures of biodiversity. Bor-Kuan (below) explains:

“Our project is about acquiring and modifying data on biodiversity in New Zealand and possibly combining them into a visualisation in the form of maps. We will try look into the interaction between and within New Zealand birds, plants and soil compositions. Bor-Kuan Song “As technology develops and the availability of web storage space increases, it becomes easier to compare data from different sources. This presents an opportunity to assess the biodiversity in the NZ ecosystem, and have a better understanding of it.

“I’m studying a Bachelor of Science majoring in Statistics and Computer Science, and I’ve already finished a Bachelor of Music majoring in accordion performance. I’m into maths as well and have done most of the Stage II maths courses. My goal is to do actuarial studies, and so statistics, and, in part, computer science, will be a big part of it.”

January 13, 2014

Meet Savannah Post, Statistics summer scholar

Every year, the Department of Statistics offers summer scholarships to a number of students so they can work with our staff on real-world projects. We’ll be profiling them on Stats Chat.

Savannah is working with Professor Alan Lee on a project called Modelling criminal sentencing. Savannah explains:

Savannah Post

“The aim of my project is to identify the factors that are influencing sentencing outcomes in our justice system. Sentencing outcomes include both the type of punishment which is handed down – anything from a discharge without conviction to imprisonment – and also the length of the sentence imposed.

“In an ideal situation, the variation we see in sentencing outcomes should be explained purely by the crimes committed and the criminal history of the convicted person. Problems obviously arise when sentencing outcomes are influenced by illegitimate factors such as race. If race (or any other irrelevant factor) remains an influential factor in sentencing, even after the offending and criminal history have been taken into account, then certain groups in our society are being treated unfairly by the justice system, which is a major concern. The purpose of my research is to identify whether or not this is the case.

“This is useful research as the powers of the justice system are immense and criminal sentencing changes lives: not only the life of the person who is convicted but also the lives of that person’s family, friends and wider community. It’s absolutely essential that those powers are applied in the fairest way – without discrimination, in other words.

“I’ve just finished my third year of a BSc/LLB conjoint degree, so I have another two years to go. This is my second summer research project and I’m really enjoying the opportunity to experience another side of statistics.

“At the moment, I don’t have any clear ideas about where I’d like to go after finishing university, but I’m interested in the developing trend towards evidence-based policies in local and national government. I’m hoping to find an internship or something similar so that I can find out some more about the opportunities available.

“On a personal/academic level, the methodical and logical nature of statistics appeals to me. I also enjoy the combination of mathematical and interpretive skills that statistics requires. On another level, I think statistics is really important for society as a whole, because it can show us truths which would otherwise be obscured, either because the data is too overwhelming for us to comprehend or because our own prejudices have been influencing our perception of that data.

“I had a busy start to the summer, travelling to North America on a choir tour. It was loads of fun (but cold!), particularly since I had never been there before. Aside from my research, my plan for the rest of the summer is to relax and rejuvenate prior to hitting the books again in March.”


January 10, 2014

Why data isn’t enough

By a data enthusiast, Felix Salmon, writing at Wired

After disruption, though, there comes at least some version of stage three: over­shoot. The most common problem is that all these new systems—metrics, algo­rithms, automated decisionmaking processes—result in humans gaming the system in rational but often unpredictable ways. Sociologist Donald T. Campbell noted this dynamic back in the ’70s, when he articulated what’s come to be known as Campbell’s law: “The more any quantitative social indicator is used for social decision-making,” he wrote, “the more subject it will be to corruption pressures and the more apt it will be to distort and corrupt the social processes it is intended to monitor.”

Meet Mengdan Yu, Statistics summer scholar

Every year, the Department of Statistics offers summer scholarships to a number of students so they can work with our staff on real-world projects. We’ll be profiling them on Stats Chat.

Mengdan (below) is working with Jessica McLay on a project titled The simario R package. She explains:

Mengdan Yu

“The simario R package is a collection of R functions for performing dynamic microsimulation developed by  COMPASS (the Centre of Methods and Policy Application in the Social Sciences at the University of Auckland). Dynamic microsimulation is used to test ‘what if?’ situations.  The starting point of the simulation is a set of attributes for each unit (usually individual) and the attributes (variables) are simulated or updated in annual steps.  User-specified modifications can be made on the variables at the start or any point during simulation in order to see the effects on output attributes of interest.

“A simple demonstration microsimulation model (demo model) using the simario R functions was created two years ago, but the focus since then has been on developing a complicated microsimulation model called Modelling the Early Life Course (MELC).  Compared to the demo model, the MELC model uses newer versions of the simario functions and has had a lot of additional functionality built in.

“What I’m doing for my summer project is ensuring that the newer versions of the simario functions  work properly with the demo model and extend the demo microsimulation model.  The extension includes adding more variables to the system, showcasing the different ways variables can be simulated over time and including more of the functionality that is currently in MELC but not in the demo model.  I will also be checking the documentation for all the functions in the simario package to make it ready to publish as an official R package.

“This is useful research as dynamic microsimulation is increasingly used, especially in government, to help in making policy decisions.  There are a number of programming languages used to create microsimulation models, including those based on C++, C#, SAS, and Java.  However, given the prominence of the R language, a package for microsimulation in R could prove useful and helpful to analysts attempting microsimulation.  The demo model in conjunction with an article (to be written later by COMPASS) will show how to put the functions together to create a working microsimulation model.

“This is my third year of a Bachelor of Science majoring in Statistics and Computer Science.  Initially, I chose statistics because I’m into calculating probabilities, and have been since I was a child. As I learned more about stats, especially analysing data by using software, I appreciated even more how useful the subject is in many areas. Studying statistics has improved my logic thinking and my ability to solve real-life problems with stats techniques.

“For the rest of the summer, I’d like to do something relaxing: hang out with my friends, sleep at home and watch dramas so I can be positive and energetic for next semester.”


January 9, 2014

Heat wave in Greenland

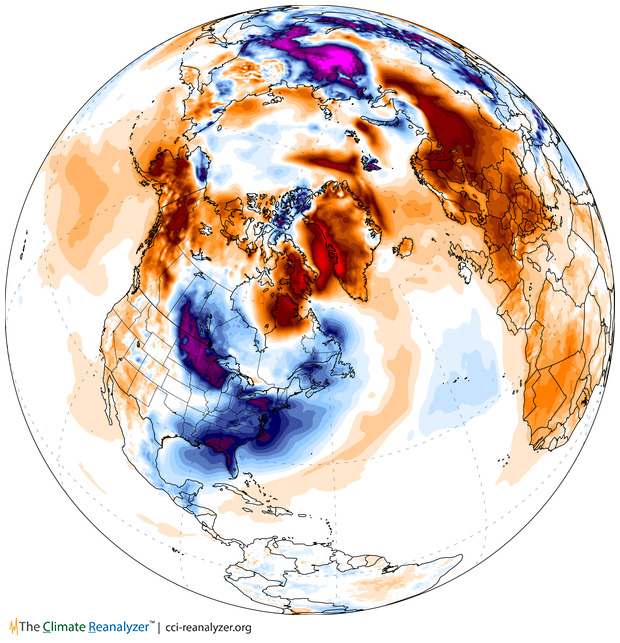
Following up on Monday’s post, here is the estimated surface air temperature anomaly yesterday over North American and the Arctic, from the site Climate Reanalyzer

T2_anom_satellite1


“Anomaly” means this is the temperature relative to the 1980-2000 average for the time of year. The US midwest and east cost are cold, as is Siberia, but Greenland, northern Europe, and most of Russia are hot.  The northern hemisphere as a whole is half a degree above average, and the Arctic is 1.7 degrees above.

This picture still requires weather models to combine weather-station and satellite measurements and extrapolate them across the globe. That’s done by NOAA’s Global Forecast System, which is a fairly uncontroversial piece of modeling.

January 5, 2014

But does it work?

The Public Accounts Committee of the British House of Commons has just released a report on access to clinical trial information, especially in the context of stockpiling the influenza anti-viral, Tamiflu, for use in future pandemics. Their summary says

The Department of Health (the Department) spent £424 million on stockpiling Tamiflu, an antiviral medicine used in the treatment of influenza, for use in a pandemic, but had to write off £74 million of its Tamiflu stockpile as a result of poor record-keeping by the NHS.

There is a lack of consensus over how well Tamiflu works, in particular whether it reduces complications and mortality. Discussions over this issue among professionals have been hampered because important information about clinical trials is routinely and legally withheld from doctors and researchers by manufacturers. This longstanding regulatory and cultural failure impacts on all of medicine, and undermines the ability of clinicians, researchers and patients to make informed decisions about which treatment is best. There are also concerns about the information made available to the National Institute for Health and Care Excellence (NICE) which assesses a medicine’s clinical and cost–effectiveness for use in the NHS.

The information from the clinical trials is, finally, being released: the director of the Cochrane Library says (at AllTrials)

The Cochrane Collaboration – who gained full access to all documents held by European regulators – discovered that many large trials on Tamiflu have not reported results and that for many more trials only partial information was available. Cochrane is now receiving full clinical study reports from Roche. This new information is being assessed by the twelve international researchers who make up the Cochrane Collaboration neuraminidase team, funded by the National Institute of Health Research. They are close to submitting the updated evidence for peer review. The findings will for the first time provide what the PAC calls for, ‘independent scrutiny of a medicine’s effectiveness.’ 

Tamiflu is one of the charismatic megafauna of the publication bias problem: it’s not that research into influenza is especially bad, it’s that this is one issue where it’s possible to make governments take notice.

January 4, 2014

Briefly

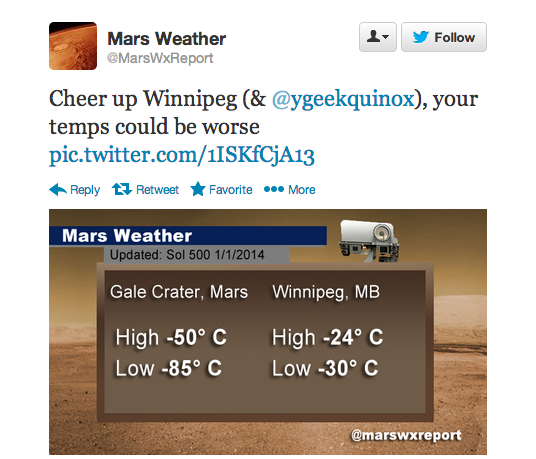
The basic statistical question is “Compared to what?”

  • Compared to what? Mark Kleiman If you ignore the benefits of [cannabis] legalization, it looks like a pretty bad idea. If you ignore the costs, it looks like a pretty good idea.
  • Compared to what? What’s wrong with this comparisonmars
  • We criticize the Herald and the Fairfax papers a lot, but it could be much worse

This year, the Mail reported that disabled people are exempt from the bedroom tax; that asylum-seekers had “targeted” Scotland; that disabled babies were being euthanised under the Liverpool Care Pathway; that a Kenyan asylum-seeker had committed murders in his home country; that 878,000 recipients of Employment Support Allowance had stopped claiming “rather than face a fresh medical”; that a Portsmouth primary school had denied pupils water on the hottest day of the year because it was Ramadan; that wolves would soon return to Britain; that nearly half the electricity produced by windfarms was discarded. All these reports were false.

and that doesn’t include any of their science/health stories that ended up on StatsChat via the local media.

December 31, 2013

Problems with genetic testing

Genetic testing has had a lot of overmarketing — even the most obvious poster-child application in clinical medicine, setting doses of warfarin, has been disappointing in clinical trials. Here are two recent pieces you might want to read

In a New York Times story, a journalist had her DNA tested by three companies.  The level of agreement was not, shall we say, ideal

After my tests had been sent, I braced myself for the revelations about my DNA. It took about two months to receive all the results, and when I did, the discrepancies were striking.

23andMe said my most elevated risks — about double the average for women of European ethnicity — were for psoriasis and rheumatoid arthritis, with my lifetime odds of getting the diseases at 20.2 percent and 8.2 percent. But according to Genetic Testing Laboratories, my lowest risks were for — you guessed it — psoriasis (2 percent) and rheumatoid arthritis (2.6 percent).

If you actually work with genome-wide disease data it’s not surprising that the predictions are neither accurate nor consistent, but that isn’t the impression the industry is promoting.

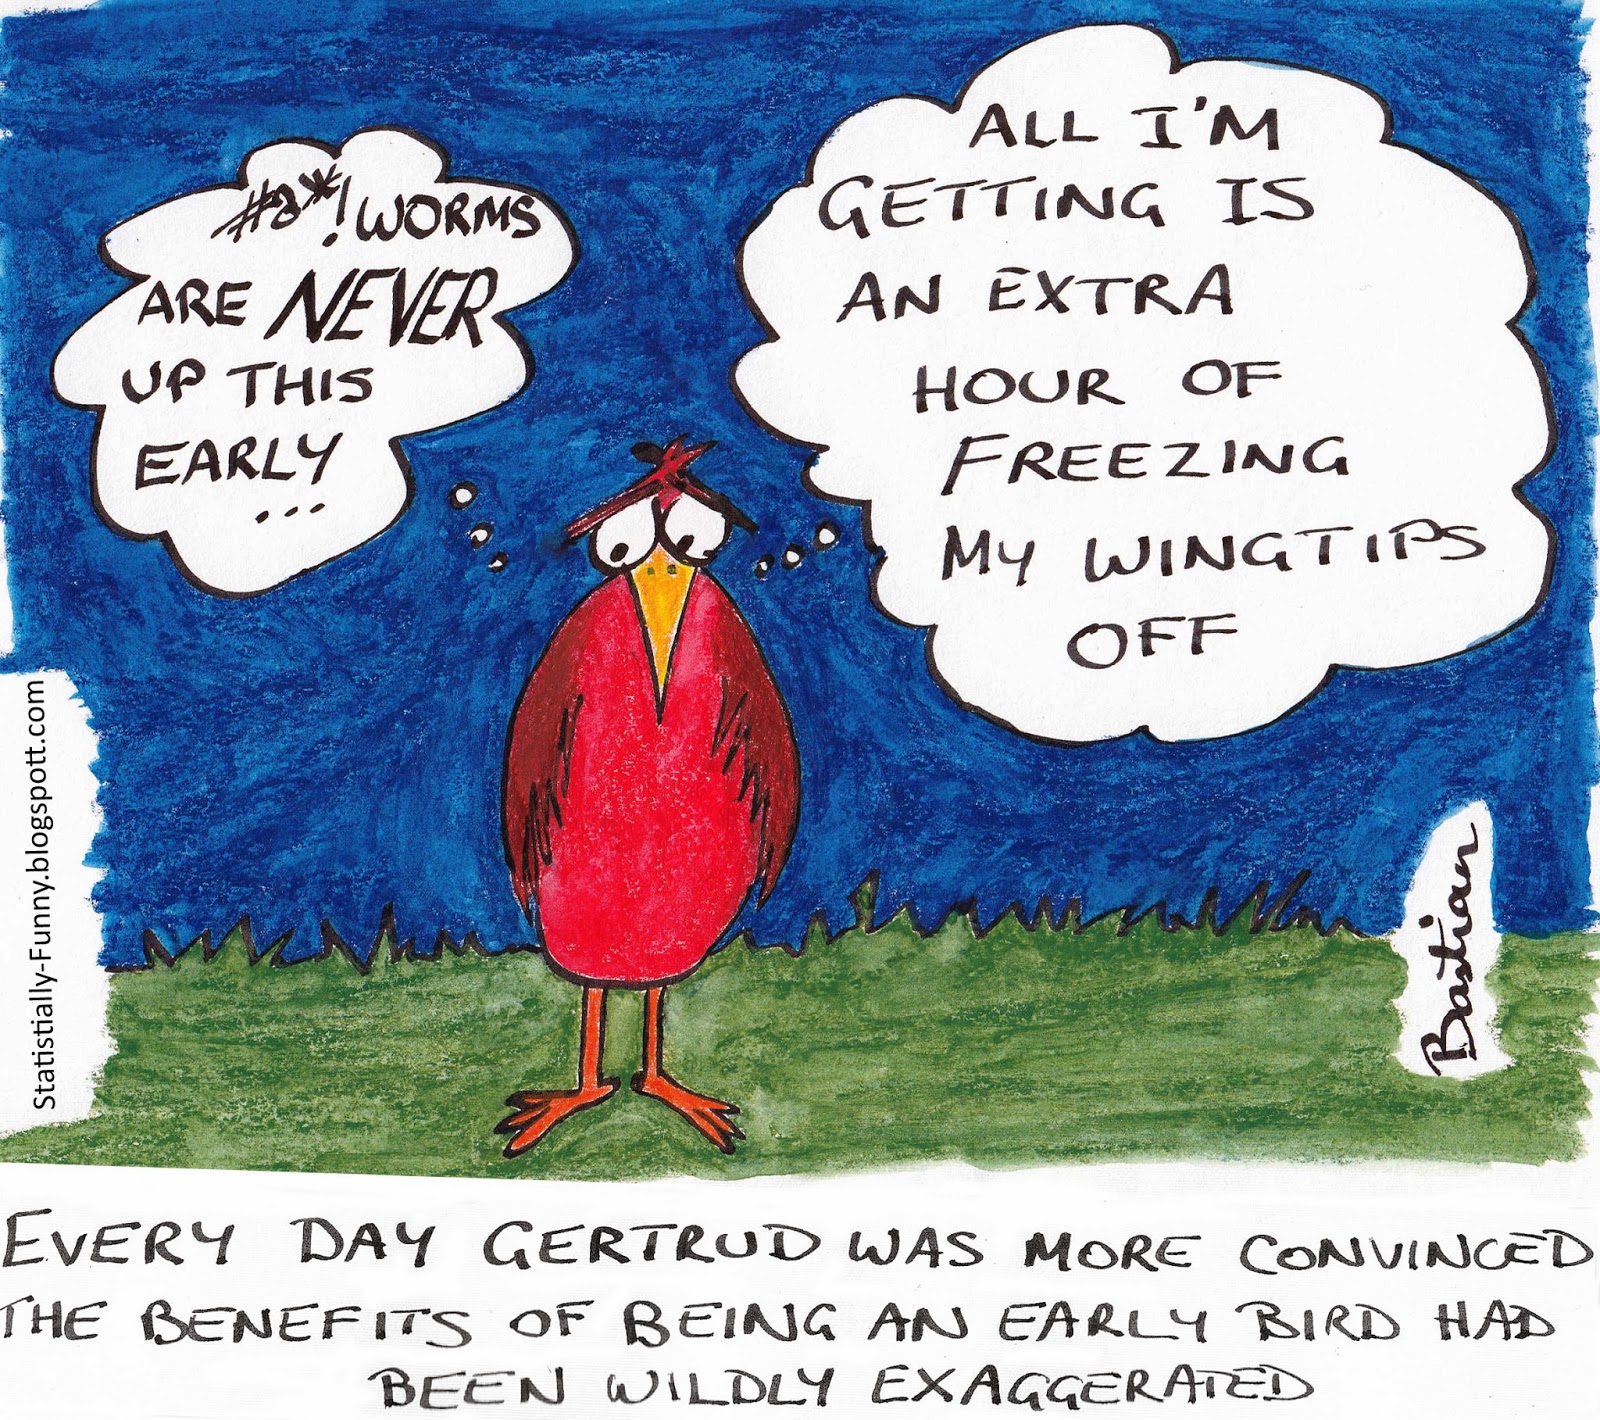
Hilda Bastian drew this cartoon at Statistically Funny

Early-bird

heading a general post about the problems with early-detection programs.

There’s a general bias in favour of screening and early detection, because it seems obviously good. And, in fact, there’s a standard mathematical result that the value of information can’t be negative. But the key assumptions in this result are that you know what information you’ve got and that you can just ignore the result if you want to. It doesn’t apply to real-life medical testing.

Meet Manasi Parulekar, Statistics Summer Scholar

Every year, the Department of Statistics offers summer scholarships to a number of students so they can work with our staff on real-world projects. We’ll be profiling them on Stats Chat. 

Manasi is working with Dr Yannan Jiang on a project titled Bariatric surgery and diabetic retinopathy progression. She explains:

“Bariatric surgery is an effective method to achieve rapid weight reduction along with a sustained remission of type 2 diabetesManasi (T2D). However, the effect of the surgery on the progression of diabetes retinopathy (DR) – retinal damage that can lead to loss of vision in both the short and long term – is not documented.

“It is hypothesised that bariatric surgery could be associated with a worsening of DR. In this project, I will be working together with Debbie Chen, a medical student from the Faculty of Medical and Health Sciences, under the joint supervision of Dr Rinki Murphy and Dr Yannan Jiang, to assess the impact of bariatric surgery on DR among patients with T2D.

“This research is very useful, as the results will be used to create the first retinal screening protocols for those having undergone bariatric surgery. So we’ll be creating guidelines to channel limited resources and identify those most at risk.

“I have completed a Bachelor of Science majoring in Psychology and Pharmacology and a Graduate Diploma in Statistics. In 2014 I will be doing my Honours in Statistics.

“Statistics excites me as it is an incredibly diverse field that is applicable to almost everything we do. It is fun to be able to break down large datasets to find patterns and solve problems to get a better understanding of the world around us. The Department of Statistics at the University of Auckland has made the experience especially enjoyable as the lecturers are friendly and approachable and the administration staff are very helpful, creating a great environment in which to learn.

“Over the summer, I will be relaxing by drawing, catching up with family and friends – and I am spending two weeks in India around New Year.”