Posts filed under Just look it up (285)

December 20, 2012

Proper use of denominators

The Herald, and the Ministry of Transport, are reporting rates for motor vehicle crashes and casualties, not just totals:

Statistically, Dunedin is New Zealand’s worst city for motor vehicle crashes and casualties but authorities say the numbers are dropping.

Last year the city recorded 364 injury crashes. Auckland had 2903, and Christchurch 715.

However, Dunedin had the highest number of crashes per 10,000 population (29), ahead of Palmerston North (24) and Napier (23).

Population is not the ideal way to standardise road crashes (especially in high-tourism areas), but it’s a lot better than not doing anything.  When we looked at crashes at intersections, back in March, it didn’t make a lot of difference whether we standardised by population, number of registered vehicles, or vehicle-miles travelled.

December 17, 2012

Turkey arithmetic

Stuff’s story about the price of Christmas food has the headline “Festive food hits Kiwis’ wallets”, and the even more misleading HTML page title “Christmas Dinner Takes Bigger Dent from Wallets.”  The story says

A traditional Christmas dinner with roast chicken or lamb, seasonal vegetables, nibbles and pavlova will set you back about $67.31, up from $54.60 in 2002.

The problem, as usual with stories comparing past and current prices, is that dollars are smaller than they used to be.  In this case the CPI isn’t really the answer — $54.60 in 2002 money is worth about $70 in today’s money, but that just tells us Christmas dinner has gone up less than the average for the CPI basket of goods.

The dent in wallets really depends on how the price compares to income.  If the price had increased as fast as mean household income it would now be $76.38, if it had increased as fast as median household income it would now be $77.55, and if it had increased as fast as the minimum wage it would be $92.18 (StatsNZ, MoBIE).


December 11, 2012

(Almost) all the world’s powerplants

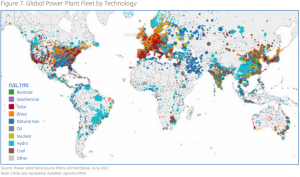
From GE, via Ezra Klein’s blog at the Washington Post, this is supposedly a map of all the powerplants in the world, by size and type.

It looks as though they are missing a few.

NZ data/graphics site

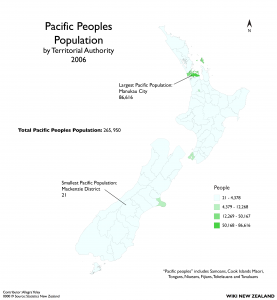
Wiki New Zealand bills itself as “A collaborative website making data about New Zealand accessible for everyone.”

They have lots of graphics of comparative data on New Zealand, with comparisons within the country, over time, and compared to other countries.

Two quibbles: it would be nice if the data source links gave a bit more information on how to find the data than just, eg, pointing to StatsNZ Infoshare.  Also, the thematic maps are currently all of total population counts, without any denominators.

November 29, 2012

You are feeling sleepy

Stuff has a story about an increase in sleeping-pill prescriptions in young people.

The increase in prescriptions is real. What’s more dubious is the explanation that it reflects an increase in sleeping difficulties is being caused by electronic devices, rather than trends in treatment.  It’s not that it’s implausible for gadgets to affect sleep — the mechanisms are fairly clear — it’s more that there isn’t any evidence supplied that sleeping problems are becoming hugely more common.

With the help of the Google and PubMed, I found a few papers looking at time trends in sleep. A recent US paper looked at time-use studies from 1975 to 2006, and found that

Unadjusted percentages of short sleepers ranged from 7.6% in 1975 to 9.3% in 2006.

A Finnish study  found about a 4% decrease in average sleep duration from 1972 to 2005, about half a minute per year.

Other research in both kids and adults seems to agree that sleep duration is decreasing slowly, but not by anything like enough to justify Stuff’s lead:

Your tablet computer, smartphone or other mobile device could be the reason you are not sleeping – and the ubiquitous devices are being cited as a possible cause for a 50 per cent jump in the number of young people scoffing sleeping pills.

It doesn’t make matters better that the “50 per cent jump” is really just for one region in NZ (the Waikato). Or that taking a single 165mg tablet per night is described as “scoffing sleeping pills”.

November 25, 2012

XKCD on denominators

XKCD on the data visualisation equivalent of forgetting that Auckland is larger than Wellington

I’m looking at you, Facebook

Clarity begins at home

Stuff’s story on the World Giving Index would have been better just using it as a hook for a discussion of charities in NZ, but they couldn’t stop themselves from referring to details. Which turn out to be wrong.

For example

The World Giving Index, which compares countries’ charitable behaviour in giving money, time and helping a stranger, found New Zealand was slightly less giving than in 2010 when New Zealand and Australia were found to be the most generous, with 57 per cent of people doing some charitable work.

It’s not 57% of people (unless you think those behaviours are independent).  The index value of 57 is the average of the proportions for the three things that the survey actually measured.  The value of 57 is exactly the same as in the previous survey.  NZ went down in the ranking because other countries increased their Giving Index value.

Fundraising Institute of New Zealand chief executive James Austin is quoted as saying

“When you start boiling it down, even though they are very sophisticated in the way they put their statistics together, everything from exchange rates has an impact on it,”

Either he wasn’t asked a question about the World Giving Index, or he doesn’t understand it either. This isn’t an inventory of actual monetary sums given. It’s just an average of three percentages: % who volunteered time, % who gave money, % who helped a stranger. Exchange rates really don’t come into it.

The story also doesn’t mention the cautionary note in the Australasia section of the World Giving Index report

 It is important to note that these surveys were conducted before devastating floods crippled Queensland, Australia in January 2011, and the tragic earthquake that struck New Zealand in February 2011, so any change in giving behaviour after these disasters is not captured in this year’s analysis.

That’s useful context for the poll-based claim in the story

A Sunday Star-Times poll of 763 readers reflected the World Giving Index, with 53 per cent of respondents having changed the way they donate in the past 12 months. More than half of those who had changed their habits admitted to donating less money.

So, this poll actually had very different findings from the World Giving Index survey, possibly because it was asking completely different questions, but possibly because it was about a non-overlapping period of time.

And we haven’t even got to margins of error or sampling bias.
November 17, 2012

infoGRAPHIC

Infographics can be useful — the New York Times ones usually are — but often they are just dubiously-illustrated lists of information.  Or, not even information.

One that is doing the rounds of the Internet at the moment purports to list the best-selling science-fiction novels of all time.  It’s not entirely correct.  For example, its entry for “Twenty Thousand Leauges[sic] Under The Sea”, says

Twenty Thousand Leagues Under The Sea – Jules Verne has sold over 10,000 COPIES and has been translated into 147 languages.

That would be over 68 copies per language. No wonder they kept translating it.

No-one seems to know the original source of this infographic, and my guess is that the true author won’t be eager to change  this situation.

(via)

November 16, 2012

Ethnic diversity here and US

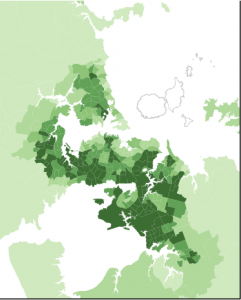
Real-estate data company Trulia has an article on their blog about ethnic diversity in the US, which they measure by the proportion of the population in the largest ethnic group (so low proportions mean more diversity).  Here’s their national map (they also have maps of some cities)

Stats New Zealand have also released maps, though just for Auckland.  Their index of ethnic diversity is 100% minus Trulia’s index, so they are equivalent, though the NZ color scheme is darker in the mid-range than the US one.  The 2006 map of Auckland looks like

It would be interesting to do this for the whole of NZ using the Census meshblock dataset, but I don’t have time right now.  The Auckland map makes the point I made a few weeks ago about modern NZ having more, and more varied, immigration than most people outside the country realise.


November 15, 2012

Stop it or you’ll go blind

According to the Herald, a West Island eye expert says that ‘up to’  5% of people who watched the solar eclipse will have permanent eye damage in the form of a blind spot or black spot in the center of their vision.  That could easily be hundred thousand people in New Zealand, which seems (a) excessive and (b) rather light on supporting data for such an important public health claim.

Auckland eye doctor Sarah Welsh is quoted as being a bit more realistic

… anyone who watched the event with the naked eye could have damaged their retina.

She had seen at least one patient today who believed they damaged their eyes yesterday….

Yet Welsh said it was “unlikely” five per cent of people suffered such burns.

“I’m not sure where he got that number from,” she said.

A brief session with the internets reveals that after a 1999 eclipse in Britain, there were 14 confirmed cases of permanent eye damage. The same eclipse was also seen in Stockolm, Sweden, where there were 15 cases recorded.  And in 1995, an eclipse in Pakistan led to 36 cases at the Abbottabad Hospital, 26 of whom recovered completely.  There will be some under-reporting in all these examples, but it’s hard to imagine that only one in a hundred or one in a thousand of the people with eye damage reports it.

So where did the 5% number come from? It probably sounded plausible.  That is, he pulled it out of his hat. Or somewhere else round and inappropriate.