Posts filed under Just look it up (285)

August 19, 2011

Why is the US driving less?

A post today on Ezra Klein’s ordinarily-reliable blog at the Washington Post looked at statistics for miles driven in the US, and asked why this recession had led to a decrease in driving when previous recessions hadn’t. The post noted that fewer teenagers are getting driving licenses, and speculated that the internet may be replacing car-dependent ways of socializing.  Which could be true.

On the other hand, when you look at a longer time series, it seems there’s nothing special about this recession except its depth.
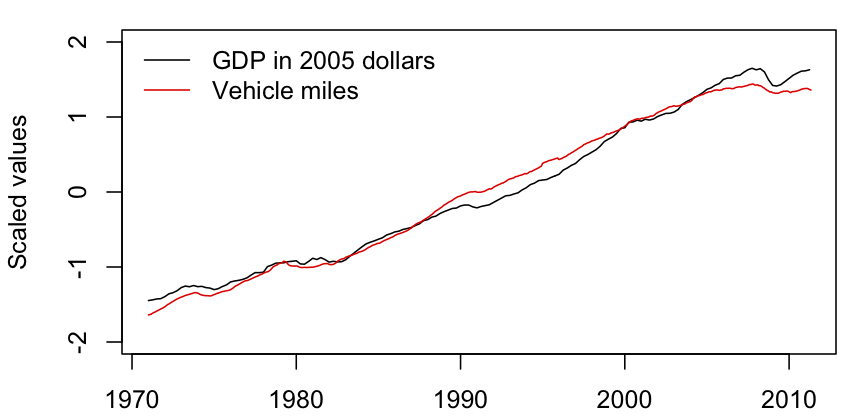
The graph shows US GDP (in 2005 dollars) and vehicle-miles driven in the US, since the driving data started to be collected in 1971.  The two series have been rescaled to the same range, and they track each other very well. Each dip in GDP is matched by a dip in driving.

The only anomaly in the graph is that the most recent dip in driving started before the fall in GDP, and that is easily explained by the spike in petrol prices at that time.

In fact, it looks as though the current Great Recession has had proportionately less impact on US driving than previous recessions.  The absolute dip is larger this time, but so is the economic mess.  Social media may be going save the planet, but it’s not showing up in these time series.


August 15, 2011

More NZ government data

From the Dominion Post, via stuff.co.nzThe Cabinet will today issue an instruction to government departments that they should make all data they hold available for free or at a reasonable-price in accessible file formats for reuse by businesses, unless there are good reasons not to.

This policy has worked very well in the US, where the website data.gov, after just over two years’ of operation, has nearly 400,000 data sets, and there are 236 apps available on the web that make use of the data to do things that would otherwise be expensive or impossible.


August 8, 2011

The moon and earthquakes

A recurrent theme of this blog is that your taxes (or, even better, other people’s taxes) pay for the collection of a lot of high-quality data on an amazing range of topics, and you can just go and look it up.

For example, the US Geological Survey has a database of earthquakes that anyone can search.  It includes pretty much everything since 1973, and a more limited coverage back into prehistory.   John Walker’s web site Fourmilab has a range of interesting astronomical pages, including an earth-moon distance calculator.  

Combining these, we can look at the distance from the earth to the moon for all 62667 earthquakes of magnitude 5.0 or greater from 1973 up to early this morning.  Using a complete census this way it’s easy to avoid cherry-picking results that support whatever conclusion you want.  For convenience I translated the earth-moon distance calculator into R, so I could run it more easily on large batches of data. (more…)

July 26, 2011

That trick never works.

Q: So, have you seen the article about Vitamin D and diabetes?

A: Of course. The tireless staff of StatsChat read even West Island newspapers. It’s a good report, too.

Q: What did the researchers do?

A: They studied 5200 people without diabetes, following them up for five years. 199 of them developed diabetes. The people who ended up with diabetes started off with lower vitamin D levels in their blood.

Q: Where did you get those details?

A: The abstract for the study publication (you can also get the full text there free if you’re at a university or if you wait until next year).

Q: Isn’t it annoying that newspaper websites don’t provide any links to that sort of information?

A: It’s like you’re reading my mind.

Q: One of the study authors is quoted as saying “”It’s hard to underestimate how important this might be.” What do you think?

A: I think he meant “overestimate”.

Q: So, how important is this finding?

A: If it really is an effect of vitamin D, it would be really important.  A simple supplement would be able to dramatically reduce the risk of diabetes.

Q: How can we tell?

A: Someone needs to do a randomized trial, where half the participants get vitamin D and half get a dummy pill. If the effect is real, fewer people getting vitamin D will end up with diabetes.

Q: That sounds like a good idea. Is someone doing a trial?

A: Yes, Professor Peter Ebeling, of the the University of Melbourne.

Q: Is there some useful website where I can find more information about the trial?

A: Indeed.

Q: Will it work?

A: No.

Q: Are you sure?

A: No, that’s why we need the trial.  But it’s a trial of vitamin supplementation, which almost always has disappointing results, and it’s a trial  in adult-onset diabetes, which almost always has disappointing results.


July 1, 2011

Do women really take more sick leave?

From 3 NEWS, last week: Mr Thompson went on radio this morning to debate gender inequality – it was largely uncontroversial until he tried to explain why women are paid, on average, 12 percent less than men.”Look at who takes the most sick leave,” said Mr Thompson. “Because you know, once a month they have sick problem. Not all women, but some do. They have children and they have to take leave off.”

In New Zealand there does not seem to be any comprehensive information on sick leave differences for men and women, but other countries collect this information, including Sweden, the UK, and Australia, and NZ information is available for public employees.

  • The Public Services Association (the government employees’ union) obtained data under the Official Information Act. The figures based on 2010 data in the State Services Commission’s Human Resources Capability Study show that in 2010 men took on average 6.8 days sick and domestic leave annually while women took 8.4 days.
  • In the UK, the 2004 Labour Force Survey showed that about 1.4% of men and 2.1% of women were taking sick leave on any given day. The gap between men and women showed up at all ages, but was largest for 25-34 year olds.  The survey also asked about children: the gap between men and women was smallest when there was a child under 5 in the household, and largest when the youngest child was 5-10.  Single parents, male or female, had the highest rates of sick-leave absence, with nearly 5% missing work for at least one day during the week they were sampled.  A less-detailed report from 2010 shows about the same difference between men and women
  • The last Australia Bureau of Statistics report on sick-leave differences between men and women dates from 1995.  Over a two-week period, 9.3% of men and 10.3% of women took at least three hours’ sick-leave. As with the UK data, the difference was larger for people under 34. In the over-55 age group, men were slightly more likely than women to take sick leave.
  • In Sweden, quarterly data are available right up to 2010. The number of sick days taken per quarter is about 1.5 for women and about 1.0 for men (more in winter, less in summer).
  • A (highly technical) report from the US National Bureau of Economic Research looks at whether there are periodic cycles in women’s sick leave, and finds that there is no real evidence. Differences between men and women do appear to have a weak 28-day periodicity, but so do differences between older and younger men, showing that it isn’t PMS that’s the explanation.

Although the data are not as complete as we might like, there is a consistent picture across the world where data is available.  On average, women do take more sick days than men, but it’s not a big deal. Two or three days a year seems to be a reasonable estimate of the difference, and there’s no way that explains any meaningful fraction of a 12% difference in pay.   It’s also worth noting that the pay gap between men and women varies enormously around the world — it’s almost twice as large in the UK as in NZ — but the sick-leave differences are much the same.