Posts filed under Law (39)

April 28, 2013

Briefly

  • BBC news report on the Amanda Knox case and misuse of statistics: judge did not believe that repeating a test could increase its accuracy (via Mark Wilson)
  • A tool for finding stories based on light makeover of press releases. Unfortunately, it often doesn’t detect recycling of stories from sites such as Medical Daily and Science Daily, which do enough rewriting to mask the sources.
  • New York Times opinion piece on evidence and science reporting — yes, distinguish experimental and observational studies, but also distinguish small exploratory studies from larger confirmatory ones. (via @brettkeller)
  • Using anecdotes rather than data to convince patients. On one hand, speaking to people in language they understand is good; on the other hand, you can use anecdotes to support anything.
April 23, 2013

When ‘self-selected’ isn’t bogus

Two opportunities for public comment that will expire soon, and where StatsChat readers might have something to say

  • Stats New Zealand wants to hear from people who use Census data.  They have a questionnaire on how you use the data, and how this might be affected if they change the Census in various ways. It’s open until Friday May 3
  • Public submissions on the new ‘legal highs’ bill close on Wednesday May 1.  The bill is here. You can make a submission here.  The Drug Foundation have a description and recommendations here

This sort of public comment is qualitative, rather than quantitative.  Neither the Select Committee nor Stats New Zealand is likely to count up the number of submissions taking a particular view and use this as a population estimate, because that would be silly.  What they should be aiming for is a qualitatively exhaustive sample, one that includes all the arguments for or against the bill, or all the different ways people use Census data.

April 10, 2013

Another NZ blog

JustSpeak is

a non-partisan network of young people speaking to, and speaking up for a new generation of thinkers who want change in our criminal justice system.

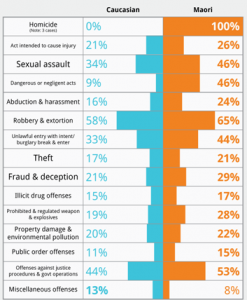
I’m linking because they have a good visualisation of the recently-released police crime statistics, comparing the proportion of apprehensions leading to prosecution among Maori and Pakeha youth. The back-to-back bar charts take advantage of the brain’s ability to detect lack of symmetry.

youfcrime

I probably would have left out the homicide category, which has too few to compare, and it would be interesting to see if small gaps between the categories help.

The real problem is in interpretation.  It’s hard to say what you’d expect just from economic differences and differences in where people live, without any differences in how they are treated by police. A higher proportion of prosecutions could mean the police are using their discretion to prosecute more Maori youth, but a lower proportion of prosecutions could just as easily have been interpreted as harassment of innocent Maori youth.


April 3, 2013

Crime news vs crime data

If you actually look at the data, neither the Herald nor Stuff comes off well in today’s crime figure reports.  Stuff has the headline “Crime drop due to ‘tag and release'”, and it’s not until the third paragraph that they admit the ‘tag and release’ impact is on court workloads and has nothing to do with  number of crimes reported.  The Herald says

Crime is at its lowest level in 24 years but the percentage of offences that police solve is also dropping – less than half of all cases.

This is at least technically true, but the drop they are talking about is less than one percentage point, when the resolution rate differs between types of crime by about 90 percentage points. Even a small change in the relative numbers of different offenses would make a one percentage difference in overall resolution rate meaningless.  Here, using data from Stats New Zealand are the resolution rates for 16 categories of crime over the past 18 years.

crime-specific

I haven’t tried to label them all, but at the top are homicides, acts intended to cause injury, illegal drug offenses, and offenses against justice procedures and government operations.  The reasons vary:  the resolution rate for violent crimes is high because police put a lot of effort into solving them;  the rate is high for drug offenses because they aren’t usually reported except when the police discover them.  At the low end are burglary and unlawful entry, where the vast majority of cases are never resolved.  If anyone is trying to sell you a policy based on a small change in the average of these, without accounting for variation in proportions, you should keep a firm grip on your wallet.

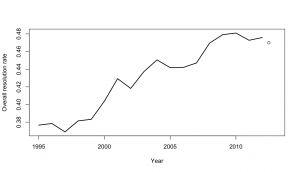
Against that background, what does the trend in resolution rate look like?

overall


The lines show the past 18 fiscal years, the dot shows todays data for the 2012 calendar year.  It’s possible that the resolution rate is flattening out at its peak of 48%, or even decreasing slowly over the past few years, but it’s hardly convincing evidence of a trend.


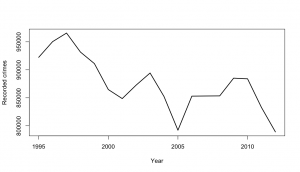
The change in recorded crimes over time is also a fairly noisy trend, but generally downwards even before we account for population growth

recorded


It’s also worth pointing out that preventing crime is important, but catching criminals is beneficial primarily as a means of preventing crime.  A low crime rate with few crimes resolved is far preferable to a high crime rate with most crimes resolved.   The easiest way for the police to increase the resolution rate would be to put more effort into catching drug users, but it would be hard to regard that as the most socially useful way to spend their time and taxpayers money.


March 10, 2013

Your media on drugs

Last night, 3News had a scare story about positive drug tests at work.  The web headline is “Report: More NZers working on drugs”, but that’s not what they had information on:

New figures reveal more New Zealanders were caught with drugs in their system at work last year.

…new figures from the New Zealand Drug Detection Agency reveal 4300 people tested positive for drugs at work last year.

but

The New Zealand Drug Detection Agency says employers are doing a better job of self-regulating. The agency performed almost 70,000 tests last year, 30 percent more than in 2011.

If 30% more were tested, you’d expect more to be positive. The story doesn’t say how many tested positive the previous year, but with the help of the Google, I found last year’s press release, which says

8% of men tested “non-negative” compared with 6% of women tested in 2011.

Now, 8% of 70000 is 5600, and even 6% of 70000 is 4200. Given that the majority of the tests are in men, it looks like the proportion testing positive went down this year.

The worst part of the story statistically is when they report changes in proportions of which drug was found as if this was meaningful.  For example,

When it comes to industries, oil and gas had an 18 percent drop in positive tests for methamphetamine, but showed a marked increase in the use of opiates.

That’s an increase in the use of opiates as a proportion of those testing positive.  Since proportions have to add up to 100%, a decrease in the proportion positive tests that are for methamphetamine has to come with an increase in some other set of drugs — just as a matter of arithmetic.

Stuff‘s story from January just as bad, with the lead

Employers are becoming more aware of the dangers of drugs and alcohol in the workplace as well as the benefits of testing for them.

and quoting an employer as saying

“And, we have no fear of an employee turning up to work and operating in an unsafe way, putting themselves and others at risk.”

as if occasional drug tests were the answer to all occupational health and safety problems.

The other interesting thing about the Stuff story is that it’s about a different organisation: Drug Testing Services, not NZ DDA — there’s more than one of them out there! You might easily have thought from the 3News story that the figures they quoted referred to all workplace drug tests in NZ, rather than just those sold by one company.

Given the claims being made, the evidence for either financial or safety benefits is amazingly weak.   No-one in these stories even claims that introducing testing has actually reduced  on-the-job accidents in their company, for example, let alone presents any data.

If you look on PubMed, the database of published medical research, there are lots of papers on new testing methods and reproducibility of test results, and a few that show people who have accidents are more likely than others to test positive.  There’s very little even of before-after comparisons: a Cochrane review on this topic found three before-after comparisons. Two of the three found a small decrease in accident rates immediately after introducing testing; the third did not.  A different two of the three found that the long-term decreasing trend in injuries got faster after introducing testing; again, the third did not.   The review concluded that there was insufficient evidence to recommend for or against testing.

There’s better evidence for mandatory alcohol testing of truck drivers, but since those tests measure current blood alcohol concentrations, not past use, it doesn’t tell us much about other types of drug testing.


February 22, 2013

Drug safety is hard

There are new reports, according to the Herald, that synthetic cannabinoids are ‘associated’ with suicidal tendencies in long-term users.  One difficulty in evaluating this sort of data is the huge peak in suicide rates in young men.  Almost anything you can think of that might be a bad idea is more commonly done by young men than by other people, so an apparent association isn’t all that surprising.  There is also the problem with direction of causation — the sorts of problems that make suicide a risk might also increase drug use — and difficulties even in getting a reasonable estimate of the denominator, the number of people using the drug. Serious, rare effects of a recreational drug are the hardest to be sure about, and the same is true of prescription medications.  It took big randomized trials to find out that Vioxx more than doubled your rate of heart attack , and a study of 1500 lung-cancer cases even to find the 20-fold increase in risk from smoking.

In this particular example there is additional supporting evidence. A few years back there was a lot of research into anti-cannabinoid drugs for weight loss (anti-munchies), and one of the things that sank these was an increase in suicidal thoughts in the patients in the early randomized trials.  It’s quite plausible that the same effect would happen as a dose of the cannabinoid wears off.

In general, though, this is the sort of effect that the proposed testing scheme for psychoactive drugs will have difficulty finding, or ruling out.

February 15, 2013

There oughtta be a law

David Farrar (among others) has written about a recent Coroner’s recommendation that high-visibility clothing should be compulsory for cyclists.  As he notes, ” if you are cycling at night you are a special sort of moron if you do not wear hi-vis gear”, but he rightly points out that isn’t the whole issue.

It’s easy to analyse a proposed law as if the only changes that result are those the law intends: everyone will cycle the same way, but they will all be wearing lurid chartreuse studded with flashing lights and will live happily ever after.  But safety laws, like other public-health interventions, need to be assessed on what will actually happen.

Bicycle helmet laws are a standard example.  There is overwhelming evidence that wearing a bicycle helmet reduces the risk of brain injury, but there’s also pretty good evidence that requiring bicycle helmets reduces cycling. Reducing the number of cyclists is bad from an individual-health point of view and also makes cycling less safe for those who remain. It’s not obvious how to optimise this tradeoff, but my guess based on no evidence is that pro-helmet propaganda might be better than helmet laws.

Another example was a proposal by some US airlines to require small children to have their own seat rather than flying in a parent’s lap. It’s clear that having their own seat is safer, but also much more expensive.  If any noticeable fraction of these families ended up driving rather than flying because of the extra cost, the extra deaths on the road would far outweigh those saved in the air.

It’s hard to predict the exact side-effects of a law, but that doesn’t mean they can be ignored any more than the exact side-effects of new medications can be ignored. The problem is that no-one will admit they don’t know the effects of a proposed law.  It took us decades to persuade physicians that they don’t magically know the effects of new treatments; let’s hope it doesn’t take much longer in the policy world.

[PS: yes, I do wear a helmet when cycling, except in the Netherlands, where bikes rule]

February 14, 2013

Petty drug users fill NZ homes?

Michelle Gosse points us to a discussion of minor drug crime on Stuff.  The headline “Petty drug users fill New Zealand jails” is definitely off, but most of the rest is just a bit messy.

The primary statistical issue is what epidemiologists call “incidence vs prevalence”, economists call “stocks vs flows”, and point-process mavens call “length-biased sampling”.   Because minor drug offenses lead to short sentences, offenders don’t stay in prison long, and so are a much smaller fraction of the prison population than they are of the court workload.  Specifically, as Michelle calculates, the figures mean there were at most an average of about 400 ‘petty drug users’ in NZ jails over the six years in question, from a prison population of more than 8000.  The ‘petty drug users’ are less than 5% of the prison population.  How much less than 5% is hard to calculate, because there’s a mixture of data on number of people and data on number of charges or offences, which aren’t just one to a customer.

The main point of the story is that lots of people are being prosecuted for minor drug crimes, and that this is dumb.  That, I can certainly agree with.  But one more statistical point is being missed. We get quotes like

The New Zealand Drug Foundation said the figures were alarming and showed the court-focused treatment of minor offenders was not working.

But Justice Minister Judith Collins said all drug offending – no matter how minor – should be dealt with through the criminal justice system.

Looking at the figures, about 3000 people a year are charged with cannabis possession. Based on drug-use survey data, about 385000 people use cannabis sometime during a year, so the criminal justice system is actually missing more than 99% of them.  Or, put another way, the proportion of petty drug users in jails (<5%) is substantially lower than in the NZ population as a whole (>14%).  In order to get convicted, you need to be guilty both of cannabis possession and of coming to the attention of the police.   You don’t need to be very cynical to worry about the impact of differential enforcement of the law.

February 10, 2013

Is cherry-picking season finally over?

Ben Goldacre writes in the New York Times about the need for all clinical trials to be published

The Food and Drug Administration Amendments Act of 2007 is the most widely cited fix. It required that new clinical trials conducted in the United States post summaries of their results at clinicaltrials.gov within a year of completion, or face a fine of $10,000 a day. But in 2012, the British Medical Journal published the first open audit of the process, which found that four out of five trials covered by the legislation had ignored the reporting requirements. Amazingly, no fine has yet been levied.

An earlier fake fix dates from 2005, when the International Committee of Medical Journal Editors made an announcement: their members would never again publish any clinical trial unless its existence had been declared on a publicly accessible registry before the trial began. The reasoning was simple: if everyone registered their trials at the beginning, we could easily spot which results were withheld; and since everyone wants to publish in prominent academic journals, these editors had the perfect carrot. Once again, everyone assumed the problem had been fixed.

But four years later we discovered, in a paper from The Journal of the American Medical Association, that the editors had broken their promise: more than half of all trials published in leading journals still weren’t properly registered, and a quarter weren’t registered at all.

There’s a new campaign and petition at Alltrials.net, and if you’re in Auckland, you can hear Ben Goldacre in May at the Auckland Readers and Writers Festival

January 20, 2013

Crime trends and marriage equality

[Update: according to today’s Herald, Mr McVicar wasn’t speaking for the Sensible Sentencing Trust.  That wasn’t clear from yesterday’s story.]

The Sensible Sentencing Trust, rather surprisingly given their goals, seem to have a view on same-sex marriage. As Stuff reports

Sensible Sentencing Trust leader Garth McVicar has submitted to Parliament that changing the law to allow same-sex marriage will be yet another erosion of basic morals and values in society which have led to an escalation of child abuse, domestic violence, and an ever-increasing prison population.

The story also quotes someone who knows what they are talking about

Criminologist Dr James Oleson, from Auckland University, an expert in deviance, said he was not familiar with any research that would suggest homosexuals would be responsible for a disproportionate amount of crime.

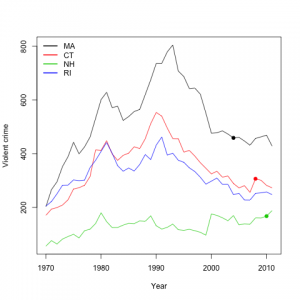
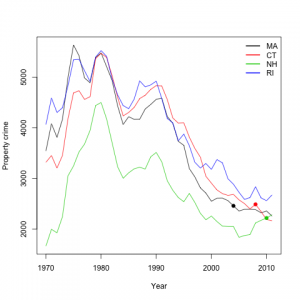
I thought it would be entertaining to look at data from the US, where several states have introduced marriage equality over the past several years.  I looked at states bordering Massachusetts, since it was the first, in 2004, Connecticut and New Hampshire followed a few years later.  Here are graphs of crimes per 100,000 population for these three states and for Rhode Island, which does not yet allow same-sex marriage.

First, violent crime.  The dot is the year that same-sex marriage started.

violent-crime


And property crime

prop-crime

See the upward trend after the dots? Me either.

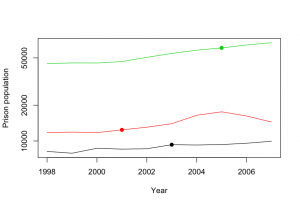
For Europe it was harder to find crime data, but Mr McVicar mentioned “an ever-increasing prison population”, and I did find 1998-2007 prison populations for European Union countries.  Here are the trends for the three that introduced same-sex marriage during that period: Netherlands (red), Belgium (black), and Spain (green).  Again, the dots are when marriage equality started. Looking at this graph, the phrase “robustly null” comes to mind.

europrison


I don’t know why Mr McVicar thinks he and other New Zealanders will lose their moral fibre and become hardened criminals if the marriage equality bill passes, but it doesn’t seem to have happened in other countries.