March 16, 2021

NRL Predictions for Round 2

Team Ratings for Round 2

The basic method is described on my Department home page.
Here are the team ratings prior to this week’s games, along with the ratings at the start of the season.

Current Rating Rating at Season Start Difference
Storm 14.35 14.53 -0.20
Roosters 12.29 10.25 2.00
Panthers 9.26 8.88 0.40
Rabbitohs 7.91 7.73 0.20
Raiders 7.43 6.98 0.50
Eels 1.50 1.68 -0.20
Sharks 0.37 -0.76 1.10
Warriors -1.15 -1.84 0.70
Knights -1.89 -2.61 0.70
Wests Tigers -3.53 -3.07 -0.50
Dragons -6.08 -4.95 -1.10
Sea Eagles -6.81 -4.77 -2.00
Titans -7.91 -7.22 -0.70
Bulldogs -8.34 -7.62 -0.70
Cowboys -8.43 -8.05 -0.40
Broncos -10.97 -11.16 0.20


Performance So Far

So far there have been 8 matches played, 8 of which were correctly predicted, a success rate of 100%.
Here are the predictions for last week’s games.

Game Date Score Prediction Correct
1 Storm vs. Rabbitohs Mar 11 26 – 18 9.80 TRUE
2 Knights vs. Bulldogs Mar 12 32 – 16 8.00 TRUE
3 Broncos vs. Eels Mar 12 16 – 24 -9.80 TRUE
4 Warriors vs. Titans Mar 13 19 – 6 5.40 TRUE
5 Roosters vs. Sea Eagles Mar 13 46 – 4 18.00 TRUE
6 Panthers vs. Cowboys Mar 13 24 – 0 19.90 TRUE
7 Raiders vs. Wests Tigers Mar 14 30 – 12 13.00 TRUE
8 Dragons vs. Sharks Mar 14 18 – 32 -1.20 TRUE


Predictions for Round 2

Here are the predictions for Round 2. The prediction is my estimated expected points difference with a positive margin being a win to the home team, and a negative margin a win to the away team.

Game Date Winner Prediction
1 Eels vs. Storm Mar 18 Storm -9.90
2 Warriors vs. Knights Mar 19 Warriors 0.70
3 Titans vs. Broncos Mar 19 Titans 6.10
4 Bulldogs vs. Panthers Mar 20 Panthers -14.60
5 Sea Eagles vs. Rabbitohs Mar 20 Rabbitohs -11.70
6 Cowboys vs. Dragons Mar 20 Cowboys 0.70
7 Wests Tigers vs. Roosters Mar 21 Roosters -12.80
8 Sharks vs. Raiders Mar 21 Raiders -4.10


March 15, 2021

Obesity and Covid deaths

Q: Did you see 90% of Covid deaths are due to obesity?

A: No

Q: It’s on Newshub: “90 percent or 2.2 million of the 2.5 million deaths from the pandemic disease so far were in countries with high levels of obesity.”

A: So, if that’s true, what countries are we talking about?

Q: With high levels of obesity? Australia, New Zealand, some of the Pacific Island nations, USA, UK,…

A: And what don’t those countries have in common?

Q: Lots of Covid deaths, I suppose.  But Australia and NZ and the Pacific Island countries didn’t have many deaths just because they didn’t have many cases. They don’t tell you anything about the risk

A: Neither does the ‘report’, which says, according to Newshub, “the majority of global COVID-19 deaths have been in countries where many people are obese, with coronavirus fatality rates 10 times higher in nations where at least 50 percent of adults are overweight”

Q: That sounds bad, though? Ten times higher is a lot!

A: How much do you think being overweight increases the risk of death?

Q: Well, if 50% overweight means ten times the risk, maybe a factor of twenty?

A: Yeah nah. Less than double, according to that very same report. (PDF, p13)

Q: So where do they get such a strong association?

A: Well, what are the main risk factors for dying of Covid?

Q: Um. Age?

A: And?

Q: Heart disease? Diabetes?

A:

Q:

A:

Q: Having Covid?

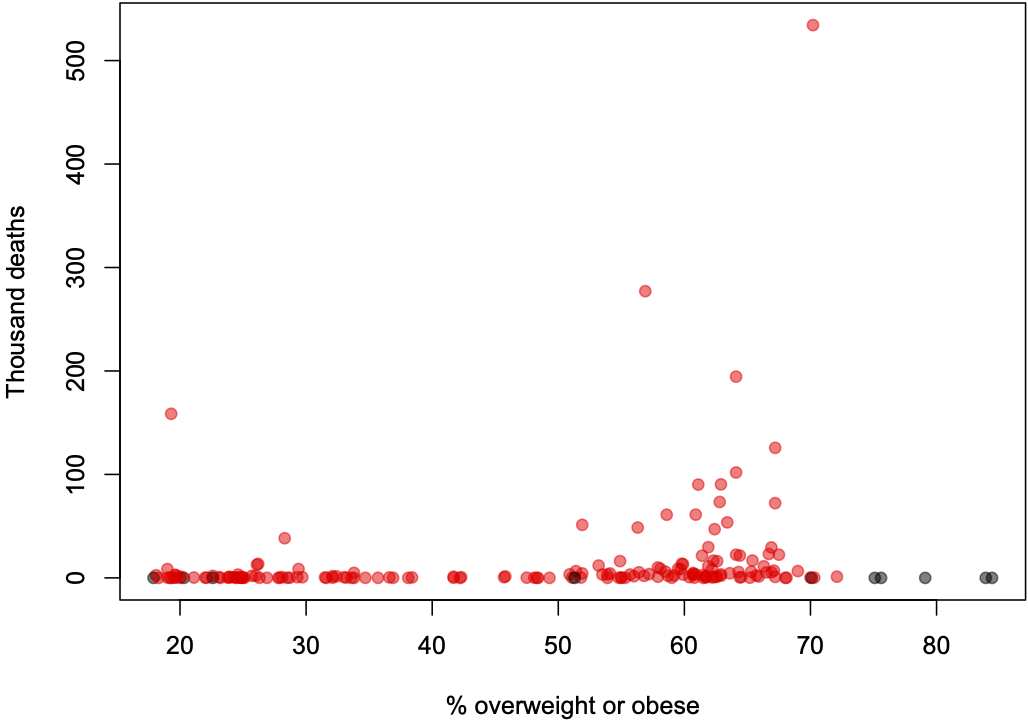
A: Exactly.  So we’d need to look at the proportion of infected people dying (the case fatality rate), not the total number of deaths, and we’d ideally want to compare countries with similar age profiles. Instead, Newshub shows us a graph of deaths, basically like this

Q: Why are some of the dots black?

A: They are countries that were missing from the Johns Hopkins Covid data, and so were missing from the original graph, mostly small nations like Samoa and Tonga and Timor-Leste with very few cases

Q: And what’s the dot on the left that isn’t in the graph on Newshub?

A: Afghanistan. I don’t know why it’s not there.

Q: So what about for risk of dying if you get Covid?

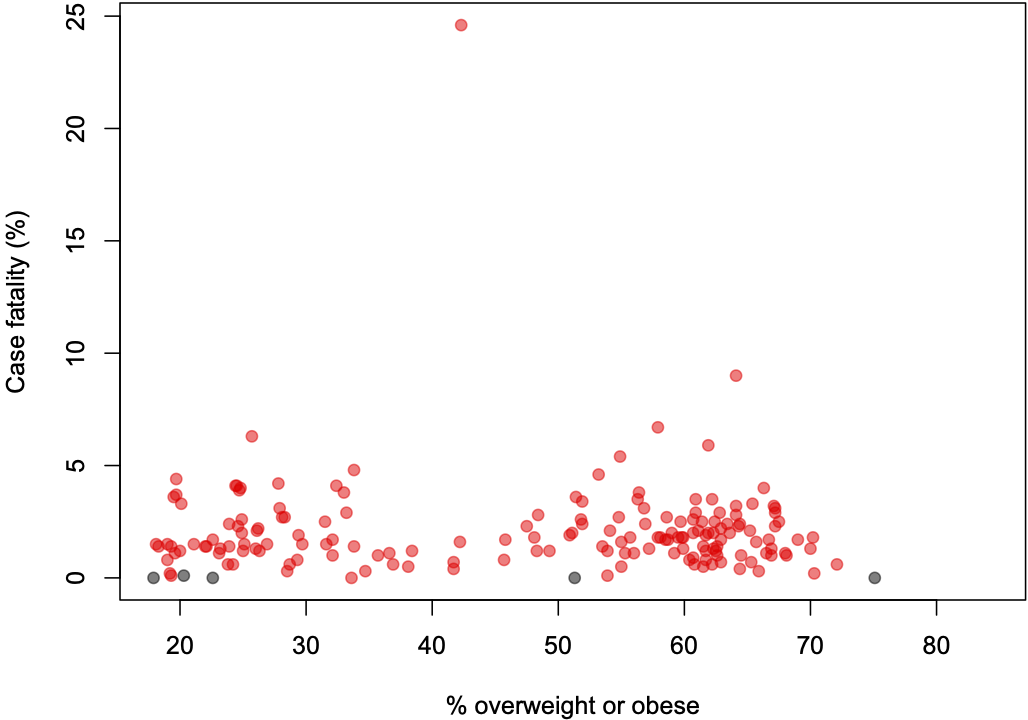
A: Here’s what it looks like for case fatality rate

Q: That’s…surprisingly unimpressive. Well, except for that one country…

A: Yemen

Q: Things they don’t need right now, number #1

A:  Too true.

Q: So the massive correlation?

A: Well, overweight is common in the USA, the UK, Brazil, and various other large countries that have handled the pandemic badly. While I suppose you could argue that handling the pandemic well should go with handling other public health issues well, the empirical evidence would not really be in your favour on that one.  You could also listen to a slightly different approach to the data from David Spiegelhalter and Tim Harford on BBC’s “More or Less”

March 12, 2021

Briefly

  • I wrote about how many people we need to vaccinate and why it’s complicated, at the Spinoff
  • And an expanded version of this post about the Pfizer vaccine and obesity, for ‘Statisticians React to the News’, a blog of the International Statistical Institute
  • While it’s true that basically no deaths and hospitalisations have been seen in the vaccinated groups in the vaccine trials, there haven’t been very many seen in the control groups either. As Hilda Bastian explains in the Atlantic, the trials were designed to see differences in symptomatic Covid, not serious/fatal Covid, and there are uncertainties about differences between the vaccines and about whether they are extremely effective or just very  effective. “It’s tempting to believe that a simple, decisive message—even one that verges on hype—is what’s most needed at this crucial moment. But if the message could be wrong, that has consequences.”
  • The RECOVERY trial in the UK keeps churning out information about effectiveness of treatments for Covid based on large numbers of hospitalised patients. A new casualty: colchicine, a gout drug that appears beneficial in non-hospitalised patients in a smaller Canadian study.  RECOVERY is now expanding internationally, starting with Nepal and Indonesia
  • “But there’s something else interesting here. The fear-and-stress argument is introduced with an historical account about a medieval experiment conducted by medieval Persian philosopher Avicenna / Ibn Sīnā. The story is *total bullshit.* Avicenna did no such experiment.”   from ‘Calling Bullshit’
  • In one of Terry Pratchett’s Discworld books, there’s a personal organiser that does handwriting recognition. You show it a page of text, and it says “Yes, that’s handwiting, I’d recognise it anywhere”.  Something a bit similar is suggested by Police Commissioner Andrew Coster’s claim “There is no use of police photos for facial recognition unless it is someone who is an unidentified suspect for an offence.”. If that were true, the facial recognition system would be able to examine a photo and say “Yeah nah, don’t recognise him but he looks like a suspect “ but nothing more useful.  A facial recognition system needs basic training on faces (which is often problematic), a set of faces with known names (which is often problematic) , and a set of faces to recognise (which… well you get the idea). It matches the third to the second, using clues from the first about general face patterns.  With just the third group of photos, nothing much will happen.
March 9, 2021

Top 14 Predictions for Postponed Games

Team Ratings for Postponed Games

The basic method is described on my Department home page.
Here are the team ratings prior to this week’s games, along with the ratings at the start of the season.

Current Rating Rating at Season Start Difference
Stade Toulousain 8.91 4.80 4.10
Clermont Auvergne 6.67 3.22 3.50
Racing-Metro 92 6.08 6.21 -0.10
La Rochelle 5.71 2.32 3.40
Bordeaux-Begles 4.06 2.83 1.20
Lyon Rugby 3.98 5.61 -1.60
RC Toulonnais 3.41 3.56 -0.20
Montpellier 1.38 2.30 -0.90
Stade Francais Paris -0.64 -3.22 2.60
Castres Olympique -1.06 -0.47 -0.60
Brive -3.11 -3.26 0.20
Section Paloise -3.69 -4.48 0.80
Aviron Bayonnais -7.19 -4.13 -3.10
SU Agen -13.96 -4.72 -9.20


Performance So Far

So far there have been 132 matches played, 88 of which were correctly predicted, a success rate of 66.7%.
Here are the predictions for last week’s games.

Game Date Score Prediction Correct
1 Aviron Bayonnais vs. Lyon Rugby Mar 07 20 – 28 -4.10 TRUE
2 Bordeaux-Begles vs. Section Paloise Mar 07 29 – 23 13.50 TRUE
3 Castres Olympique vs. La Rochelle Mar 07 22 – 15 -0.80 FALSE
4 Montpellier vs. Clermont Auvergne Mar 06 22 – 16 0.70 TRUE
5 RC Toulonnais vs. Racing-Metro 92 Mar 07 25 – 21 1.60 TRUE
6 Stade Francais Paris vs. SU Agen Mar 07 40 – 21 18.00 TRUE
7 Stade Toulousain vs. Brive Mar 07 42 – 17 16.00 TRUE


Predictions for Postponed Games

Here are the predictions for Postponed Games. The prediction is my estimated expected points difference with a positive margin being a win to the home team, and a negative margin a win to the away team.

Game Date Winner Prediction
1 Aviron Bayonnais vs. SU Agen Mar 14 Aviron Bayonnais 12.20


Super Rugby Predictions for Week 4


Team Ratings for Week 4

If you happen to check back on my predictions for Week 3 you will see a different margin for the Brumbies against the Rebels, though still a win for the Brumbies. I had that game as a home game for the Rebels. I think it might have been switched because of Covid. The return game on April 18 seems to have been switched also. Super Rugby has it as a home game for the Rebels while some other sites still have it as home for the Brumbies.

The basic method is described on my Department home page.
Here are the team ratings prior to this week’s games, along with the ratings at the start of the season.

Current Rating Rating at Season Start Difference
Crusaders 14.96 14.49 0.50
Blues 8.45 7.80 0.70
Hurricanes 6.28 7.13 -0.80
Chiefs 3.63 4.38 -0.70
Highlanders 3.18 2.70 0.50
Brumbies 2.53 1.47 1.10
Reds 1.94 1.59 0.30
Rebels -2.82 -3.51 0.70
Waratahs -7.39 -5.02 -2.40
Western Force -12.78 -13.05 0.30


Performance So Far

So far there have been 10 matches played, 7 of which were correctly predicted, a success rate of 70%.
Here are the predictions for last week’s games.

Game Date Score Prediction Correct
1 Chiefs vs. Highlanders Mar 05 23 – 39 7.50 FALSE
2 Waratahs vs. Western Force Mar 05 16 – 20 12.00 FALSE
3 Crusaders vs. Hurricanes Mar 06 33 – 16 13.80 TRUE
4 Brumbies vs. Rebels Mar 06 27 – 24 11.50 TRUE


Predictions for Week 4

Here are the predictions for Week 4. The prediction is my estimated expected points difference with a positive margin being a win to the home team, and a negative margin a win to the away team.

Game Date Winner Prediction
1 Western Force vs. Rebels Mar 12 Rebels -4.50
2 Crusaders vs. Chiefs Mar 13 Crusaders 16.80
3 Brumbies vs. Reds Mar 13 Brumbies 6.10
4 Blues vs. Highlanders Mar 14 Blues 10.80


Rugby Premiership Predictions for Round 13

Team Ratings for Round 13

The basic method is described on my Department home page.
Here are the team ratings prior to this week’s games, along with the ratings at the start of the season.

Current Rating Rating at Season Start Difference
Exeter Chiefs 6.97 7.35 -0.40
Bristol 3.41 1.28 2.10
Sale Sharks 3.39 4.96 -1.60
Harlequins 2.13 -1.08 3.20
Wasps -0.03 5.66 -5.70
Northampton Saints -1.37 -2.48 1.10
Gloucester -2.35 -1.02 -1.30
Bath -2.82 2.14 -5.00
London Irish -4.71 -8.05 3.30
Leicester Tigers -4.90 -6.14 1.20
Newcastle Falcons -5.89 -10.00 4.10
Worcester Warriors -6.93 -5.71 -1.20


Performance So Far

So far there have been 65 matches played, 38 of which were correctly predicted, a success rate of 58.5%.
Here are the predictions for last week’s games.

Game Date Score Prediction Correct
1 Bath vs. Exeter Chiefs Mar 07 16 – 38 -3.40 TRUE
2 Harlequins vs. Northampton Saints Mar 08 37 – 19 6.80 TRUE
3 Leicester Tigers vs. London Irish Mar 06 33 – 32 4.90 TRUE
4 Sale Sharks vs. Newcastle Falcons Mar 06 31 – 16 13.60 TRUE
5 Wasps vs. Gloucester Mar 07 19 – 20 7.80 FALSE
6 Worcester Warriors vs. Bristol Mar 07 23 – 24 -6.50 TRUE


Predictions for Round 13

Here are the predictions for Round 13. The prediction is my estimated expected points difference with a positive margin being a win to the home team, and a negative margin a win to the away team.

Game Date Winner Prediction
1 Bristol vs. Wasps Mar 13 Bristol 7.90
2 Exeter Chiefs vs. Harlequins Mar 14 Exeter Chiefs 9.30
3 Gloucester vs. Leicester Tigers Mar 14 Gloucester 7.00
4 London Irish vs. Worcester Warriors Mar 15 London Irish 6.70
5 Newcastle Falcons vs. Bath Mar 14 Newcastle Falcons 1.40
6 Northampton Saints vs. Sale Sharks Mar 14 Sale Sharks -0.30


Pro14 Predictions for Round 15

Team Ratings for Round 15

The basic method is described on my Department home page.
Here are the team ratings prior to this week’s games, along with the ratings at the start of the season.

Current Rating Rating at Season Start Difference
Leinster 17.42 16.52 0.90
Munster 10.00 9.90 0.10
Ulster 8.66 4.58 4.10
Edinburgh 3.98 5.49 -1.50
Glasgow Warriors 3.28 5.66 -2.40
Connacht 3.11 0.70 2.40
Scarlets 0.75 1.98 -1.20
Cheetahs -0.46 -0.46 0.00
Cardiff Blues -0.55 0.08 -0.60
Ospreys -2.37 -2.82 0.40
Treviso -6.53 -3.50 -3.00
Dragons -7.74 -7.85 0.10
Zebre -14.62 -15.37 0.70
Southern Kings -14.92 -14.92 0.00


Performance So Far

So far there have been 82 matches played, 55 of which were correctly predicted, a success rate of 67.1%.
Here are the predictions for last week’s games.

Game Date Score Prediction Correct
1 Munster vs. Connacht Mar 06 20 – 17 12.80 TRUE
2 Zebre vs. Glasgow Warriors Mar 07 20 – 31 -11.50 TRUE
3 Ospreys vs. Dragons Mar 07 20 – 31 12.00 FALSE
4 Ulster vs. Leinster Mar 07 19 – 38 -2.50 TRUE


Predictions for Round 15

Here are the predictions for Round 15. The prediction is my estimated expected points difference with a positive margin being a win to the home team, and a negative margin a win to the away team.

Game Date Winner Prediction
1 Zebre vs. Leinster Mar 13 Leinster -25.50
2 Glasgow Warriors vs. Ospreys Mar 13 Glasgow Warriors 12.10
3 Munster vs. Scarlets Mar 13 Munster 15.70
4 Connacht vs. Edinburgh Mar 14 Connacht 5.60
5 Dragons vs. Ulster Mar 14 Ulster -9.90
6 Treviso vs. Cardiff Blues Mar 15 Treviso 0.50


NRL Predictions for Round 1

Team Ratings for Round 1

I have decided to not give home ground advantage to the Warriors for any games played at their Australian base on the Central Coast of New South Wales. I will treat all those games as being played on neutral ground.

The basic method is described on my Department home page.
Here are the team ratings prior to this week’s games, along with the ratings at the start of the season.

Current Rating Rating at Season Start Difference
Storm 14.53 14.53 -0.00
Roosters 10.25 10.25 0.00
Panthers 8.88 8.88 0.00
Rabbitohs 7.73 7.73 -0.00
Raiders 6.98 6.98 0.00
Eels 1.68 1.68 -0.00
Sharks -0.76 -0.76 0.00
Warriors -1.84 -1.84 0.00
Knights -2.61 -2.61 -0.00
Wests Tigers -3.07 -3.07 -0.00
Sea Eagles -4.77 -4.77 -0.00
Dragons -4.95 -4.95 0.00
Titans -7.22 -7.22 0.00
Bulldogs -7.62 -7.62 -0.00
Cowboys -8.05 -8.05 -0.00
Broncos -11.16 -11.16 -0.00


Predictions for Round 1

Here are the predictions for Round 1. The prediction is my estimated expected points difference with a positive margin being a win to the home team, and a negative margin a win to the away team.

Game Date Winner Prediction
1 Storm vs. Rabbitohs Mar 11 Storm 9.80
2 Knights vs. Bulldogs Mar 12 Knights 8.00
3 Broncos vs. Eels Mar 12 Eels -9.80
4 Warriors vs. Titans Mar 13 Warriors 5.40
5 Roosters vs. Sea Eagles Mar 13 Roosters 18.00
6 Panthers vs. Cowboys Mar 13 Panthers 19.90
7 Raiders vs. Wests Tigers Mar 14 Raiders 13.00
8 Dragons vs. Sharks Mar 14 Sharks -1.20


March 3, 2021

Is four a lot?

Q: Is four a lot?

A: Depends on the context. Lockdowns, yes. Incursions per 46000 people through MIQ, no.

Q: We’ve had four lockdowns in Auckland, right?

A: Yes

Q: And how many cases let through MIQ for each 46000 people?

A: About four

Q:

A:

Q: ಠ_ಠ

A: My point, and I do have one, is that more people need to say what their criteria are. If you think four lockdowns is unacceptable, what’s your target that you can argue a realistic system would achieve? If you think 10 cases in 115000 MIQ visitors is a good result, what would it take to be a bad result?

Q: So what’s your threshold?

A: I don’t know. That’s why I haven’t been making comments about the overall performance being good or bad.

March 2, 2021

Briefly

  • About 140% of Kiwis aged 20-24 are on Facebook (NZ$ Herald) — more precisely, that’s the ratio of Facebook’s claimed “reach” to StatsNZ’s population estimates.  This is an age group where the census does relatively badly, but nowhere near that badly.
  • The false-positive rate of the PCR tests for Covid has become topical again, so it’s worth revisiting how we know it is very low. In addition to knowing it should be low based on how the test works, we have simple, direct evidence that the false positive rate is low for the test as used in NZ. We have so far performed 1,720,909 tests in New Zealand and 1,717,865 of them, or 99.8%, have been negative. The 0.2% left over include all the true positives (including people with serious Covid cases), all the inconclusive results, and any false positives.
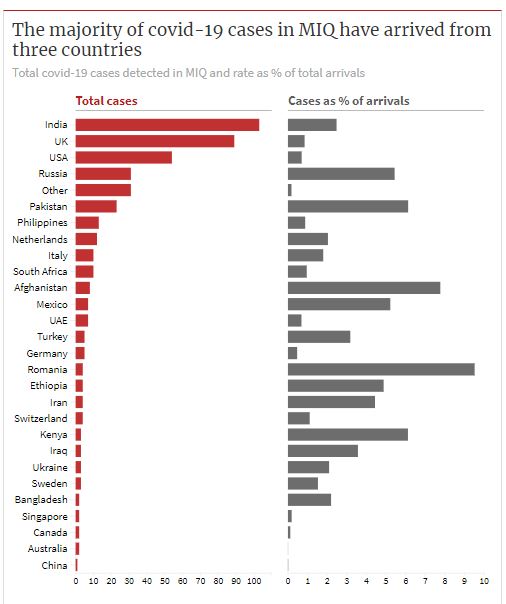
  • Business$ Week reports on the countries of origin of Covid cases in MIQ.  As you’d expect, the top four are four of the top five in the world for Covid cases: US, India, UK, Russia. Brazil, the other country in the top five, doesn’t show up, but we don’t get as many immigrants or visitors from South America.  Also, as you’d expect, China is very low on the list, because we didn’t start the MIQ system until after they’d controlled their big outbreak. Image (from tweet by @victoriayoung03)