March 17, 2020

Briefly

  • Statisticians from the Human Rights Data Analysis Group write in the UK literary magazine Granta, about the uncertainty in COVID-19 mortality rates.  They’re saying similar things to what I and other statisticians have said, but should be reaching a new audience, including some influential people.
  • The infectious disease modelling group at Imperial College, London, have put out a new paper on suppressing infections (PDF, Financial Times, Guardian).  The take-home message is the same as the animation in this Spinoff piece by Siouxsie Wiles and Toby Morris: distancing measures can potentially suppress the epidemic, but if they work we need to keep doing them until a vaccine arrives. “The major challenge of suppression is that this type of intensive intervention package – or something equivalently effective at reducing transmission – will need to be maintained until a vaccine becomes available (potentially 18 months or more) – given that we predict that transmission will quickly rebound if interventions are relaxed”
  • Alberto Cairo links to an interesting essay (previously a lecture,PDF) on ‘the ethics of counting’: “But wait!” the kid thinks to himself. “A grown-up lumped these different things together so I guess I’m supposed to consider them as the same.” Notice that when kids learn to count, they’re not just learning number words and symbols; they’re learning how adults see things
  • Via flowingdata.com, a map of all the trees and forests in the United States
  • From Kieran Healy, a map of all the rivers and streams in the US
  • Along similar lines, from the Herald a couple of years ago, a map of NZ with place names coloured by whether they are in te reo.
March 14, 2020

Stimulating the economy

You can divide most of the coronavirus stories in the world media into two groups: accurate and helpful information on the one hand, and harmful misinformation on the other.  The NZ media have been doing pretty well in keeping to the first sort.

There are a few stories in the middle, like this one at Newshub, that seem to be intended mostly as entertainment

Some people are making sure they will enjoy their time in quarantine, should it be enforced upon us. 

New Zealand sex retailer Adult Toy Megastore has reported a surge of sales in lubricant, vibrators and batteries in the wake of the pandemic. 

They don’t sell toilet paper or bottled water, so they’re bound to have somewhat different top products from the supermarkets, and there’s nothing really surprising here. In contrast to the previous StatsChat appearances of this store, they’re sticking to topics where they actually know the data, rather than overinterpreting bogus surveys.

There’s also a pointer to some medical advice, which is where the whole thing gets a bit more dodgy. The only reason I’m keeping this to “a bit” is that I don’t think you’re intended to really take the story seriously:

“Masturbation can produce the right environment for a strengthened immune system,” she told Men’s Health. 

Her views are backed up by a study from the Department of Medical Psychology at the University Clinic of Essen which looked at the effects of orgasm through masturbation on the white blood cell count.

A group of 11 volunteers were asked to participate in a study and the results confirmed that sexual arousal and orgasm increased the number of white blood cells.

The study is actually linked. It’s a paywalled paper, but here’s the abstract.

If you’ve got an experimental study of an intervention that might prevent viral infection, you’d want to know who was being studied, the sample size, and how representative they were.  You’d want to know what effects were being measured and over what period.  And you’d want to know to what extent the intervention was also present in the control group. In a serious clinical trial that sort of information would be in the abstract.

The abstract doesn’t actually say anything about the diversity of study population, apart from “11 volunteers”. The paper says “healthy young males” and notes they were all exclusively heterosexual and had an average age of 37.7 (so ‘young’ is being interpreted relatively broadly).  The participants were asked to refrain from sexual activity for 24 hours before the experiment, but that’s all.

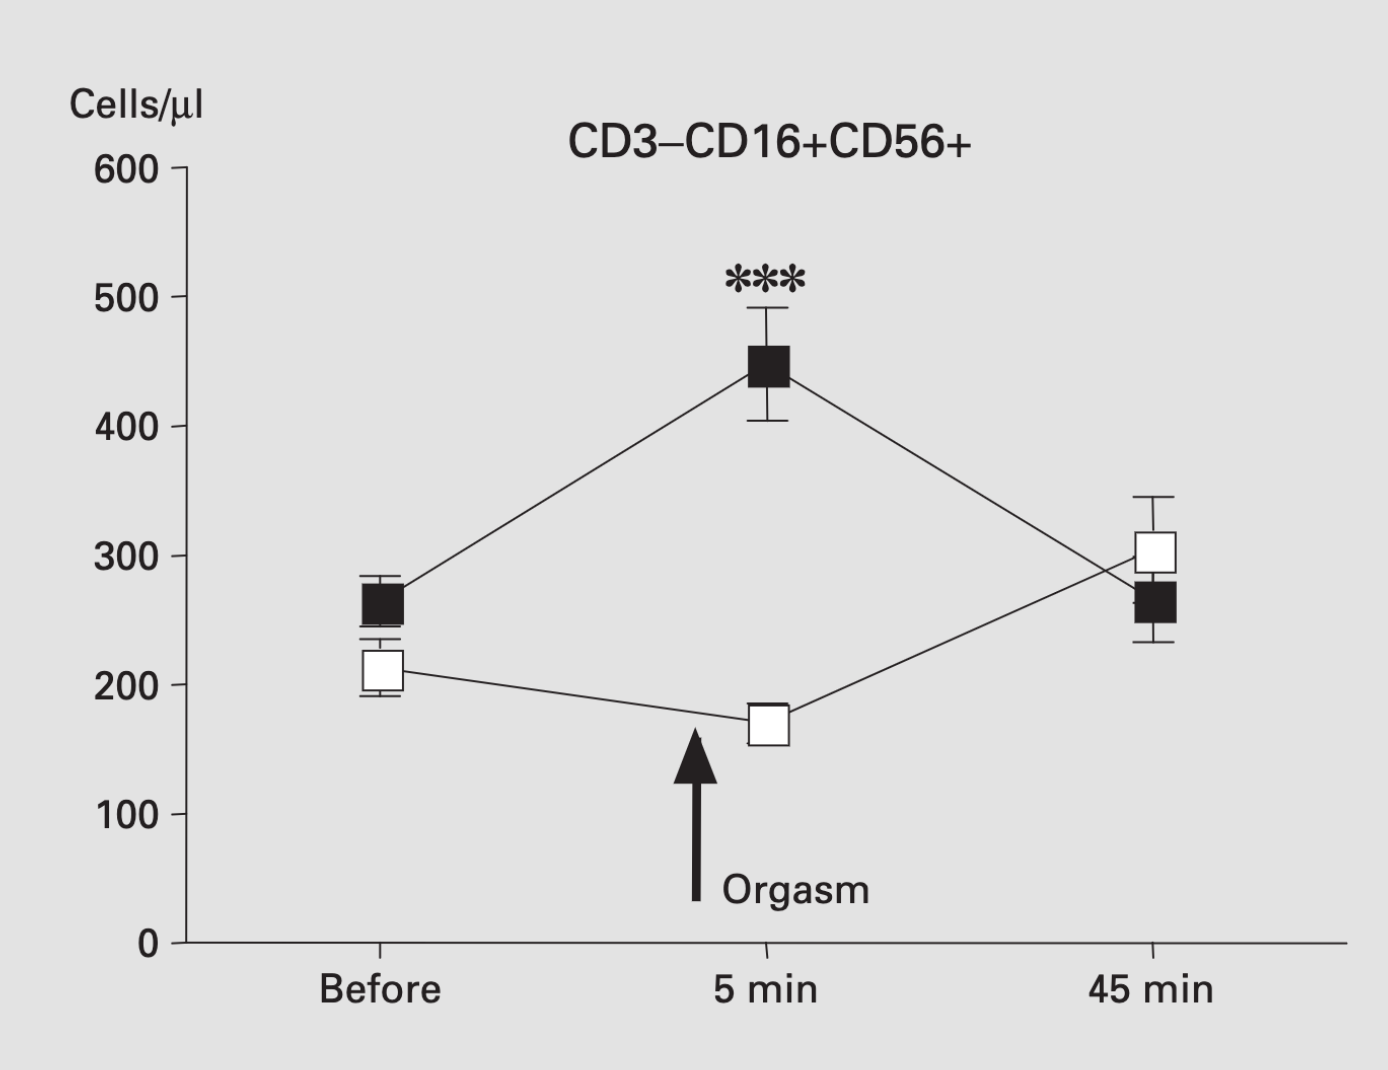
The abstract does talk, importantly, about “transient” changes in hormones. It’s less open about the changes in white blood cells.  The headline effect is that there were more “NK cells“, which are theoretically relevant to viral infection, 5 minutes after orgasm.  It’s not clear whether the increase is big enough to be helpful. However, the increase had gone away again by the second measurement at 45 minutes (so it’s probably safe). Here’s the graph
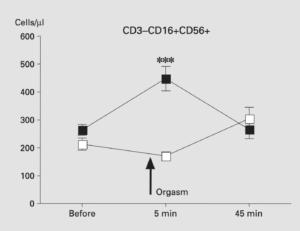
It’s not clear that we should believe these results, given the well-known problems with reporting and analysis bias in small experiment — and even without any issues in the scientific publication process, you can be pretty confident Newshub wouldn’t have mentioned unconfirmed results from a tiny experiment published in 2004 if it didn’t confirm what they wanted to say.  But suppose we do believe the results.  What does it tell us about COVID-19? Is this, as they say, news you can use? You might consider your times of greatest exposure to other people’s viruses and look for a half-hour window where greater immunity would be relevant. On the other hand, that might cause more problems than it solves. Alternatively, you could just wash your hands (actually, you should wash them either way).

Leaving aside the questions of appropriate time and place, I think the StatsChat advice on red wine and chocolate also applies here. If you’re thinking of a half-hour increase in one type of white blood cells as a convincing argument in favour of orgasms, you may be doing them wrong.

March 13, 2020

Why don’t we know the covid-19 mortality rate?

There are lots of questions about the current pandemic that need expertise in microbiology or international freight logistics or sociology or whatever, but there’s the occasional one that is basically statistical.  In particular,  lots of people would like to know how bad COVID-19 actually is: what’s your (or your kid, or your grandmother’s)  chance of needing hospital treatment or dying?  This post will try to explain why we don’t know the answer, and aren’t going to know the answer for a while, although there are some questions that sound similar where we do know the answer or will know fairly soon.

The mortality rate (case fatality rate) for a disease is the number of people who die from it divided by the number of people who catch it.  For the initial outbreak in China we have a reasonably good idea of the number of people who died (at least if you trust the PRC statistics), and the rest have recovered. We don’t know how many people were infected; the health system had more urgent things to do than testing apparently healthy people. The same is likely true for some of the smaller outbreaks in other Asian countries.  In the rest of the world we don’t even know the numerator of the rate, because most of the people who have been sick are still sick and we have to wait to see how many recover and how many die.

To some extent the mathematical epidemic models can work around this problem.  If people with few or no symptoms are still infectious,  they’ll contribute to the growth of the epidemic, and the number can be estimated from the shape of the epidemic curve.  That doesn’t work perfectly, but it works to some extent.  However, if people with few or no symptoms are less infectious, they’ll tend to be missed. People who have no symptoms and who don’t pass the virus on are invisible to the models, at least until there are enough people like that to get herd immunity working.  This post on Andrew Gelman’s blog looks at two fairly sophisticated modelling attempts, which don’t agree all that closely.

In the long run, it will be possible to get a reliable estimate of the number of people who have been infected, because they will end up with antibodies to the virus, and someone will develop a test for the antibodies and apply it to a suitable population sample.  That sort of data goes into the mortality rate estimates for flu: the mortality rate among people who develop classic, serious, flu symptoms is quite high, but there are a lot of people who are infected without ever knowing it — as much as 10% of the population — so the mortality rate among everyone infected is very low. In the same way, the retrospective mortality rate of COVID-19 will likely be lower (by some unknown factor) than the current ratio.

We do have reasonably good information on what happens to people who get sick enough to need medical attention, and  we know how that number grows with good or not so good control efforts. That’s the number that matters if you get sick. But we don’t know as much as we’d like about the structure of the epidemic and how many people will eventually get seriously ill, because we haven’t been able to find and count the subset of basically healthy cases.

March 10, 2020

Super Rugby Predictions for Round 7

Team Ratings for Round 7

The basic method is described on my Department home page.
Here are the team ratings prior to this week’s games, along with the ratings at the start of the season.

Current Rating Rating at Season Start Difference
Crusaders 14.82 17.10 -2.30
Chiefs 8.72 5.91 2.80
Hurricanes 7.53 8.79 -1.30
Jaguares 6.81 7.23 -0.40
Blues 4.10 -0.04 4.10
Sharks 3.73 -0.87 4.60
Brumbies 3.38 2.01 1.40
Stormers 1.27 -0.71 2.00
Bulls -0.14 1.28 -1.40
Highlanders -0.22 4.53 -4.70
Reds -1.61 -5.86 4.30
Lions -3.53 0.39 -3.90
Rebels -5.52 -7.84 2.30
Waratahs -5.82 -2.48 -3.30
Sunwolves -22.51 -18.45 -4.10


Performance So Far

So far there have been 40 matches played, 25 of which were correctly predicted, a success rate of 62.5%.
Here are the predictions for last week’s games.

Game Date Score Prediction Correct
1 Crusaders vs. Reds Mar 06 24 – 20 25.20 TRUE
2 Waratahs vs. Chiefs Mar 06 14 – 53 -4.10 TRUE
3 Hurricanes vs. Blues Mar 07 15 – 24 10.50 FALSE
4 Rebels vs. Lions Mar 07 37 – 17 1.50 TRUE
5 Sharks vs. Jaguares Mar 07 33 – 19 1.10 TRUE
6 Bulls vs. Highlanders Mar 07 38 – 13 3.20 TRUE
7 Sunwolves vs. Brumbies Mar 06 14 – 47 -17.80 TRUE


Predictions for Round 7

Here are the predictions for Round 7. The prediction is my estimated expected points difference with a positive margin being a win to the home team, and a negative margin a win to the away team.

Game Date Winner Prediction
1 Chiefs vs. Hurricanes Mar 13 Chiefs 5.70
2 Sunwolves vs. Crusaders Mar 14 Crusaders -31.30
3 Blues vs. Lions Mar 14 Blues 13.60
4 Reds vs. Bulls Mar 14 Reds 4.50
5 Sharks vs. Stormers Mar 14 Sharks 7.00
6 Jaguares vs. Highlanders Mar 14 Jaguares 13.00
7 Brumbies vs. Waratahs Mar 15 Brumbies 13.70


Rugby Premiership Predictions for Round 14

Team Ratings for Round 14

The basic method is described on my Department home page.
Here are the team ratings prior to this week’s games, along with the ratings at the start of the season.

Current Rating Rating at Season Start Difference
Exeter Chiefs 10.34 7.99 2.30
Saracens 7.45 9.34 -1.90
Sale Sharks 6.33 0.17 6.20
Wasps 1.43 0.31 1.10
Bristol -0.43 -2.77 2.30
Gloucester -0.49 0.58 -1.10
Northampton Saints -0.62 0.25 -0.90
Bath -1.61 1.10 -2.70
Harlequins -2.03 -0.81 -1.20
Leicester Tigers -3.41 -1.76 -1.70
Worcester Warriors -5.10 -2.69 -2.40
London Irish -5.65 -5.51 -0.10


Performance So Far

So far there have been 78 matches played, 52 of which were correctly predicted, a success rate of 66.7%.
Here are the predictions for last week’s games.

Game Date Score Prediction Correct
1 Bristol vs. Harlequins Mar 07 28 – 15 5.20 TRUE
2 Exeter Chiefs vs. Bath Mar 07 57 – 20 14.20 TRUE
3 Sale Sharks vs. London Irish Mar 07 39 – 0 14.00 TRUE
4 Saracens vs. Leicester Tigers Mar 07 24 – 13 16.00 TRUE
5 Wasps vs. Gloucester Mar 07 39 – 22 5.10 TRUE
6 Worcester Warriors vs. Northampton Saints Mar 07 10 – 16 0.80 FALSE


Predictions for Round 14

Here are the predictions for Round 14. The prediction is my estimated expected points difference with a positive margin being a win to the home team, and a negative margin a win to the away team.

Game Date Winner Prediction
1 Bath vs. London Irish Mar 21 Bath 8.50
2 Bristol vs. Saracens Mar 21 Saracens -3.40
3 Exeter Chiefs vs. Leicester Tigers Mar 21 Exeter Chiefs 18.20
4 Harlequins vs. Sale Sharks Mar 21 Sale Sharks -3.90
5 Northampton Saints vs. Wasps Mar 21 Northampton Saints 2.50
6 Worcester Warriors vs. Gloucester Mar 21 Gloucester -0.10


Pro14 Predictions for Round 14

Team Ratings for Round 14

The basic method is described on my Department home page.
Here are the team ratings prior to this week’s games, along with the ratings at the start of the season.

Current Rating Rating at Season Start Difference
Leinster 16.52 12.20 4.30
Munster 9.90 10.73 -0.80
Glasgow Warriors 5.66 9.66 -4.00
Edinburgh 5.49 1.24 4.20
Ulster 4.58 1.89 2.70
Scarlets 1.98 3.91 -1.90
Connacht 0.70 2.68 -2.00
Cardiff Blues 0.08 0.54 -0.50
Cheetahs -0.46 -3.38 2.90
Ospreys -2.82 2.80 -5.60
Treviso -3.50 -1.33 -2.20
Dragons -7.85 -9.31 1.50
Southern Kings -14.92 -14.70 -0.20
Zebre -15.37 -16.93 1.60


Performance So Far

So far there have been 89 matches played, 69 of which were correctly predicted, a success rate of 77.5%.
Here are the predictions for last week’s games.

Game Date Score Prediction Correct
1 Dragons vs. Treviso Feb 16 25 – 37 2.20 FALSE


Predictions for Round 14

Here are the predictions for Round 14. The prediction is my estimated expected points difference with a positive margin being a win to the home team, and a negative margin a win to the away team.

Game Date Winner Prediction
1 Connacht vs. Scarlets Mar 21 Connacht 5.20
2 Ulster vs. Dragons Mar 21 Ulster 18.90
3 Southern Kings vs. Edinburgh Mar 21 Edinburgh -13.90
4 Cardiff Blues vs. Zebre Mar 22 Cardiff Blues 21.90
5 Cheetahs vs. Leinster Mar 22 Leinster -10.50
6 Ospreys vs. Glasgow Warriors Mar 22 Glasgow Warriors -2.00
7 Treviso vs. Munster Mar 22 Munster -6.90


NRL Predictions for Round 1

Team Ratings for Round 1

The basic method is described on my Department home page.
Here are the team ratings prior to this week’s games, along with the ratings at the start of the season.

Current Rating Rating at Season Start Difference
Storm 12.73 12.73 -0.00
Roosters 12.25 12.25 0.00
Raiders 7.06 7.06 0.00
Rabbitohs 2.85 2.85 0.00
Eels 2.80 2.80 -0.00
Sharks 1.81 1.81 0.00
Sea Eagles 1.05 1.05 0.00
Panthers -0.13 -0.13 0.00
Wests Tigers -0.18 -0.18 0.00
Bulldogs -2.52 -2.52 -0.00
Cowboys -3.95 -3.95 0.00
Warriors -5.17 -5.17 -0.00
Broncos -5.53 -5.53 0.00
Knights -5.92 -5.92 0.00
Dragons -6.14 -6.14 -0.00
Titans -12.99 -12.99 -0.00


Predictions for Round 1

Here are the predictions for Round 1. The prediction is my estimated expected points difference with a positive margin being a win to the home team, and a negative margin a win to the away team.

Game Date Winner Prediction
1 Eels vs. Bulldogs Mar 12 Eels 7.30
2 Raiders vs. Titans Mar 13 Raiders 22.00
3 Cowboys vs. Broncos Mar 13 Cowboys 3.60
4 Knights vs. Warriors Mar 14 Knights 3.70
5 Rabbitohs vs. Sharks Mar 14 Rabbitohs 3.00
6 Panthers vs. Roosters Mar 14 Roosters -10.40
7 Sea Eagles vs. Storm Mar 15 Storm -9.70
8 Dragons vs. Wests Tigers Mar 15 Wests Tigers -4.00


Stabbing stats

From the Herald (and from the front page in the squashed-trees edition)

I’m not disputing the basic message that people being stabbed is bad and we’d like less of it.  And it’s good that numbers are being given, but there’s at least three issues with those numbers.  On top of the familiar “quote a total over four years because it’s bigger”.

The first is that the numbers don’t refer exclusively to “Aucklanders”.  As the story says

But a spokeswoman noted it was a regional 24/7 trauma centre for patients around Auckland and Northland, meaning many of the most serious trauma cases were directed to Auckland Hospital.

And secondly, the definition of ‘stabbing injury’ varies by DHB: Auckland DHB was reporting only stab wounds from assaults and self-harm, but

Counties Manukau chief executive Fepulea’i Margie Apa said the DHB’s figures included all stabbing injuries from any cause, “not only those from violence”.

Are there many cases of accidental stabbings? Well, we regularly get told about carving-knife accidents at Christmas, and about ‘avocado hand’, so there are some, but it’s hard to guess how many.  If you were doing this seriously, you’d come up with a list of relevant ICD-10 categories and ask the DHBs for numbers in those categories, but that takes medical knowledge and might risk a ‘too hard’ refusal from the DHB.

The third issue is going from 1750 in four years to “at least one every day”.  On average, there were about 1.2 events per day.  At that rate it would be really surprising (and newsworthy) if there was at least one every day. You’d expect them to clump more than that.

The simplest mathematical model for counts of events is the Poisson process, which has no ‘built-in’ clumping: it describes a world where there are no high-risk days (hot, humid Saturday nights? Bad sports results?), and where all stabbings are independent (no multiple-stabbing fights or robberies).  Even under the Poisson model, you would expect about 30% of days to have no stabbings.   In the real world, you’d expect more days with two or more stabbings and more days with zero.

Getting less clumpiness than a Poisson model takes some sort of conspiracy.  The best-known NZ example is two-dimensional (space) rather than one-dimensional (time), as in this photo by Flickr user Alexander Kesselaar


Glow worms in a cave spread out more evenly than a Poisson process would predict, because they keep away from each other. Stabbings probably don’t


March 3, 2020

Super Rugby Predictions for Round 6

Team Ratings for Round 6

The basic method is described on my Department home page.
Here are the team ratings prior to this week’s games, along with the ratings at the start of the season.

Current Rating Rating at Season Start Difference
Crusaders 16.23 17.10 -0.90
Hurricanes 8.84 8.79 0.00
Jaguares 7.70 7.23 0.50
Chiefs 6.52 5.91 0.60
Sharks 2.84 -0.87 3.70
Blues 2.79 -0.04 2.80
Brumbies 2.34 2.01 0.30
Stormers 1.27 -0.71 2.00
Highlanders 1.22 4.53 -3.30
Bulls -1.59 1.28 -2.90
Lions -2.28 0.39 -2.70
Reds -3.02 -5.86 2.80
Waratahs -3.62 -2.48 -1.10
Rebels -6.77 -7.84 1.10
Sunwolves -21.46 -18.45 -3.00


Performance So Far

So far there have been 33 matches played, 19 of which were correctly predicted, a success rate of 57.6%.
Here are the predictions for last week’s games.

Game Date Score Prediction Correct
1 Highlanders vs. Rebels Feb 28 22 – 28 17.00 FALSE
2 Waratahs vs. Lions Feb 28 29 – 17 3.00 TRUE
3 Hurricanes vs. Sunwolves Feb 29 62 – 15 34.60 TRUE
4 Reds vs. Sharks Feb 29 23 – 33 1.80 FALSE
5 Stormers vs. Blues Feb 29 14 – 33 8.00 FALSE
6 Bulls vs. Jaguares Feb 29 24 – 39 -1.40 TRUE


Predictions for Round 6

Here are the predictions for Round 6. The prediction is my estimated expected points difference with a positive margin being a win to the home team, and a negative margin a win to the away team.

Game Date Winner Prediction
1 Crusaders vs. Reds Mar 06 Crusaders 25.20
2 Waratahs vs. Chiefs Mar 06 Chiefs -4.10
3 Hurricanes vs. Blues Mar 07 Hurricanes 10.50
4 Rebels vs. Lions Mar 07 Rebels 1.50
5 Sharks vs. Jaguares Mar 07 Sharks 1.10
6 Bulls vs. Highlanders Mar 07 Bulls 3.20
7 Sunwolves vs. Brumbies Mar 08 Brumbies -17.80


Rugby Premiership Predictions for Round 13

Team Ratings for Round 13

The basic method is described on my Department home page.
Here are the team ratings prior to this week’s games, along with the ratings at the start of the season.

Current Rating Rating at Season Start Difference
Exeter Chiefs 9.20 7.99 1.20
Saracens 7.77 9.34 -1.60
Sale Sharks 5.10 0.17 4.90
Wasps 0.77 0.31 0.50
Gloucester 0.17 0.58 -0.40
Bath -0.47 1.10 -1.60
Bristol -0.89 -2.77 1.90
Northampton Saints -1.03 0.25 -1.30
Harlequins -1.57 -0.81 -0.80
Leicester Tigers -3.72 -1.76 -2.00
London Irish -4.41 -5.51 1.10
Worcester Warriors -4.69 -2.69 -2.00


Performance So Far

So far there have been 72 matches played, 47 of which were correctly predicted, a success rate of 65.3%.
Here are the predictions for last week’s games.

Game Date Score Prediction Correct
1 Bath vs. Bristol Feb 29 13 – 19 6.30 FALSE
2 Gloucester vs. Sale Sharks Feb 29 17 – 23 0.30 FALSE
3 Harlequins vs. Exeter Chiefs Feb 29 34 – 30 -7.50 FALSE
4 Leicester Tigers vs. Worcester Warriors Feb 29 14 – 8 5.40 TRUE
5 London Irish vs. Wasps Feb 29 26 – 36 0.50 FALSE
6 Northampton Saints vs. Saracens Feb 29 21 – 27 -4.00 TRUE


Predictions for Round 13

Here are the predictions for Round 13. The prediction is my estimated expected points difference with a positive margin being a win to the home team, and a negative margin a win to the away team.

Game Date Winner Prediction
1 Bristol vs. Harlequins Mar 07 Bristol 5.20
2 Exeter Chiefs vs. Bath Mar 07 Exeter Chiefs 14.20
3 Sale Sharks vs. London Irish Mar 07 Sale Sharks 14.00
4 Saracens vs. Leicester Tigers Mar 07 Saracens 16.00
5 Wasps vs. Gloucester Mar 07 Wasps 5.10
6 Worcester Warriors vs. Northampton Saints Mar 07 Worcester Warriors 0.80