May 23, 2015

Data-driven journalism at Canon Media Awards

I had the chance to attend the Canon Media Awards Night, as a guest of the Science Media Centre (who are one of the sponsors).

It was a good year for data journalism.  Harkanwal Singh and his team won “Best use of interactive graphics” and “Best multimedia storytelling” for projects based on effective communication of publicly-available data.

Perhaps more importantly for the future, the citation for the Herald’s “Best digital cross-platform news coverage”  explicitly called out the integration of data:

“The combination of exclusive breaking stories, data journalism, use of the digital media platforms and social coverage, meant the user’s experience was both exciting and broad.”

with similar comments in the citation for best website.

Bloggers can do data analysis and visualisation. What the professional media can do that we usually can’t is combine this with traditional reporting — stories of individual experience, or detailed investigation of who is hiding what and why.

For the consumer of traditional journalism, data literacy gives context — is this the tip of the iceberg or just the tip of the icecube? Interactive, visual data publishing adds the opportunity for readers to explore further and have deeper engagement with the story.

May 22, 2015

Budget viz

Aaron Schiff has collected visualisations of the overall NZ 2015 budget

A useful one that no-one’s done yet would be something showing how the $25 benefit increase works out with other benefits being considered as income — either in terms of the distribution of net benefit increases or in terms of effective marginal tax rate.

May 21, 2015

Fake data in important political-science experiment

Last year, a research paper came out in Science demonstrating an astonishingly successful strategy for gaining support for marriage equality: a short, face-to-face personal conversation with a gay person affected by the issue. As the abstract of the paper said

Can a single conversation change minds on divisive social issues, such as same-sex marriage? A randomized placebo-controlled trial assessed whether gay (n = 22) or straight (n = 19) messengers were effective at encouraging voters (n = 972) to support same-sex marriage and whether attitude change persisted and spread to others in voters’ social networks. The results, measured by an unrelated panel survey, show that both gay and straight canvassers produced large effects initially, but only gay canvassers’ effects persisted in 3-week, 6-week, and 9-month follow-ups. We also find strong evidence of within-household transmission of opinion change, but only in the wake of conversations with gay canvassers. Contact with gay canvassers further caused substantial change in the ratings of gay men and lesbians more generally. These large, persistent, and contagious effects were confirmed by a follow-up experiment. Contact with minorities coupled with discussion of issues pertinent to them is capable of producing a cascade of opinion change.

Today, the research paper is going away again. It looks as though the study wasn’t actually done. The conversations were done: the radio program “This American Life” gave a moving report on them. The survey of the effect, apparently not so much. The firm who were supposed to have done the survey deny it, the organisations supposed to have funded it deny it, the raw data were ‘accidentally deleted’.

This was all brought to light by a group of graduate students who wanted to do a similar experiment themselves. When they looked at the reported data, it looked strange in a lot of ways (PDF). It was of better quality than you’d expect: good response rates, very similar measurements across two cities,  extremely good before-after consistency in the control group. Further investigation showed before-after changes fitting astonishingly well to a Normal distribution, even for an attitude measurement that started off with a huge spike at exactly 50 out of 100. They contacted the senior author on the paper, an eminent and respectable political scientist. He agreed it looked strange, and on further investigation asked for the paper to be retracted. The other author, Michael LaCour, is still denying any fraud and says he plans to present a comprehensive response.

Fake data that matters outside the world of scholarship is more familiar in medicine. A faked clinical trial by Werner Bezwoda led many women to be subjected to ineffective, extremely-high-dose chemotherapy. Scott Reuben invented all the best supporting data for a new approach to pain management; a review paper in the aftermath was titled “Perioperative analgesia: what do we still know?”  Michael LaCour’s contribution, as Kieran Healy describes, is that his approach to reducing prejudice has been used in the Ireland marriage equality campaign. Their referendum is on Friday.

Briefly

  • Sometimes people with an axe to grind are right. In this case the people who cast aspersions on the leading data-based research opposing same-sex parenting. The closer they look at the data, the less convincing it is. (NY Magazine, new research paper) “The reanalysis illustrates the importance of methodological decisions in research”
  • A study of spreadsheets in their natural habitat: blog post, paper by Felienne Harmans
  • Facetted barcharts and fluctuation diagrams, from Di Cook. The data describes the responses of couples on questions about their sex life.
  • Looking at scientists giving advice on politically controversial topics: a case study of badger culling in the UK by Helen Briggs. “The badgers moved the goalposts”
  • From the New Zealand conference ‘Going Public,’ on the same topic, a post by Dr SM Morgan , who works on health literacy. “Find something complementary to say about a scientific colleague’s scicomm efforts and imagine saying it out loud to their face.”
May 20, 2015

Actually it’s about neuroscience in videogame journalism

Q: Why does Stuff think playing ‘Call of Duty’ increases the risk of Alzheimer’s disease? I didn’t think old people played violent video games much.

A: I don’t think Stuff does think anything in particular about it. They just reprinted that from the Telegraph and trimmed out the casual sexism.

Q: Ok, why does the Telegraph think playing ‘Call of Duty’ increases the risk of Alzheimer’s disease? I didn’t think old people played violent video games much.

A: It’s not so much about the games they play now as the ones they played 60 years earlier

Q: What video games did they play 60 years ago?

A: Not current people with Alzheimer’s; gamers now who might get Alzheimer’s in a few decades.

Q: Ok, so why will that happen?

A: Because video game players use response learning strategies for navigation in video mazes

Q: Why is that bad?

A: Because other research found people who used those strategies had more activity in their caudate nucleus.

Q: Is this going to start making sense soon?

A:. Yes. Sorry. The research found that when navigating a virtual-reality maze habitual game players used strategies that had previously been correlated with less activity in a part of the brain involved in memory and spatial awareness than normal people did. They apparently used different strategies involving other parts of the brain.

Q: And why is this a problem?

A: Because that part of the brain, the hippocampus, is less active in people with Alzheimer’s, as well as some other neurological and psychological disorders

Q: While they’re playing video games?

A: No, all the time.

Q: Couldn’t it just be that the video gamers have developed a more efficient strategy and that their hippocampuses are perfectly fine. Or hippocampi, whatever?

A: Yes, that could also be the case.

Q: I mean, if you saw people twitching their thumbs rapidly playing a video game it would be fine, but if they were just doing that while sitting around at meetings you’d worry a bit.

A: Indeed.

Q: Did the research look at memory or cognition at all?

A: No.

Q: Do they even know that these brain differences happened after playing video games? Could it be that people who don’t use that part of the brain for video navigation are just better at games?

A: It could be, yes.

Q: The story quotes the percentages using the parts of their brain to four significant digits. Does that mean there were tens of thousands of people in the research?

A: No.

Q: How many?

A: 59: about 30 in each group

Q: If this was true, could it explain why dementia is increasingly common?

A: No.

Q: Why not?

A: Partly because it’s too soon, and partly because dementia isn’t increasingly common at a given age, at least in the US and Europe. If anything, it’s less common. There are more cases now because there are more old people.

Q: It sounds like more research might be needed before writing international headlines about the risk of a terrifying disease.

A: You think?
NRL Predictions for Round 11

Team Ratings for Round 11

The basic method is described on my Department home page.

Here are the team ratings prior to this week’s games, along with the ratings at the start of the season.

Current Rating Rating at Season Start Difference
Roosters 9.18 9.09 0.10
Cowboys 7.37 9.52 -2.20
Rabbitohs 6.05 13.06 -7.00
Storm 5.13 4.36 0.80
Broncos 3.81 4.03 -0.20
Dragons 2.04 -1.74 3.80
Panthers 1.01 3.69 -2.70
Warriors 0.85 3.07 -2.20
Knights -1.67 -0.28 -1.40
Raiders -1.82 -7.09 5.30
Sea Eagles -2.10 2.68 -4.80
Bulldogs -2.14 0.21 -2.30
Sharks -5.61 -10.76 5.10
Eels -6.88 -7.19 0.30
Wests Tigers -6.90 -13.13 6.20
Titans -6.97 -8.20 1.20


Performance So Far

So far there have been 80 matches played, 44 of which were correctly predicted, a success rate of 55%.

Here are the predictions for last week’s games.

Game Date Score Prediction Correct
1 Bulldogs vs. Roosters May 15 10 – 24 -7.30 TRUE
2 Cowboys vs. Broncos May 15 31 – 20 5.80 TRUE
3 Eels vs. Warriors May 16 13 – 17 -3.70 TRUE
4 Storm vs. Rabbitohs May 16 16 – 12 1.70 TRUE
5 Titans vs. Sharks May 16 22 – 23 2.10 FALSE
6 Dragons vs. Raiders May 17 32 – 18 5.70 TRUE
7 Knights vs. Wests Tigers May 17 22 – 12 7.90 TRUE
8 Sea Eagles vs. Panthers May 18 10 – 11 0.10 FALSE


Predictions for Round 11

Here are the predictions for Round 11. The prediction is my estimated expected points difference with a positive margin being a win to the home team, and a negative margin a win to the away team.

Game Date Winner Prediction
1 Rabbitohs vs. Eels May 22 Rabbitohs 15.90
2 Wests Tigers vs. Cowboys May 23 Cowboys -11.30
3 Raiders vs. Bulldogs May 24 Raiders 3.30
4 Knights vs. Broncos May 25 Broncos -2.50


Super 15 Predictions for Round 15

Team Ratings for Round 15

The basic method is described on my Department home page.

Here are the team ratings prior to this week’s games, along with the ratings at the start of the season.

Current Rating Rating at Season Start Difference
Crusaders 8.89 10.42 -1.50
Waratahs 6.20 10.00 -3.80
Hurricanes 5.54 2.89 2.60
Chiefs 4.44 2.23 2.20
Brumbies 4.16 2.20 2.00
Highlanders 2.77 -2.54 5.30
Bulls 2.73 2.88 -0.10
Stormers 2.35 1.68 0.70
Blues -0.44 1.44 -1.90
Sharks -1.94 3.91 -5.90
Lions -3.00 -3.39 0.40
Rebels -4.59 -9.53 4.90
Force -4.80 -4.67 -0.10
Cheetahs -6.69 -5.55 -1.10
Reds -8.61 -4.98 -3.60


Performance So Far

So far there have been 92 matches played, 60 of which were correctly predicted, a success rate of 65.2%.

Here are the predictions for last week’s games.

Game Date Score Prediction Correct
1 Blues vs. Bulls May 15 23 – 18 0.70 TRUE
2 Reds vs. Rebels May 15 46 – 29 -2.20 FALSE
3 Hurricanes vs. Chiefs May 16 22 – 18 5.30 TRUE
4 Waratahs vs. Sharks May 16 33 – 18 12.10 TRUE
5 Lions vs. Brumbies May 16 20 – 30 -1.60 TRUE
6 Cheetahs vs. Highlanders May 16 24 – 45 -2.90 TRUE


Predictions for Round 15

Here are the predictions for Round 15. The prediction is my estimated expected points difference with a positive margin being a win to the home team, and a negative margin a win to the away team.

Game Date Winner Prediction
1 Chiefs vs. Bulls May 22 Chiefs 6.20
2 Reds vs. Sharks May 22 Sharks -2.20
3 Blues vs. Hurricanes May 23 Hurricanes -2.00
4 Waratahs vs. Crusaders May 23 Waratahs 1.80
5 Force vs. Highlanders May 23 Highlanders -3.10
6 Cheetahs vs. Lions May 23 Cheetahs 0.30
7 Stormers vs. Rebels May 23 Stormers 11.40


Weather uncertainty

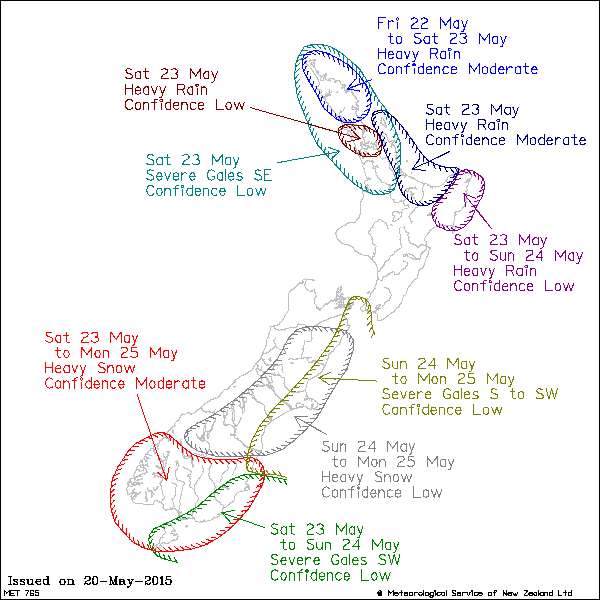
From the MetService warnings page

7567-14d6e9ea400-14d78eb5c00-14d6f31d538.0

The ‘confidence’ levels are given numerically on the webpage as 1 in 5 for ‘Low’, 2 in 5 for ‘Moderate’ and 3 in 5 for ‘High’. I don’t know how well calibrated these are, but it’s a sensible way of indicating uncertainty.  I think the hand-drawn look of the map also helps emphasise the imprecision of forecasts.

(via Cate Macinnis-Ng on Twitter)

May 18, 2015

Stat of the Week Competition: May 16 – 22 2015

Each week, we would like to invite readers of Stats Chat to submit nominations for our Stat of the Week competition and be in with the chance to win an iTunes voucher.

Here’s how it works:

  • Anyone may add a comment on this post to nominate their Stat of the Week candidate before midday Friday May 22 2015.
  • Statistics can be bad, exemplary or fascinating.
  • The statistic must be in the NZ media during the period of May 16 – 22 2015 inclusive.
  • Quote the statistic, when and where it was published and tell us why it should be our Stat of the Week.

Next Monday at midday we’ll announce the winner of this week’s Stat of the Week competition, and start a new one.

(more…)

May 17, 2015

Polling is hard

Part One: Affiliation and pragmatics

The US firm Public Policy Polling released a survey of (likely) US Republican primary voters last week.  This firm has a habit of including the occasional question that some people would consider ‘interesting context’ and others would call ‘trolling the respondents.’

This time it was a reference to the conspiracy theory about the Jade Helm military exercises in Texas: “Do you think that the Government is trying to take over Texas or not?”

32% of respondents said “Yes”. 28% said “Not sure”. Less than half were confident there wasn’t an attempt to take over Texas. There doesn’t seem to be widespread actual belief in the annexation theory, in the sense that no-one is doing anything to prepare for or prevent it. We can be pretty sure that most of the 60% were not telling the truth. Their answer was an expression of affiliation rather than an accurate reflection of their beliefs. That sort of thing can be problem for polling.

Part Two: Mode effects and social pressure

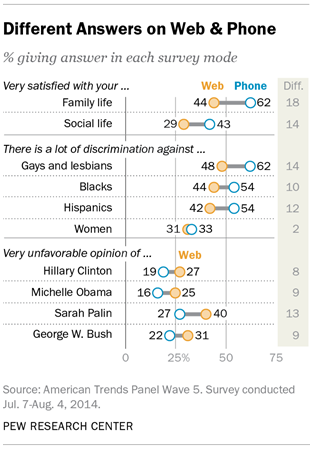
The American Association for Public Opinion Research is having their annual conference, so there’s new and exciting survey research coming out (to the extent that ‘new and exciting survey research’ isn’t an oxymoron). The Pew Research Center took two random groups of 1500 people from one of their panels and asked one group questions over the phone and the other group the same questions on a web form.  For most questions the two groups agreed pretty well: not much more difference than you’d expect from random sampling variability. For some questions, the differences were big:

mode-study-01

It’s not possible to tell from these data which set of answers is more accurate, but the belief in the field is that people give more honest answers to computers than to other people.