May 4, 2015

On algorithmic transparency

An important emerging area of statistics is algorithmic transparency: what information is your black-box analytics system really relying on, and should it?

From Matt Levine

The materiality standard that controls so much of securities law comes from an earlier, simpler time; a time when reasonable people could look at a piece of information and say “oh, yes, of course that will move the stock up” (or down), and if they couldn’t then they wouldn’t bother with it. Modern financial markets are not so intuitive: Algorithms are interested in information that reasonable humans cannot process, with the result that reasonable humans can’t always predict how significant any piece of information is. That’s a world that is more complicated for investors, but it also seems to me to be more complicated for insider trading regulation. And I’m not sure that regulation has really kept up.


US racial disparity: how do we compare?

There’s a depressing chart at Fusion, originally from the Economist, that shows international comparisons for infant mortality, homicide, life expectancy, and imprisonment, with White America and Black America broken out as if they were separate countries.

Originally, I was just going to link to the chart, but I thought I should look at how Māori/Pākehā  disparities compare. European-ancestry New Zealanders and Māori make up roughly the same proportions of the NZ population as self-identified White and Black do in the US. The comparison is depressing, but also interesting: showing how ratios and differences give you different results.

First, infant mortality.  Felix Salmon writes

A look at infant mortality, a key indicator of development, is just as grim. Iceland has 1.6 deaths per 1,000 births; South Korea has 3.2. “White America” is pretty bad — by developed-country standards — with 5.1 deaths per 1,000 births. But “Black America,” again, is much, much worse: at 11.2 deaths per 1,000 births, it’s worse than Romania or China.

According to the Ministry of Health,  Māori infant mortality was 7.7/1000 in 2011 compared to 3.7/1000 for non-Māori, non-Pacific. According to StatsNZ, the rate for Māori was lower in 2012 (the numbers don’t quite match: different definitions or provisional data).  So, the Māori/Pakeha ratio is similar to the Black/White ratio in the US, but the difference is quite a bit smaller here.

Incarceration rates show a similar pattern. In the US, the rate is 2207/100k for Blacks and 380/100k for Whites.  In New Zealand, the rates are (about) 700/100k for Māori and 100/100k for European-ancestry. The NZ figures include people on remand; I don’t know if the US figures do. The ratio is a bit lower in New Zealand, but the difference is dramatically lower.

Homicide rates are harder to compare, because New Zealand only started collecting ethnicity of victims last year, and because NZ.Stat will only show you one month of data at a time. However, it looks as though the ratio is a lot less than the nearly 9 in the US. More importantly, the overall rate is much lower here: our rate is 0.9 per 100k, the overall US rate is 4.5 per 100k.

If the Māori/Pākehā disparities are slightly less serious than US Black/White disparities as ratios but much less serious as differences, which comparison is the right one? To some extent this depends on the question: risk ratios may be more relevant as indicators of structural problems, but risk differences are what actually matter to individuals.

Briefly

  • From the Guardian, in an otherwise-sensible piece talking about decreases in infant mortality “So things are getting better. The small wrinkly proto-Royal that just emerged from the national womb will have thrice the chance of surviving that her father and I did, just through the privilege of being born in 2015.” It’s pretty obvious this is wrong.  If you use the numbers in the previous paragraph, the change is from 98.9% to 99.6%, which isn’t a threefold increase.
  • From Mashable: “Facebook turns the London Eye into big UK election pie chart”. Not only is it a pie chart, it’s a pie chart of Facebook mentions, positive or negative, for each party

facebook-election

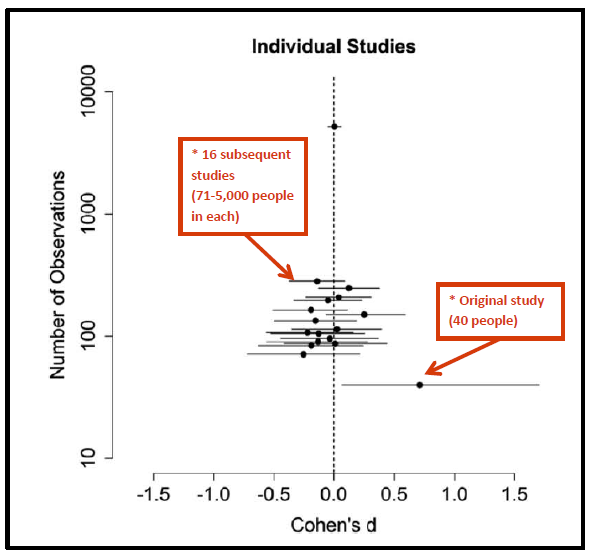
  •  Terry Burnham writes about a neat cognitive hack: using fonts that are too small, in order to make people concentrate and learn more. There’s even evidence that it works; it’s just there’s a whole lot more evidence that it doesn’t. Dramatic small-sample experimental findings really can be misleading, it isn’t just statisticians being gratuitously cynical
    png_base64db8e9525745b448


Stat of the Week Competition: May 2 – 8 2015

Each week, we would like to invite readers of Stats Chat to submit nominations for our Stat of the Week competition and be in with the chance to win an iTunes voucher.

Here’s how it works:

  • Anyone may add a comment on this post to nominate their Stat of the Week candidate before midday Friday May 8 2015.
  • Statistics can be bad, exemplary or fascinating.
  • The statistic must be in the NZ media during the period of May 2 – 8 2015 inclusive.
  • Quote the statistic, when and where it was published and tell us why it should be our Stat of the Week.

Next Monday at midday we’ll announce the winner of this week’s Stat of the Week competition, and start a new one.

(more…)

May 1, 2015

If it seems too good to be true

This one is originally from the Telegraph, but it’s one where you might expect the local editors to exercise a little caution in reposting it

A test that can predict with 100 per cent accuracy whether someone will develop cancer up to 13 years in the future has been devised by scientists.

It’s very unlikely that the accuracy could be 100%. Even it is was,  it’s very unlikely that the scientists could know it was 100% accurate by the time they first published results.

One doesn’t need to go as far as the open-access research paper to confirm one’s suspicions. The press release from Northwestern University doesn’t have anything like the 100% claim in it; there are no accuracy claims made at all.

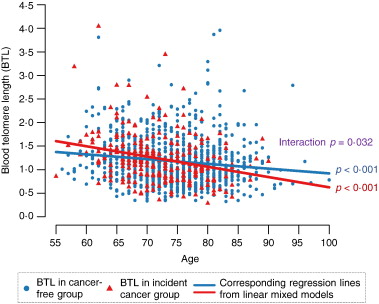
If you do go to the research paper, just looking at the pictures helps. In this graph (figure 1), the red dots are people who ended up with a cancer diagnosis; the blue dots are those who didn’t. There’s a difference between the two groups, but nothing like the complete separation you’d see with 100% accuracy.

1-s2.0-S2352396415001024-gr1

Reading the Discussion section, where the researchers tend to be at least somewhat honest about limitations of their research

Our study participants were all male and mostly Caucasian, thus studies of females and non-Caucasians are warranted to confirm our findings more broadly. Our sample size limited our ability to analyze specific cancer subtypes other than prostate cancer. Thus, caution should be exercised in interpreting our results as different cancer subtypes have different biological mechanisms, and our low sample size increases the possibility of our findings being due to random chance and/or our measures of association being artificially high.

Often, exaggerated claims in the media can be traced to press releases or to comments by researchers. In this case it’s hard to see the scientists being at fault; it looks as if it’s the Telegraph that has come up with the “100% accuracy” claim and the consequent fears for the future of the insurance industry.


(Thanks to Mark Hanna for pointing this one out on Twitter)


Have your say on the 2018 census


StatsNZ has a discussion forum on the 2018 Census

census

They say

The discussion on Loomio will be open from 30 Apr to 10 Jun 2015.

Your discussions will be considered as an input to final decision making.

Your best opportunity to influence census content is to make a submission. Statistics NZ will use this 2018 Census content determination framework to make final decisions on content. The formal submission period will be open from 18 May until 30 Jun 2015 via www.stats.govt.nz.

So, if you have views on what should be asked and how it should be asked, join in the discussion and/or make a submission


April 30, 2015

Half the median

From the Herald, under the headline “First-home buyers nab new home subsidies”

The AMP 360 First Home Buyer Affordability Report, published yesterday, shows housing remains “affordable” in all regions except Auckland and Queenstown.

The index tracked the lower-quartile (halfway between zero and the median) selling prices of houses and the median after-tax income of typical first-home buyers (a working couple both aged 25 to 29).

The lower quartile is not “halfway between zero and the median”. The lower quartile is the price that 25% of sales are below and 75% are above.

What’s more, the interpretation is obviously wrong. If you take the first Google link, at interest.co.nz, there’s a table by region, and it lists the lower quartile price for Auckland metro as $587000 and Auckland City as $681000. The Herald reports the median price often enough that they must know it isn’t over a million dollars.

While I’m complaining: the data table at interest.co.nz is in a state of sin. It’s not actually a data table; it’s a picture of a data table, a GIF image.

April 29, 2015

NRL Predictions for Round 9

Team Ratings for Round 9

The basic method is described on my Department home page.

Here are the team ratings prior to this week’s games, along with the ratings at the start of the season.

Current Rating Rating at Season Start Difference
Roosters 7.59 9.09 -1.50
Cowboys 7.39 9.52 -2.10
Rabbitohs 6.39 13.06 -6.70
Broncos 4.48 4.03 0.40
Storm 4.19 4.36 -0.20
Dragons 1.27 -1.74 3.00
Warriors 0.70 3.07 -2.40
Panthers 0.64 3.69 -3.10
Knights -1.91 -0.28 -1.60
Sea Eagles -1.94 2.68 -4.60
Bulldogs -2.06 0.21 -2.30
Raiders -3.64 -7.09 3.40
Titans -4.31 -8.20 3.90
Wests Tigers -5.64 -13.13 7.50
Sharks -5.72 -10.76 5.00
Eels -6.09 -7.19 1.10


Performance So Far

So far there have been 64 matches played, 30 of which were correctly predicted, a success rate of 46.9%.

Here are the predictions for last week’s games.

Game Date Score Prediction Correct
1 Bulldogs vs. Wests Tigers Apr 24 14 – 38 11.30 FALSE
2 Broncos vs. Eels Apr 25 28 – 16 13.90 TRUE
3 Knights vs. Cowboys Apr 25 24 – 26 -7.00 TRUE
4 Roosters vs. Dragons Apr 25 12 – 14 11.20 FALSE
5 Storm vs. Sea Eagles Apr 25 10 – 12 11.00 FALSE
6 Warriors vs. Titans Apr 25 28 – 32 11.10 FALSE
7 Panthers vs. Sharks Apr 26 26 – 18 9.60 TRUE
8 Rabbitohs vs. Raiders Apr 26 22 – 30 16.40 FALSE


Predictions for Round 9

Here are the predictions for Round 9. The prediction is my estimated expected points difference with a positive margin being a win to the home team, and a negative margin a win to the away team.

Game Date Winner Prediction
1 Broncos vs. Panthers May 08 Broncos 6.80
2 Roosters vs. Wests Tigers May 08 Roosters 16.20
3 Cowboys vs. Bulldogs May 09 Cowboys 12.40
4 Raiders vs. Titans May 09 Raiders 3.70
5 Sharks vs. Warriors May 09 Warriors -2.40
6 Eels vs. Storm May 10 Storm -7.30
7 Sea Eagles vs. Knights May 10 Sea Eagles 3.00
8 Rabbitohs vs. Dragons May 11 Rabbitohs 8.10


Super 15 Predictions for Round 12

Team Ratings for Round 12

The basic method is described on my Department home page.

Here are the team ratings prior to this week’s games, along with the ratings at the start of the season.

Current Rating Rating at Season Start Difference
Crusaders 8.05 10.42 -2.40
Waratahs 6.58 10.00 -3.40
Hurricanes 5.66 2.89 2.80
Chiefs 4.75 2.23 2.50
Brumbies 3.65 2.20 1.40
Bulls 3.63 2.88 0.80
Stormers 3.44 1.68 1.80
Highlanders 0.59 -2.54 3.10
Blues -0.06 1.44 -1.50
Sharks -0.50 3.91 -4.40
Lions -3.42 -3.39 -0.00
Rebels -5.09 -9.53 4.40
Force -5.25 -4.67 -0.60
Cheetahs -6.48 -5.55 -0.90
Reds -8.56 -4.98 -3.60


Performance So Far

So far there have been 73 matches played, 48 of which were correctly predicted, a success rate of 65.8%.

Here are the predictions for last week’s games.

Game Date Score Prediction Correct
1 Chiefs vs. Force Apr 24 35 – 27 15.50 TRUE
2 Brumbies vs. Highlanders Apr 24 31 – 18 6.70 TRUE
3 Crusaders vs. Blues Apr 25 29 – 15 11.70 TRUE
4 Waratahs vs. Rebels Apr 25 18 – 16 17.50 TRUE
5 Lions vs. Cheetahs Apr 25 34 – 29 7.50 TRUE
6 Stormers vs. Bulls Apr 25 15 – 13 4.20 TRUE
7 Reds vs. Hurricanes Apr 26 19 – 35 -8.80 TRUE


Predictions for Round 12

Here are the predictions for Round 12. The prediction is my estimated expected points difference with a positive margin being a win to the home team, and a negative margin a win to the away team.

Game Date Winner Prediction
1 Highlanders vs. Sharks May 01 Highlanders 5.60
2 Brumbies vs. Waratahs May 01 Brumbies 1.10
3 Blues vs. Force May 02 Blues 9.70
4 Hurricanes vs. Crusaders May 02 Hurricanes 1.60
5 Rebels vs. Chiefs May 02 Chiefs -5.30
6 Cheetahs vs. Stormers May 02 Stormers -5.90
7 Bulls vs. Lions May 02 Bulls 11.00


April 27, 2015

Stat of the Week Competition: April 25 – May 1 2015

Each week, we would like to invite readers of Stats Chat to submit nominations for our Stat of the Week competition and be in with the chance to win an iTunes voucher.

Here’s how it works:

  • Anyone may add a comment on this post to nominate their Stat of the Week candidate before midday Friday May 1 2015.
  • Statistics can be bad, exemplary or fascinating.
  • The statistic must be in the NZ media during the period of April 25 – May 1 2015 inclusive.
  • Quote the statistic, when and where it was published and tell us why it should be our Stat of the Week.

Next Monday at midday we’ll announce the winner of this week’s Stat of the Week competition, and start a new one.

(more…)