May 23, 2014

Is Roy Morgan weird?

There seems to be a view that the Roy Morgan political opinion poll is more variable than the others, even to the extent that newspapers are willing to say so, eg, Stuff on May 7

The National Party has taken a big hit in the latest Roy Morgan poll, shedding 6 points to 42.5 per cent in the volatile survey.

I was asked about this on Twitter this morning, so I went to get Peter Green’s data and aggregation model to see what it showed. In fact, there’s not much difference between the major polling companies in the variability of their estimates. Here, for example, are poll-to-poll changes in the support for National in successive polls for four companies
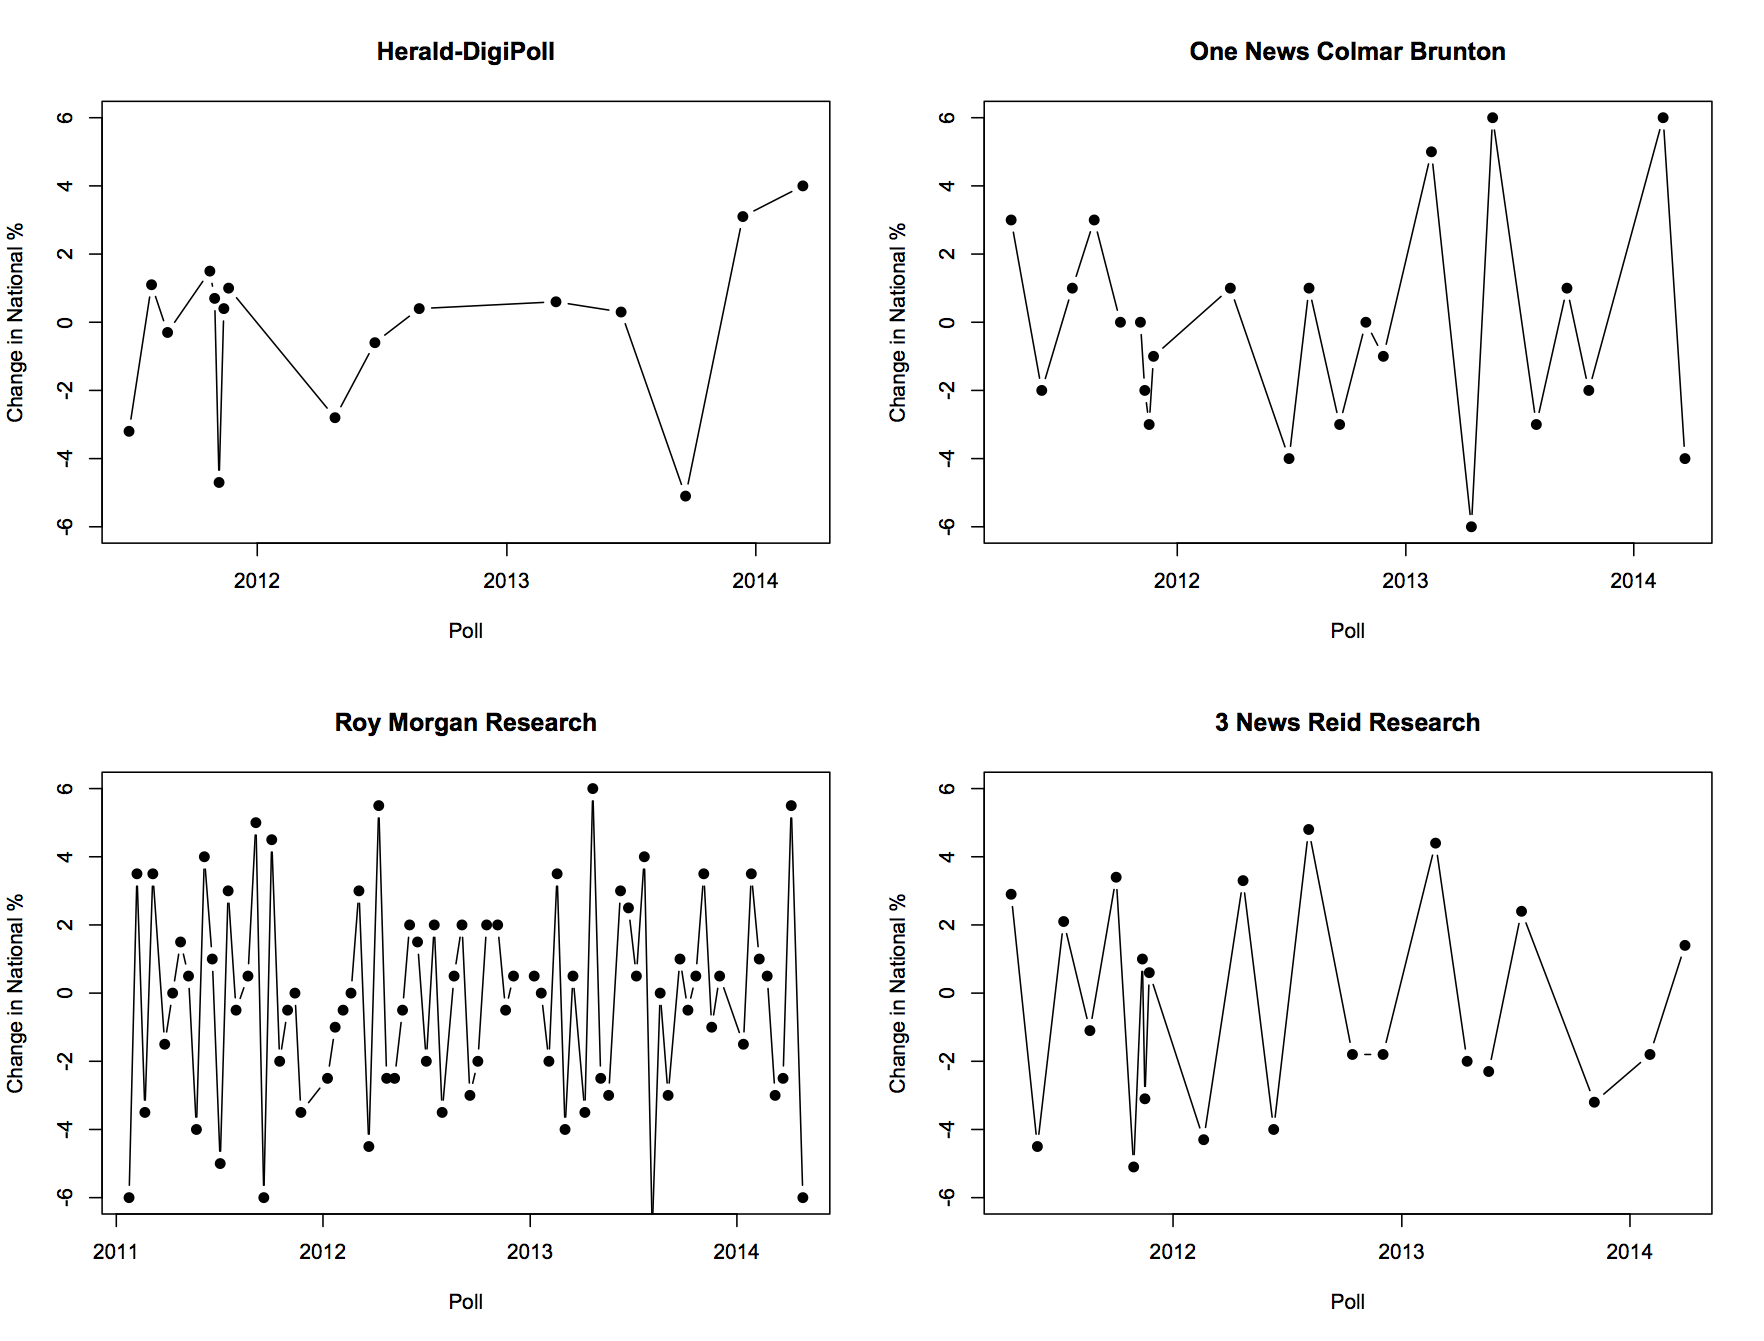
fourpollers


And here are their departures from the aggregated smooth trend
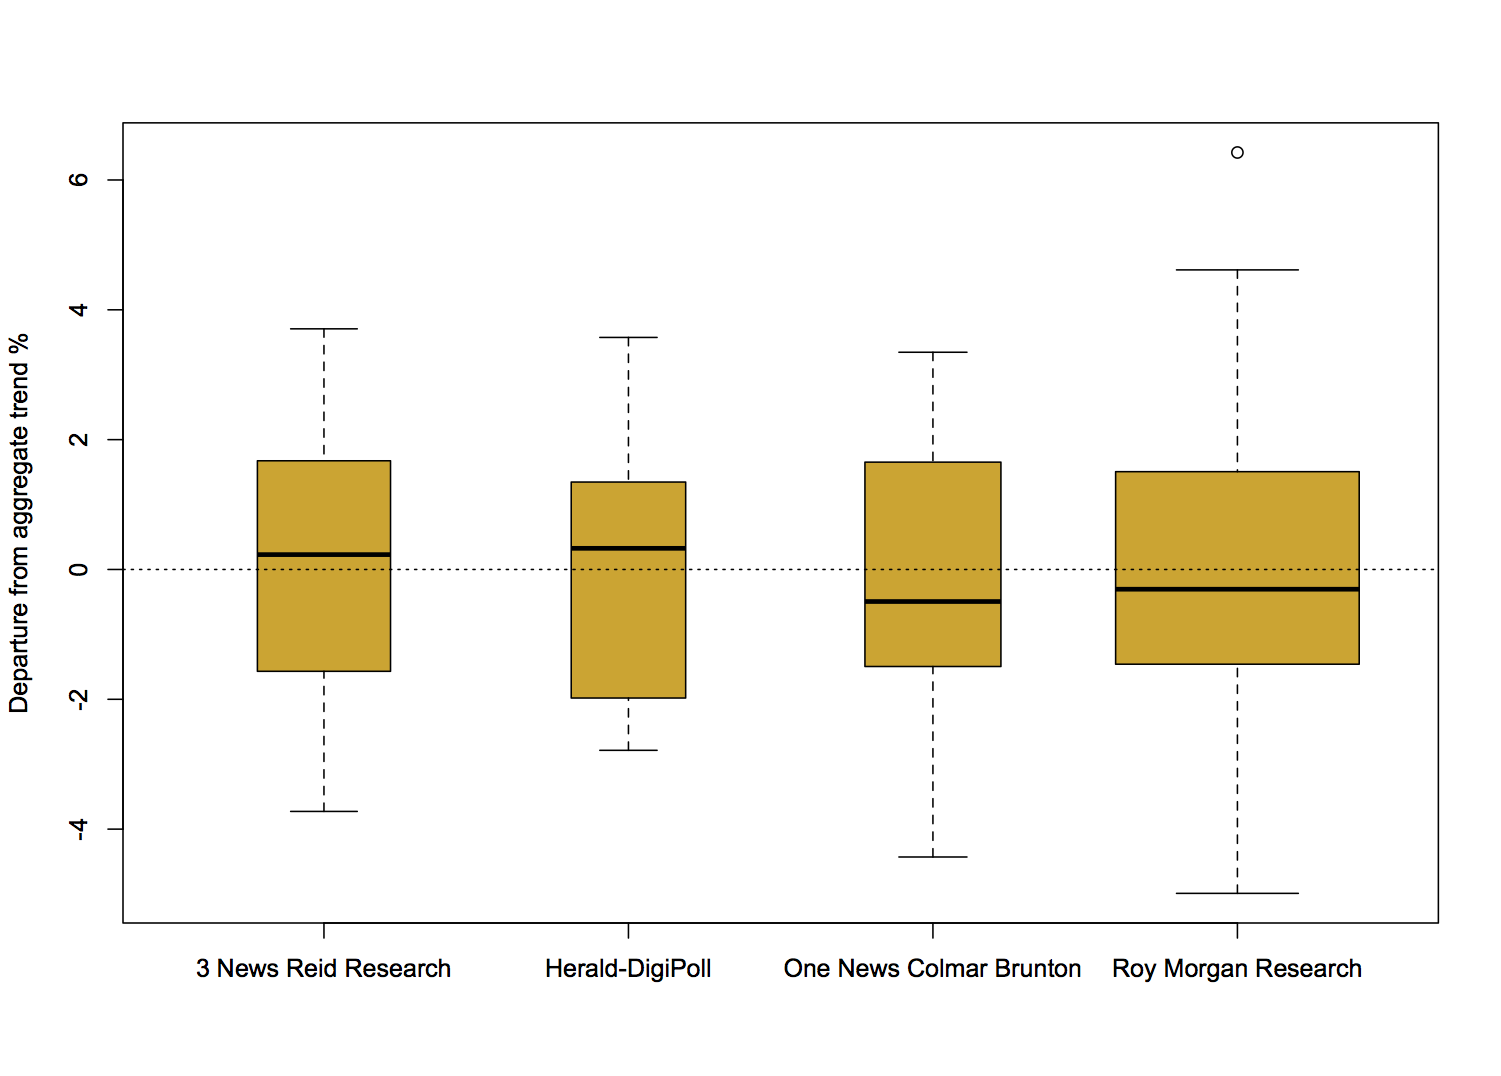
boxpollers


There really is not much to see here. So why do people feel that Roy Morgan comes out with strange results more often? Probably because Roy Morgan comes out with results more often.

For example, the proportion of poll-to-poll changes over 3 percentage points is 0.22 for One News/Colmar Brunton, 0.18 for Roy Morgan, and 0.23 for 3 News/Reid Research, all about the same, but the number of changes over 3 percentage points in this time frame is 5 for One News/Colmar Brunton, 14 for Roy Morgan, and 5 for 3 News/Reid Research.

There are more strange results from Roy Morgan than for the others, but it’s mostly for the same reason that there are more burglaries in Auckland than in the other New Zealand cities.
Distrust the center

Automated location information can be very useful, but if the ‘location’ is an area and the automated result is a single point, it’s easy to get misled.

May 22, 2014

Big Data social context

From Cathy O’Neil: Ignore data, focus on power (and, well, most of the stuff on her blog)

From danah boyd and Kate Crawford: Critical Questions for Big Data

Will large-scale search data help us create better tools, services, and public goods? Or will it usher in a new wave of privacy incursions and invasive marketing? Will data ana- lytics help us understand online communities and political movements? Or will it be used to track protesters and suppress speech? Will it transform how we study human communication and culture, or narrow the palette of research options and alter what ‘research’ means?  


A simple colour example

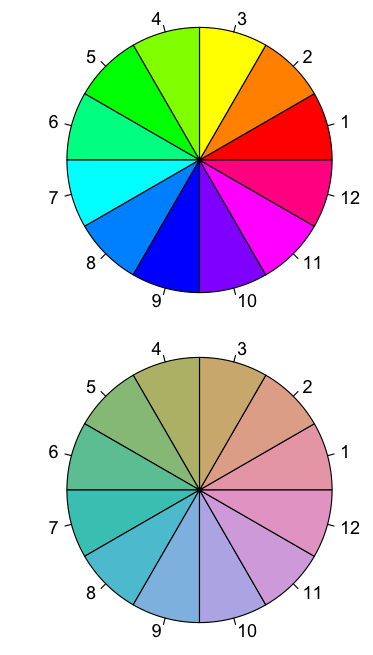
Two colour wheels, one using red-green-blue colour coordinates based on how monitors work, the other using a rescaled coordinate system based approximately on what the eye sees

angle


The second set of colours isn’t as dramatic, but they are much better at being evenly spaced around the circle and equally bright.

Briefly

Health and evidence edition

  • Evidently Cochrane, a blog with non-technical explanations of Cochrane Collaboration review results
  • Design process for a graphic illustrating the impact of motorbike helmet laws.  In contrast to bicycle helmet laws, laws for motorbikes do have a visible effect on death statistics
  • Stuff has quite a good story on alcohol in New Zealand.
  • The British Association of Dermatologists responds to ‘drinkable sunscreen’.
  • 3News piece on Auckland research into extracts of the lingzhi mushroom. Nice to see local science, and the story was reasonably balanced, with Shaun Holt pointing out that this is not even approaching being anywhere near evidence that drinking the stuff would do more good than harm.
May 21, 2014

Super 15 Predictions for Round 15

Team Ratings for Round 15

The basic method is described on my Department home page. I have made some changes to the methodology this year, including shrinking the ratings between seasons.

Here are the team ratings prior to this week’s games, along with the ratings at the start of the season.

Current Rating Rating at Season Start Difference
Crusaders 8.51 8.80 -0.30
Sharks 6.00 4.57 1.40
Chiefs 4.59 4.38 0.20
Waratahs 3.95 1.67 2.30
Brumbies 3.75 4.12 -0.40
Bulls 2.70 4.87 -2.20
Hurricanes 1.56 -1.44 3.00
Stormers -0.21 4.38 -4.60
Blues -0.45 -1.92 1.50
Highlanders -1.66 -4.48 2.80
Force -2.40 -5.37 3.00
Cheetahs -2.93 0.12 -3.10
Reds -4.54 0.58 -5.10
Rebels -4.80 -6.36 1.60
Lions -7.07 -6.93 -0.10


Performance So Far

So far there have been 87 matches played, 56 of which were correctly predicted, a success rate of 64.4%.

Here are the predictions for last week’s games.

Game Date Score Prediction Correct
1 Hurricanes vs. Highlanders May 16 16 – 18 6.90 FALSE
2 Crusaders vs. Sharks May 17 25 – 30 8.10 FALSE
3 Reds vs. Rebels May 17 27 – 30 3.60 FALSE
4 Stormers vs. Force May 17 24 – 8 4.80 TRUE
5 Cheetahs vs. Brumbies May 17 27 – 21 -3.90 FALSE
6 Waratahs vs. Lions May 18 41 – 13 13.20 TRUE


Predictions for Round 15

Here are the predictions for Round 15. The prediction is my estimated expected points difference with a positive margin being a win to the home team, and a negative margin a win to the away team.

Game Date Winner Prediction
1 Blues vs. Sharks May 23 Sharks -2.50
2 Rebels vs. Waratahs May 23 Waratahs -6.30
3 Highlanders vs. Crusaders May 24 Crusaders -7.70
4 Hurricanes vs. Chiefs May 24 Chiefs -0.50
5 Force vs. Lions May 24 Force 8.70
6 Stormers vs. Cheetahs May 24 Stormers 5.20
7 Bulls vs. Brumbies May 24 Bulls 2.90


NRL Predictions for Round 11

Team Ratings for Round 11

The basic method is described on my Department home page. I have made some changes to the methodology this year, including shrinking the ratings between seasons.

Here are the team ratings prior to this week’s games, along with the ratings at the start of the season.

Current Rating Rating at Season Start Difference
Cowboys 7.44 6.01 1.40
Bulldogs 7.32 2.46 4.90
Roosters 6.54 12.35 -5.80
Rabbitohs 5.83 5.82 0.00
Sea Eagles 5.77 9.10 -3.30
Storm 2.90 7.64 -4.70
Broncos 1.24 -4.69 5.90
Warriors 0.28 -0.72 1.00
Panthers -0.09 -2.48 2.40
Knights -0.77 5.23 -6.00
Titans -1.13 1.45 -2.60
Wests Tigers -5.15 -11.26 6.10
Sharks -5.47 2.32 -7.80
Eels -5.91 -18.45 12.50
Raiders -9.79 -8.99 -0.80
Dragons -10.80 -7.57 -3.20


Performance So Far

So far there have been 80 matches played, 44 of which were correctly predicted, a success rate of 55%.

Here are the predictions for last week’s games.

Game Date Score Prediction Correct
1 Rabbitohs vs. Storm May 16 14 – 27 11.70 FALSE
2 Broncos vs. Titans May 16 22 – 8 5.20 TRUE
3 Eels vs. Dragons May 17 36 – 0 4.00 TRUE
4 Sharks vs. Wests Tigers May 17 20 – 22 5.70 FALSE
5 Cowboys vs. Roosters May 17 42 – 10 -0.00 FALSE
6 Raiders vs. Panthers May 18 20 – 26 -4.90 TRUE
7 Bulldogs vs. Warriors May 18 16 – 12 13.30 TRUE
8 Sea Eagles vs. Knights May 19 15 – 14 13.40 TRUE


Predictions for Round 11

Here are the predictions for Round 11. The prediction is my estimated expected points difference with a positive margin being a win to the home team, and a negative margin a win to the away team.

Game Date Winner Prediction
1 Bulldogs vs. Roosters May 23 Bulldogs 5.30
2 Titans vs. Warriors May 24 Titans 3.10
3 Wests Tigers vs. Broncos May 24 Broncos -1.90
4 Raiders vs. Cowboys May 25 Cowboys -12.70
5 Sharks vs. Rabbitohs May 26 Rabbitohs -6.80


Explaining income tax shares

Following up on the “net tax” tangle, Keith Ng has a step by step explanation of how income tax and income distribution has changed over recent years in NZ.

You can also play with the visualisation yourself. Or, if you want to see the arguments about it, they’ll be on his Public Address post.

When not to map

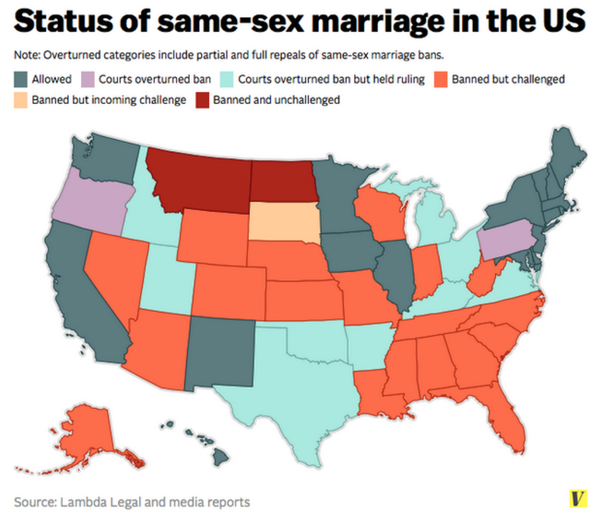
Maps are good because they take advantage of all the previous maps we’ve seen to provide background familiarity.  On the other hand, they use up both the available spatial dimensions before you’ve actually got any data, so you need to encode the information some other way. Colour is the obvious choice, but colour is much more limited than people appreciate.

Kieran Healy tweeted “It’s not like there’s a simple, tradeoff-free solution, but this is not a good map.”

BoH2_TfIMAACQIl


And he’s right; it isn’t. There are too many categories, and some of them are ordered but not all of them, so colour isn’t enough. Even if you’re going to try, these aren’t the right colours: for example, orange should be between yellow and red.  About the most you could do clearly with a single map is the three-way split: Yes, same-sex couples can just roll up to the registry;  No, not this week; or It’s Complicated.

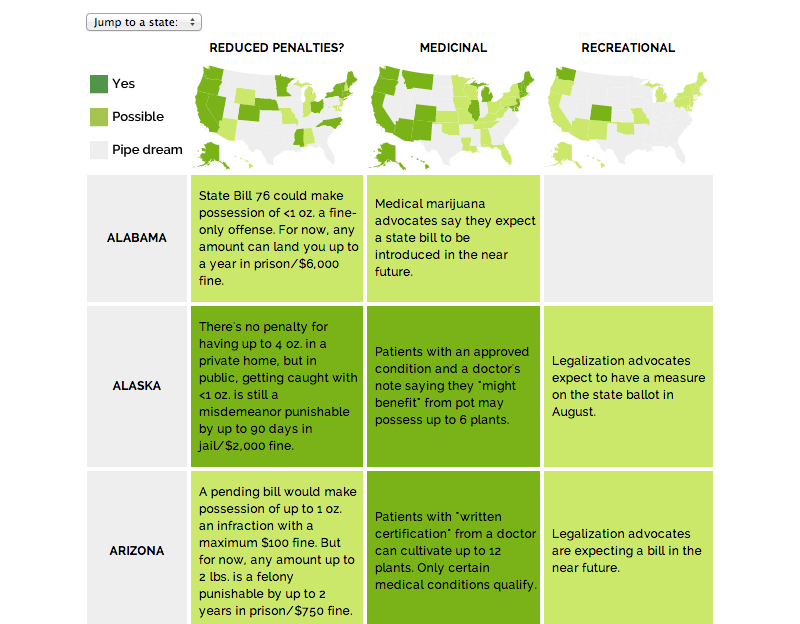
Jacob Harris pointed to an article at Source, describing the design of graphics for a story about marijuana legalisation. It does much better


raja_final_product_1


They link to the classic piece “When maps shouldn’t be maps” by Matthew Ericson, which I’ve linked before. They also have a whole collection of articles on better maps, though it’s fairly programming-oriented.

Sea rise visualisation

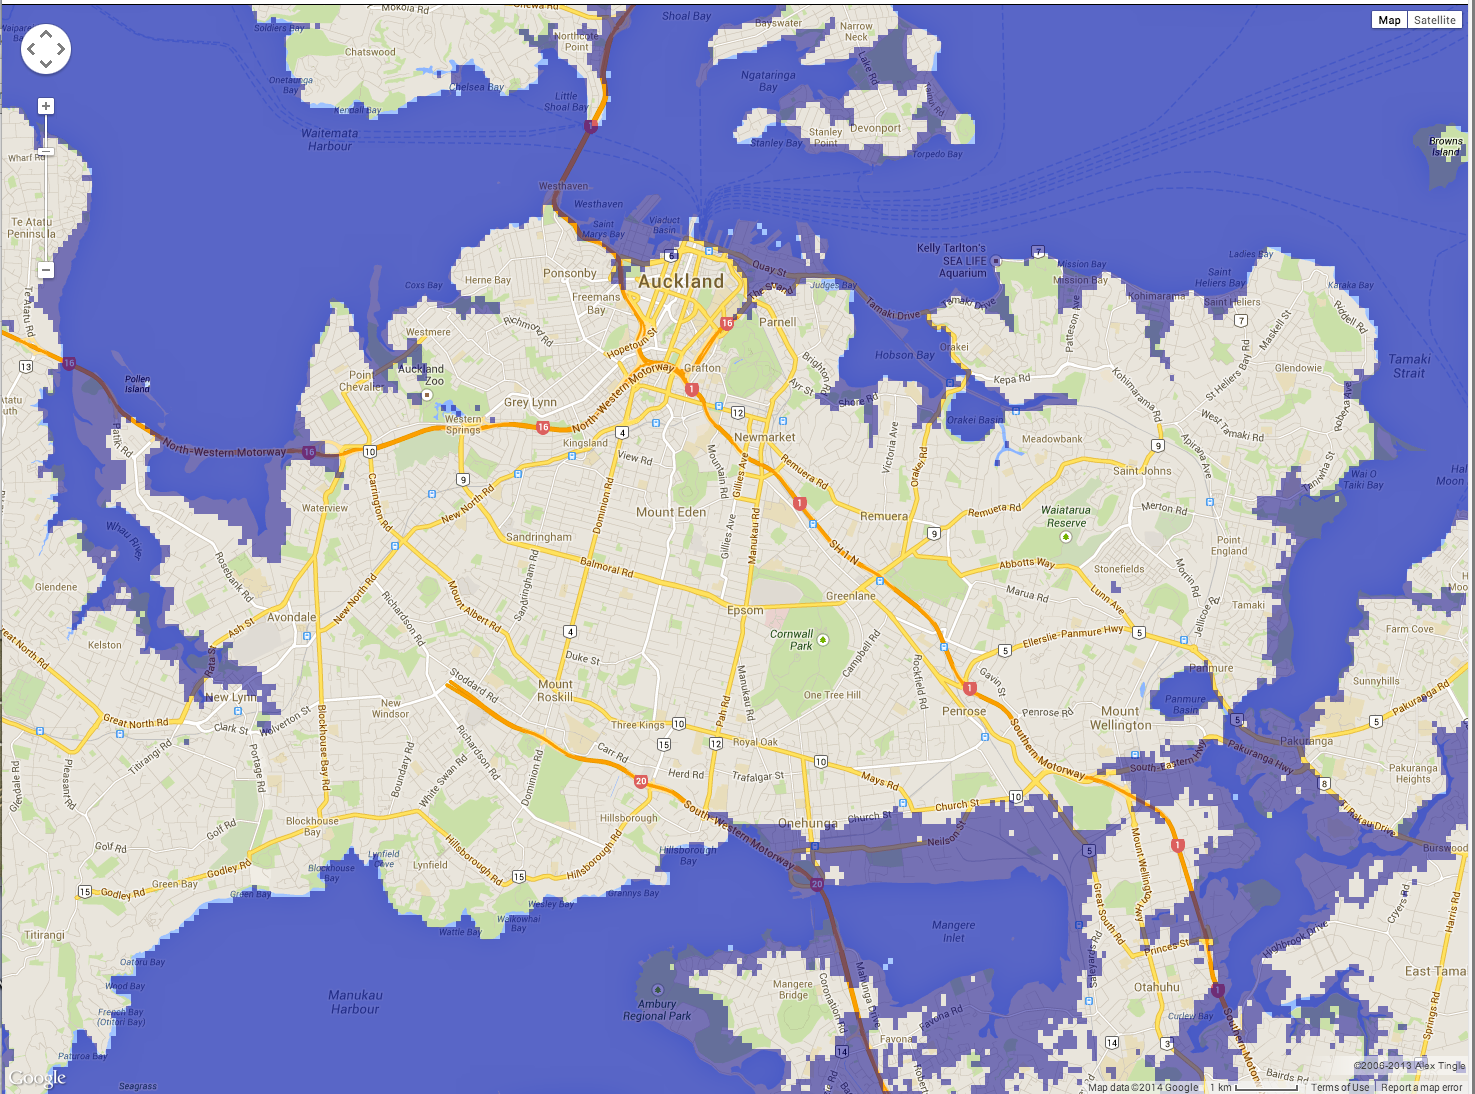
A new map to let you see the impact of rises in sea levels on your area: this is Auckland with 13m sea rise

flood


This doesn’t show the impact of storm surges, which are the big problem for a lot of eastern coastal Auckland (though not so much for Manukau Harbour).

(via everyone on twitter)