July 6, 2013
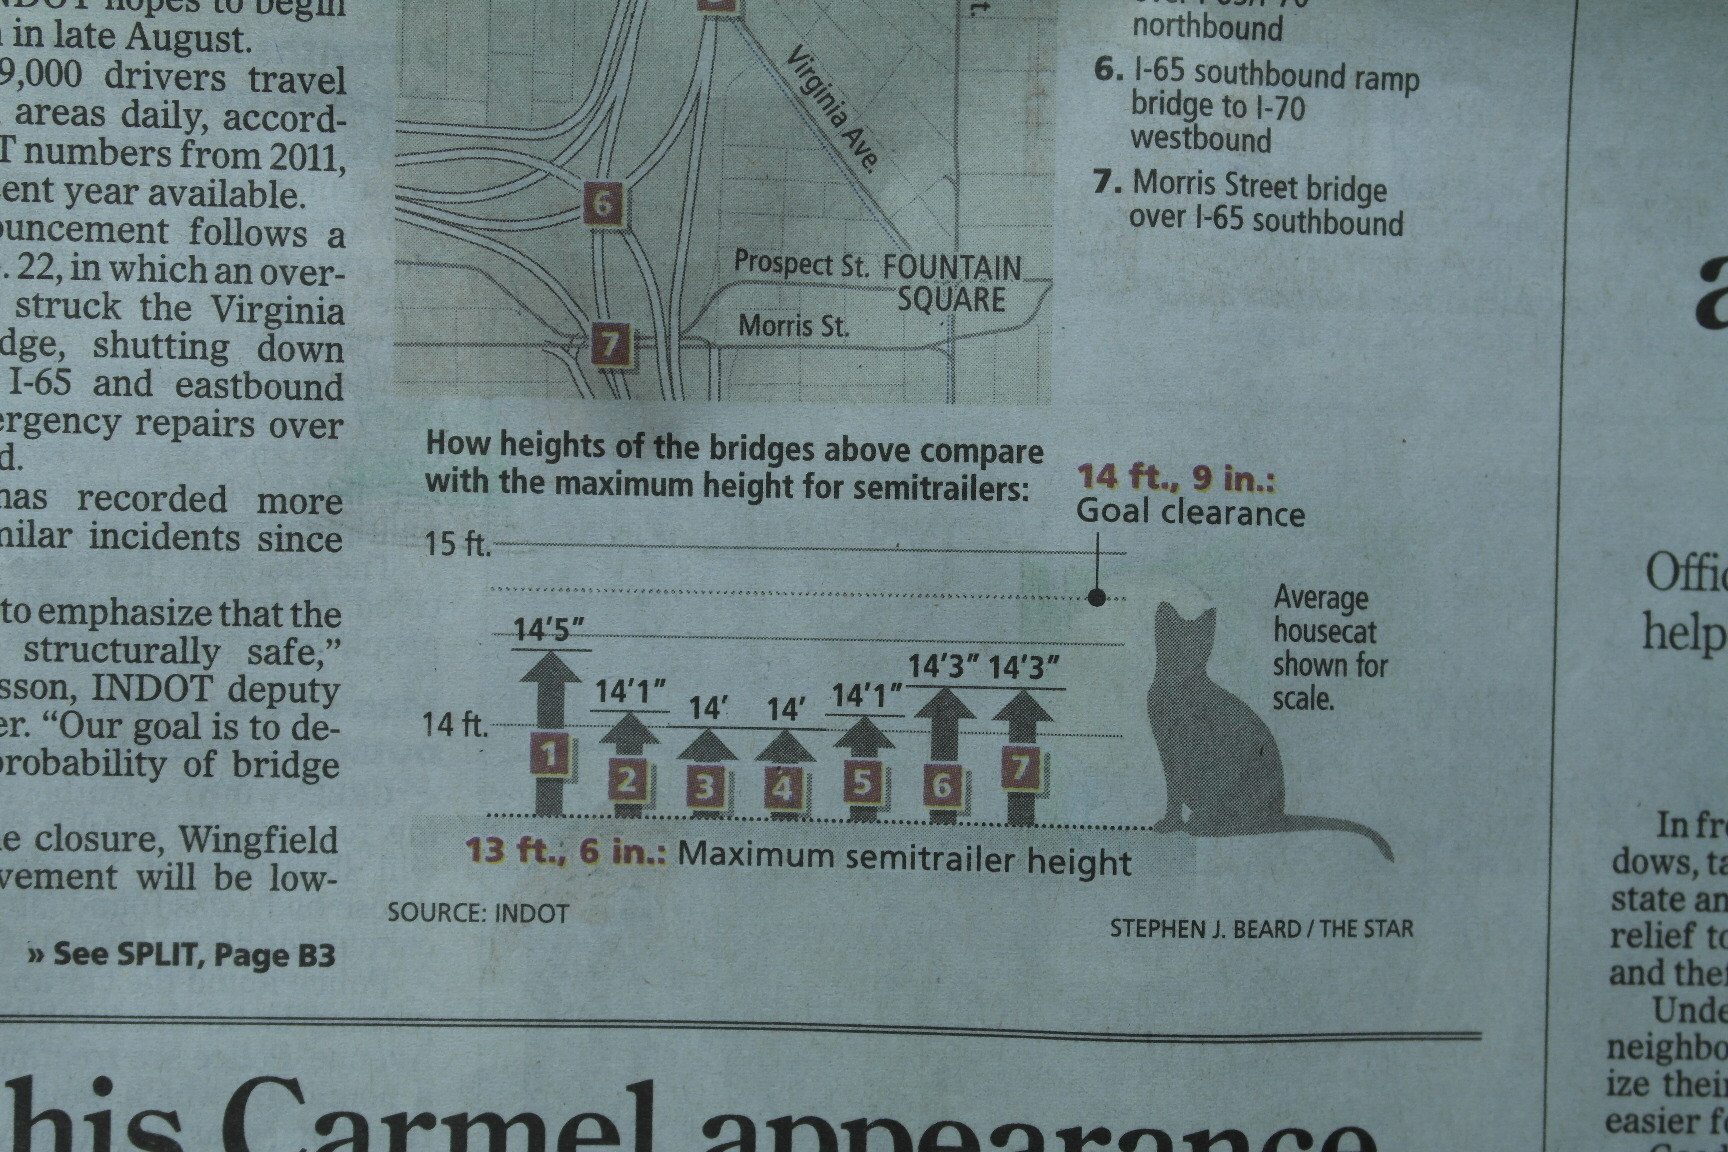
Average housecat shown for scale
Via Edward Tufte on Twitter, from an Indiana newspaper
Via Edward Tufte on Twitter, from an Indiana newspaper
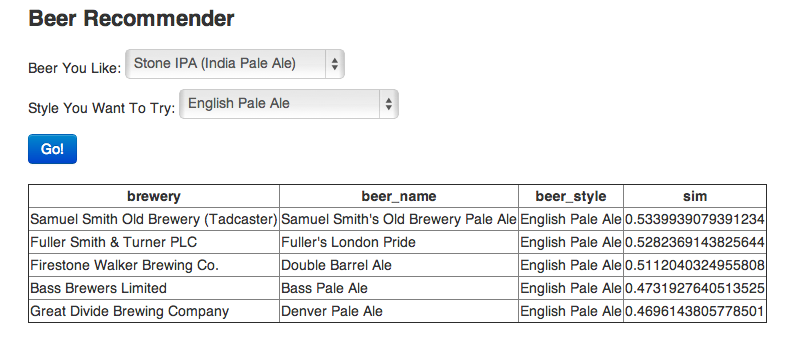
It’s nearly that time of the week, so here’s a post describing a simple beer recommendation system using 1.5 million ratings from BeerAdvocate.com and analysis in R
I don’t need a statistical model to tell me that someone who likes Fat Tire is probably going to like Dale’s Pale Ale more than Michelob Ultra. But what about picking between Dale’s Pale Ale and Sierra Nevada Pale Ale? Things get a little more complicated. For this reason (and because we don’t want to manually select between each beer pair), we’re going to write a distance function that will quantify similarity.
For our similarity metric we’re going to use a weighted average of the correlation of each metric. In other words, for each two-beer-pair we calculate the corelation of
review_overall,review_aroma,review_palate, andreview_tasteseperately. Then we take a weighted average each result to consolidate them into one number.
The resulting tool lets you put in a specific beer you like and then ask for recommendations in a category, eg,
Some folks at the MIT Media Lab have put together a simple web app that takes your Gmail headers and builds a social network.
Once you log in, Immersion will use only the From, To, Cc and Timestamp fields of the emails in the account you are signing in with. It will not access the subject or the body content of any of your emails.
Here’s mine, from my University of Washington email (with the names blurred, not that communicating with me is all that incriminating)
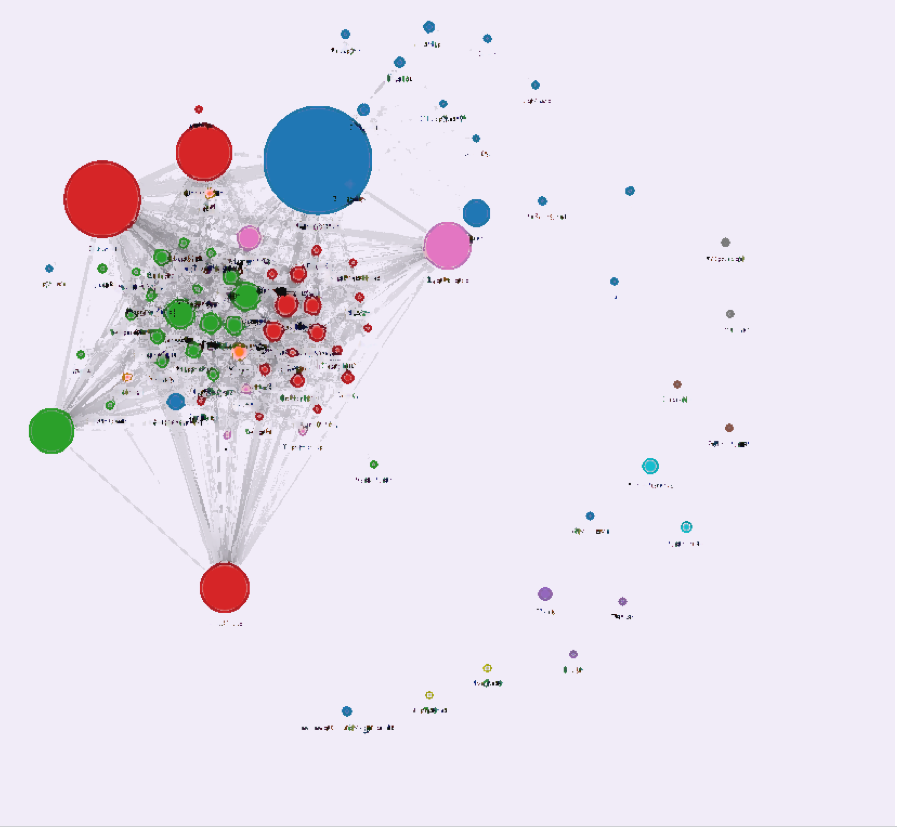
Obviously my email headers reveal who I email, and, unsurprisingly, the little outlying clusters are small groups or individuals involved in specific projects. More interesting is how the main clump breaks down: the blue and pink circles are statisticians, the red are epidemiology and genomics people that I have worked with in person in Seattle, and the green are epidemiology and genomics people that I work with only via email.
On Stuff’s front page there’s a headline “Life expectancies heading down.” Clicking through gives “Kiwi kids destined for shorter lives than parents”.
Here’s the New Zealand life expectancy over time, from StatsNZ, first by gender, then (for a shorter time period) by gender and Maori/non-Maori ethnicity
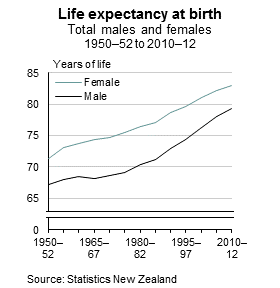
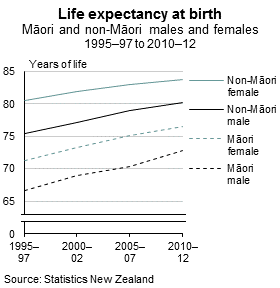
Life expectancy has been increasing for a long time, and over the past 25 years (a reasonable definition of a generation) there has been an increase of about eight years.
The story is saying that this increase may soon start to slow down and reverse. That’s possible, and even plausible, but it hasn’t started to happen yet, and it would take a lot for life expectancy curves to not just flatten but to decrease fast enough to give an eight-year reduction, so that kids born today have a shorter life expectancy than their parents’ generation.
An interestesting video from the Geography department at the University of Minnesota. The cellist, Minnesota student Daniel Crawford, plays the historical earth mean temperature record converted to music
One difficulty with sonic display of data is scaling: the video uses a semitone for 0.03 Celsius, but that seems like quite a big pitch change for a barely-measurable temperature difference. The scaling gives a range of three octaves (rather more than a typical singers voice) for just over 1 degree, which is a meaningful but not catastrophic change in temperature. I think it’s fair to say the pitch scaling is a bit exaggerated.
It’s hard to say what would be appropriate, since we don’t have the research and practical experience that informs axis choices for graphs. One approach might be to take advantage of vibrato in cello performance, and scale so that the minimum measurement uncertainty is the same as the vibrato variation. The Google suggests that cello vibrato is about 1/5 to 1/4 semitone, and mapping this to a minimum confidence interval width (from the Berkeley data) of 0.04C gives a scaling of 0.16 to 0.2 degrees per semitone, or a total range for the whole piece of about half an octave.
From itnews
A mobility programme using Apple iPhones and iPads has changed the way New Zealand Police officers work, and the force is partly attributing a sharp drop in crime to the rollout of the devices.
According to figures published by NZ Police, using the devices within the Policing Excellence programme [PDF] has contributed to a 13 per cent reduction in crime for the year to May 31.
The Police press release is here, and you can see that they are the source of the claims. But if you look at the linked PDF, the 13% reduction is based on comparing (partly provisional) data for June 2012-May 2013 and June 2008-May 2009. Crime has been decreasing steadily over this time: here’s the graph for 1995-2012 from NZ police (PDF, p16)
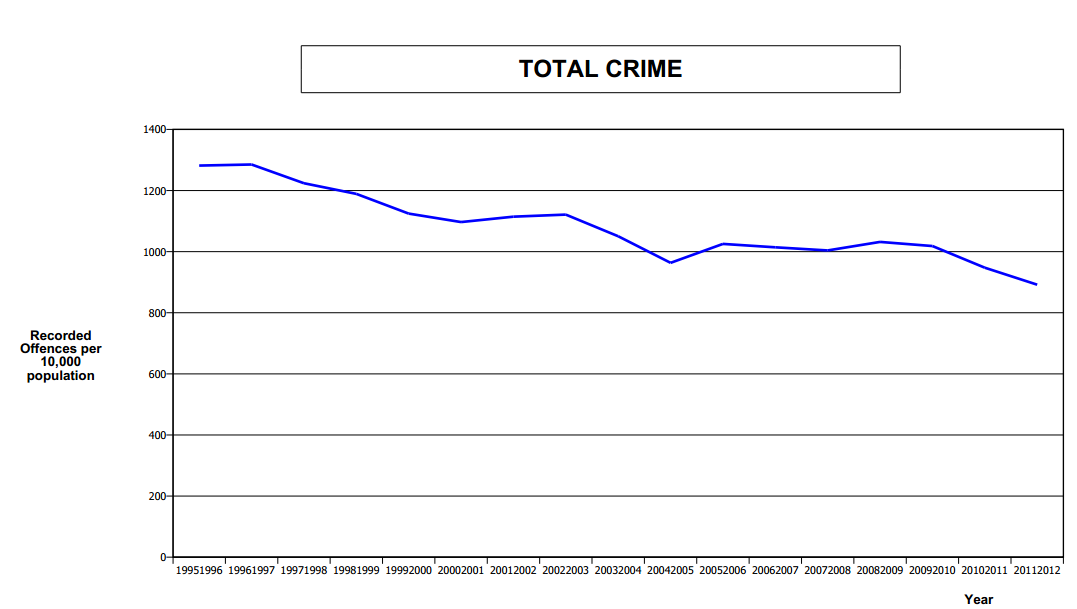
The decrease from fiscal year 2008/9 to fiscal year 2011/12 (before the iPads) is from 1031.9 per 10,000 population to 891.9 per 10,000 population, or just over 14% — slightly larger than the decrease claimed when the iPad revolution is included.
It’s not surprising that the new mobility initiative isn’t showing up clearly in crime figures yet — the devices are still being rolled out. In fact the NZ Police report is talking about their whole modernisation initiative (started in August 2010) , though it’s still not possible to say how much of the 13% decrease is due to the changes, and the overall downward trend in crime would be sufficient to explain the entire decrease.
I’ve commented on several occasions that it would be great if science journalism was as good as sports journalism. Here’s a more-detailed quote from Noam Chomsky on the same issue
When I’m driving, I sometimes turn on the radio and I find very often that what I’m listening to is a discussion of sports. These are telephone conversations. People call in and have long and intricate discussions, and it’s plain that quite a high degree of thought and analysis is going into that. People know a tremendous amount. They know all sorts of complicated details and enter into far-reaching discussion about whether the coach made the right decision yesterday and so on. These are ordinary people, not professionals, who are applying their intelligence and analytic skills in these areas and accumulating quite a lot of knowledge and, for all I know, understanding. On the other hand, when I hear people talk about, say, international affairs or domestic problems, it’s at a level of superficiality that’s beyond belief.
(via Chad Orzel, who thinks there’s a snappier version of this out there, but can’t find it)
Here are the team ratings prior to Round 17, along with the ratings at the start of the season. I have created a brief description of the method I use for predicting rugby games. Go to my Department home page to see this.
| Current Rating | Rating at Season Start | Difference | |
|---|---|---|---|
| Rabbitohs | 10.67 | 5.23 | 5.40 |
| Storm | 4.45 | 9.73 | -5.30 |
| Roosters | 4.05 | -5.68 | 9.70 |
| Knights | 4.01 | 0.44 | 3.60 |
| Sea Eagles | 3.66 | 4.78 | -1.10 |
| Bulldogs | 1.92 | 7.33 | -5.40 |
| Cowboys | 0.57 | 7.05 | -6.50 |
| Panthers | 0.47 | -6.58 | 7.00 |
| Titans | -0.72 | -1.85 | 1.10 |
| Raiders | -0.74 | 2.03 | -2.80 |
| Warriors | -1.93 | -10.01 | 8.10 |
| Sharks | -2.58 | -1.78 | -0.80 |
| Dragons | -3.52 | -0.33 | -3.20 |
| Broncos | -3.59 | -1.55 | -2.00 |
| Wests Tigers | -6.05 | -3.71 | -2.30 |
| Eels | -14.42 | -8.82 | -5.60 |
So far there have been 118 matches played, 72 of which were correctly predicted, a success rate of 61.02%.
Here are the predictions for last week’s games.
| Game | Date | Score | Prediction | Correct | |
|---|---|---|---|---|---|
| 1 | Rabbitohs vs. Raiders | Jun 28 | 32 – 2 | 12.39 | TRUE |
| 2 | Wests Tigers vs. Storm | Jun 29 | 22 – 4 | -11.99 | FALSE |
| 3 | Panthers vs. Dragons | Jun 29 | 25 – 10 | 6.85 | TRUE |
| 4 | Knights vs. Titans | Jun 30 | 46 – 16 | 4.04 | TRUE |
| 5 | Warriors vs. Broncos | Jun 30 | 18 – 16 | 7.21 | TRUE |
| 6 | Cowboys vs. Sharks | Jun 30 | 24 – 4 | 4.56 | TRUE |
| 7 | Roosters vs. Sea Eagles | Jul 01 | 18 – 12 | 4.61 | TRUE |
Here are the predictions for Round 17. The prediction is my estimated expected points difference with a positive margin being a win to the home team, and a negative margin a win to the away team.
| Game | Date | Winner | Prediction | |
|---|---|---|---|---|
| 1 | Storm vs. Broncos | Jul 05 | Storm | 12.50 |
| 2 | Sharks vs. Wests Tigers | Jul 05 | Sharks | 8.00 |
| 3 | Dragons vs. Roosters | Jul 06 | Roosters | -3.10 |
| 4 | Titans vs. Panthers | Jul 06 | Titans | 3.30 |
| 5 | Raiders vs. Cowboys | Jul 07 | Raiders | 3.20 |
| 6 | Bulldogs vs. Knights | Jul 07 | Bulldogs | 2.40 |
| 7 | Rabbitohs vs. Warriors | Jul 07 | Rabbitohs | 17.10 |
| 8 | Sea Eagles vs. Eels | Jul 08 | Sea Eagles | 22.60 |
This year the predictions have been slightly changed with the help of a student, Joshua Dale. The home ground advantage now is different when both teams are from the same country to when the teams are from different countries. The basic method is described on my Department home page.
Here are the team ratings prior to Round 19, along with the ratings at the start of the season.
| Current Rating | Rating at Season Start | Difference | |
|---|---|---|---|
| Crusaders | 7.56 | 9.03 | -1.50 |
| Bulls | 6.64 | 2.55 | 4.10 |
| Chiefs | 4.90 | 6.98 | -2.10 |
| Brumbies | 4.18 | -1.06 | 5.20 |
| Stormers | 2.69 | 3.34 | -0.60 |
| Sharks | 1.79 | 4.57 | -2.80 |
| Waratahs | 1.62 | -4.10 | 5.70 |
| Reds | 0.17 | 0.46 | -0.30 |
| Blues | -1.15 | -3.02 | 1.90 |
| Hurricanes | -1.82 | 4.40 | -6.20 |
| Cheetahs | -3.21 | -4.16 | 0.90 |
| Highlanders | -6.88 | -3.41 | -3.50 |
| Rebels | -8.64 | -10.64 | 2.00 |
| Force | -9.03 | -9.73 | 0.70 |
| Kings | -13.62 | -10.00 | -3.60 |
So far there have been 108 matches played, 75 of which were correctly predicted, a success rate of 69.4%.
Here are the predictions for last week’s games.
| Game | Date | Score | Prediction | Correct | |
|---|---|---|---|---|---|
| 1 | Chiefs vs. Hurricanes | Jun 28 | 34 – 22 | 8.70 | TRUE |
| 2 | Highlanders vs. Crusaders | Jun 29 | 12 – 40 | -8.90 | TRUE |
| 3 | Sharks vs. Blues | Jun 29 | 22 – 20 | 7.90 | TRUE |
| 4 | Bulls vs. Kings | Jun 29 | 48 – 18 | 21.40 | TRUE |
| 5 | Stormers vs. Cheetahs | Jun 29 | 28 – 3 | 5.20 | TRUE |
Here are the predictions for Round 19. The prediction is my estimated expected points difference with a positive margin being a win to the home team, and a negative margin a win to the away team.
| Game | Date | Winner | Prediction | |
|---|---|---|---|---|
| 1 | Crusaders vs. Chiefs | Jul 05 | Crusaders | 5.20 |
| 2 | Hurricanes vs. Highlanders | Jul 06 | Hurricanes | 7.60 |
| 3 | Cheetahs vs. Blues | Jul 06 | Cheetahs | 1.90 |
| 4 | Kings vs. Stormers | Jul 06 | Stormers | -13.80 |
| 5 | Bulls vs. Sharks | Jul 06 | Bulls | 7.40 |
Recent comments