November 12, 2012

The rise of the machines

The Herald has an interesting story on the improvements in prediction displayed last week: predicting the US election results , but more importantly, predicting the path of Hurricane Sandy.  They say

In just two weeks, computer models have displayed an impressive prediction prowess.

 The math experts came out on top thanks to better and more accessible data and rapidly increasing computer power.

It’s true that increasing computer power has been important in both these examples, but it’s been important in two quite different ways.  Weather prediction, use the most powerful computers that the metereologists can afford, and they are still nowhere near the point of diminishing returns.  There aren’t many problems like this.

Election forecasting, on the other hand, uses simple models that could even be run on hand calculators, if you were sufficiently obsessive and knowledgeable about computational statistics and numerical approximations.  The importance of increases in computer power is that anyone in the developed world has access to computing resources that make the actual calculations trivial.  Ubiquitous computing, rather than supercomputers, are what has revolutionised statistics.  If you combine the cheapest second-hand computer you can find with free software downloaded from the Internet, you have the sort of modelling resources that the top academic and industry research groups were just starting to get twenty years ago.

Cheap computing means that we can tackle problems that wouldn’t have been worthwhile before.  For example, in a post about the lottery, I wanted to calculate the probability that distributing 104 wins over 12 months would give 15 or more wins in one of the months.  I could probably work this out analytically, at least to a reasonable approximation, but it would be too slow and too boring to do for a blog post.  In less than a minute I could write code to estimate the probabilities by simulation, and run 10,000 samples.  If more accuracy was needed I could easily extend this to millions of samples.  That particular calculation doesn’t really matter to anyone, but the same principles apply to real research problems.
Stat of the Week Competition: November 10 – 16 2012

Each week, we would like to invite readers of Stats Chat to submit nominations for our Stat of the Week competition and be in with the chance to win an iTunes voucher.

Here’s how it works:

  • Anyone may add a comment on this post to nominate their Stat of the Week candidate before midday Friday November 16 2012.
  • Statistics can be bad, exemplary or fascinating.
  • The statistic must be in the NZ media during the period of November 10 – 16 2012 inclusive.
  • Quote the statistic, when and where it was published and tell us why it should be our Stat of the Week.

Next Monday at midday we’ll announce the winner of this week’s Stat of the Week competition, and start a new one.

(more…)

November 11, 2012

It’s not the sensation, it’s the neuroscience

Philosophers have argued about whether it’s even conceivable to have pain without the physical sensation. According to 3News (and other media outlets worldwide), University of Chicago neuroscientists don’t have a problem with this:

Mathematics can be difficult, and a new study shows even thinking about doing it can physically hurt.

Of course, that’s not quite what the study found (and credit to 3News for linking), though it does seem to be what the researchers said they found. The study was in people with ‘high levels of math anxiety’ and the abstract says

We show that, when anticipating an upcoming math-task, the higher one’s math anxiety, the more one increases activity in regions associated with visceral threat detection, and often the experience of pain itself (bilateral dorso-posterior insula).

That is, some of the parts of the brain that are active during pain or threat were also active when anticipating a maths task, even though there was no actual pain reported.

A simpler explanation might be that if you’re scared of maths, then your brain looks as if you’re scared of something.  Although the researchers don’t believe this, they do actually concede it is an alternative explanation in the discussion section of the paper

the INSp activity we found could be reflective of something else. For example, it has been suggested that INSp activity is not so much reflective of nocioception, but rather reflects detection of events that are salient for (e.g., threatening to) bodily integrity, regardless of the input sensory modality

(via)

Psychic water bills

I’ve just received a water bill which, among other information, estimates my average daily water use for November.  That’s a pretty good trick for something that must have been mailed in the first few days of the month. They mean October, I assume.

Apart from their off-by-one labelling of months, Watercare are interesting because of their ‘estimated’ water usage.  They recently changed to sending monthly bills, but they still only try to read the meter ever second month, and in my case have failed to find it twice.  My first bill on moving in was for three months, and it was relatively high. I fixed the leaky seal in the toilet and expected the bills to go down.  The following month, the meter wasn’t read but my estimated daily water use went up about 7%.  The next month, again there was no meter reading, and the estimated daily use was another 10% higher. The next month the estimated daily use was down about 8%, again with no reading.

I can see why the estimated total usage would fluctuate based on the varying time between estimates, but it’s hard to see what basis Watercare had for estimating I was using more water in September (actually August) than in August (actually July) without any actual data.  I wouldn’t have expected the average Aucklander to use more water in winter, and a research report from Branz confirms my expectation.

This month, now they have found the meter, the estimated use has fallen about 85%, catching up on three months of overbilling.

Point A to Point B

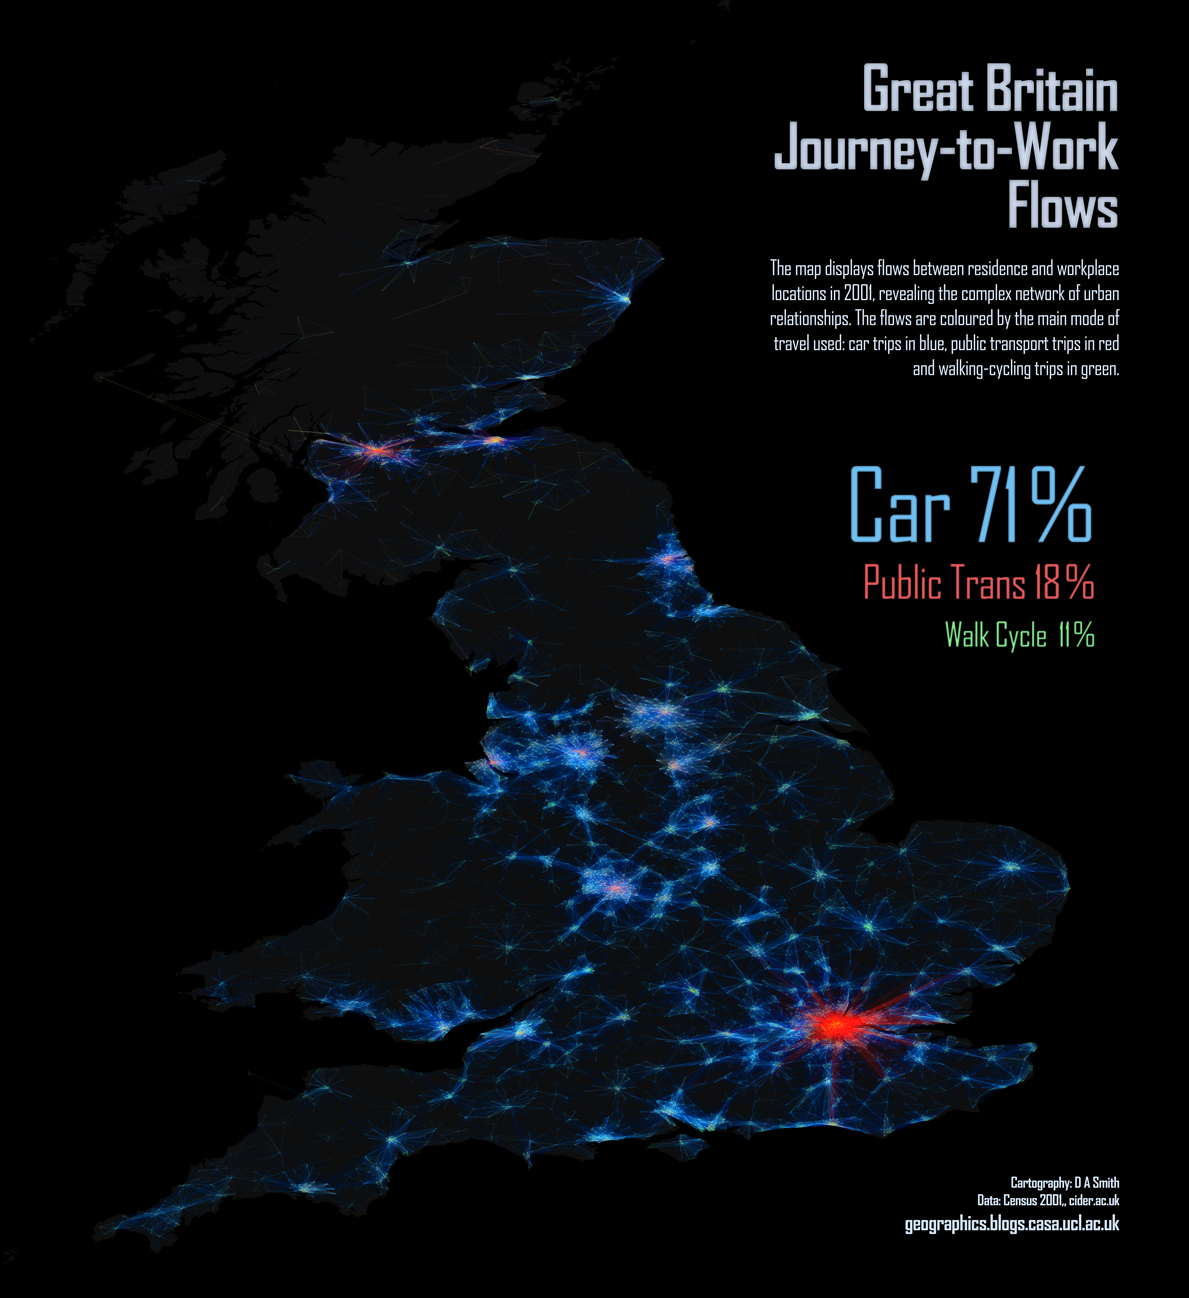
From the Mapping London blog, a picture of commuter flows in Great Britain. The difference in public transport use between London and the other cities is dramatic.  They have lots of other maps, including one of language use in London based on Twitter messages.  That would be interesting to do for NZ cities.

XKCD misfire

The comic XKCD is usually spot-on in statistical commentary, but the most recent attempt doesn’t really work.  There’s a tendency for people who learnt frequentist statistics from bad textbooks and Bayesian statistics from good statisticians to think it’s the philosophy that makes the textbook bad, rather than the textbook that makes the philosophy bad.

I might be considered biased, so I’m outsourcing the details of this complaint to a well-known Bayesian statistician

What do people tweet all day?

We saw the American Time Use Survey earlier this week, but a paper has just been published using a different source of publically-available time use data.

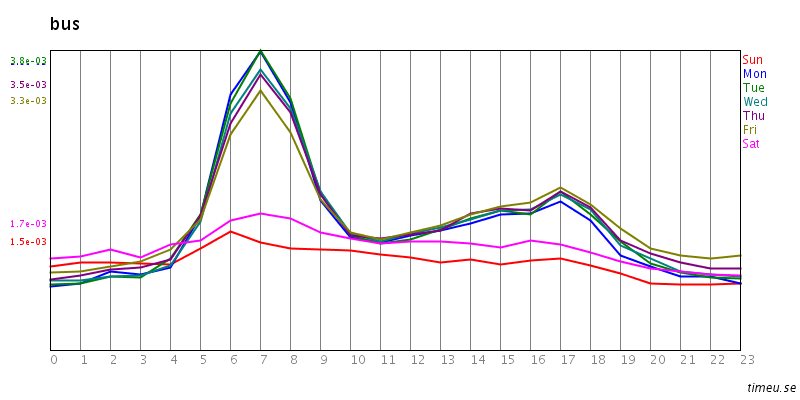
The site timeu.se collects information from Twitter and parses it to extract activities. For example: bus

On weekdays lots of people catch the bus in to work, and then teleport home. Or perhaps commuting home is just less tweet-worthy.

In any case, the data could be useful for picking up strong trends.  The new paper is about migraines, using time-of-day data from the website. The researchers found the expected differences between men and women, and between workdays and weekends/holidays, and the expected early morning peak, suggesting that tweet-mining at least isn’t completely bogus.

Numbers don’t have to make sense?

Stuff is reporting that Vodafone (who sell communications, including specific teleworking products) has done a survey about working from home in NZ.

As usual, we don’t know how the survey participants were recruited, just that they were “476 people of all ages, regions and industries.”  If they really were from all industries, it’s not surprising that many of them didn’t work from home: it’s pretty difficult for a barista, or a hospital nurse, or a factory worker, or a forester.  Anyway, in this case the big problem is that we don’t have the questions, so it’s hard to work out what’s actually going on in the apparently contradictory responses.  For example

  • 61 per cent reported they couldn’t work away from the office because their manager liked to be able to “brief off work” immediately
  • 37 per cent of people felt their managers were not supportive of them working away from the office.

So, by subtraction, at least 24% of people couldn’t work away from the office because of their manager’s working style but still felt that their managers were supportive of them working away from the office?  As the story points out, we also don’t know whether the managers really were opposed to people working from home, or whether the employees just thought they were.

Comparing this survey to last week’s Randstad survey reported in the Herald, we see that the Randstad survey found “67.89 per cent said the option of working from home was either appealing or very appealing.”   (No, I don’t know why the Herald quoted the results to the nearest tenth of a respondent) but the Vodafone poll found “77 per cent of people saying that if they were changing jobs, the ability to work from anywhere would make the job more attractive.” Clearly, sampling error is not the biggest problem in interpreting these surveys.

The last line of the Stuff story is “Meanwhile, 42 per cent of people, who worked away from the office regularly, said they often did overtime.”  As written, this says 42% worked away from the office regularly, which seems to contradict the earlier results and the general tone of the story.  Here I don’t think it’s the survey’s fault. It seems more likely that an editing error added the commas and changed the implied denominator. Grammar can make a difference in statistics, too.

November 9, 2012

Thomas Lumley interviewed on Firstline

Auckland University statistician and the most regular contributor to Stats Chat, Professor Thomas Lumley, spoke to Firstline this morning.

Watch the interview or read the interview below:

“Now bear with us, because we’re about to talk statistics, but not the dry mathematics you might expect: it’s all about the art of picking an election winner.

In the US election, many commentators said the race was too close to call but there were some who picked the Obama victory almost perfectly like Nate Silver of the New York Times and Princeton’s Sam Wang. How did they get it right when others got it so wrong. Well for more on this I’m joined by Auckland University statistician Professor Thomas Lumley.

So people like Nate Silver and Sam Wang, were you surprised that they predicted it so accurately?”

Thomas: “No, it’s the sort of thing that you really can predict things accurately. There’s a lot of polling information in the United States, people do a lot of National polls, State polls and so on, and there’s a lot of history about how accurate they are so it is possible to put that information together.”

“So who is Nate Silver?”

Thomas: “He’s currently from the New York Times. He used to a run a separate blog called FiveThirtyEight.com and then got bought by the New York Times essentially. Before that, he was a baseball statistician, he did baseball prediction.

He was extremely close, he was actually lucky as well as smart. He was closer than he could have been just by being right: but he got every single state correct in the electoral college vote and Florida which hasn’t been decided yet, he predicted at almost exactly 50%.”

“So he’s making these correct calls and yet we’re reporting all the time: ‘too close to call’. How can there be such a gulf between what he does and what everyone else is saying?”

Thomas: “Partially, it’s what people aren’t used to what you can do by putting the poll information together. In the old days, people looked at one poll at a time, and there because of the biases in different polls and because each poll is relatively small, maybe 1000 or 5000 people you can’t tell very accurately.

But if you put them all together you can tell quite accurately unless something really novel happens – there’s a big change in who goes out to vote or something. [This is what’s called] meta-polling: putting polls together. People have been picking polls with what they would like to believe and one of the things about Nate Silver is that he’s very good at distinguishing what he wants to be true from what there’s actually data about.”

“George Will of the Washington Post said Romney would win with 320 electoral votes, another one from the New York Post said 325. They’re way off.”

Thomas: “They’re way off and those people are off more than a reliance on a single poll could be. Part of the issue is that one of the things that political journalism is valuable about it is that people talk to inside sources and learn what people inside the parties are saying and cross check it. But it doesn’t actually help in this case because there isn’t any inside information, the parties don’t know any more than the pollers do.”

“Would something similar work for New Zealand elections?”

Thomas: “It would work and there’s a couple of websites which are trying to do it. It wouldn’t work quite as well probably because there are fewer polls in New Zealand. Because New Zealand’s smaller and the polls still have to be 1000 or so people, you can’t afford as many polls in a New Zealand as a US one. There isn’t as much information. It would still work better than a single poll though.

Treatment delivery, not just discovery

Two stories in the Herald today have the related theme of health problems where we know the answer in theory, just not how to get it done in practice.

Prof. Norman Sharpe, from the Heart Foundation, describes NZ’s record on rheumatic fever as ‘shameful’.  I’d put it differently. NZ’s record on child poverty is shameful. The record on rheumatic fever is embarrassing.  Rheumatic fever is an anachronism. You couldn’t even put it in a soap opera nowadays.  It’s the sort of obscure historical disease that appears in ‘House‘.

Economic inequality is a major reason why the underlying infections spread widely in some subsets of Kiwi kids, but that isn’t the whole story.  The US and the UK have child poverty, but they don’t have rheumatic fever.  Rheumatic fever is an autoimmune reaction to untreated streptococcal throat infections.  Unlike many infectious diseases where antibiotic resistance is a problem, these streptococci are uniformly susceptible to ordinary penicillin. The cost to Pharmac of a 10-day course of penicillin is about $5,  but we obviously haven’t managed to set up an infrastructure that will reliably get the treatment to the kids who need it.

The other story had the slightly-misleading lead

Letting children out to play on their own could do a lot more to combat obesity, rather than structured exercise, a study shows.

The study actually looked about attitudes to ‘active play’ and ‘physical exercise’ in kids and families in a South Auckland school. The researchers found that ‘physical exercise’ was regarded as healthy, but active play was regarded as fun.  They suggest that encouraging kids to play outside in an unorganised way would be a more effective way of getting them to exercise.  We don’t know if this will actually work, but it is targetting the right part of the problem.  We know that exercise improves health, we just don’t know what to do to get people to exercise.


[Update: On Twitter, @dr2go says NZ isn’t an outlier.  That’s true for NZ as a whole, and the rates in Pakeha are similar to those in US whites.  I don’t think it’s true for Maori or Pacific children,  where the rates are higher even than US minority groups had in the 1960s (reference), and there’s been a big decline since then]