September 20, 2012

Precise questions and the 47%

Brad DeLong points out (mixed in with lots of other stuff) out how carefully you have to state things to get to the famous 47% of non-taxpaying Americans: Last year 47% of tax units paid no net federal income taxes. 

  • Last year: when unemployment was at record levels since the Great Depression
  • tax units: married couples filing jointly count as only one tax unit, so you undercount them relative to single people, who are more likely to be either young or old and thus lower-income
  • net: the USA delivers child benefits and some income support via the federal income tax system. A family whose child benefits are larger than their federal income tax is counted in the 47%
  • federal income taxes: it doesn’t include sales tax, state and local income taxes, or even federal payroll tax (which is paid as a proportion of income and funds Social Security and Medicare)

Precise questions can matter a lot.

Roundup scare

You’ll probably be seeing local stories about GM corn and the weedkiller Roundup coming out soon.  Here’s an overseas example. I was asked for comment on the research paper by the NZ Science Media Centre, and said

I do not think the herbicide risks look convincing, especially with respect to cancer.  There is no consistent pattern in deaths with dose of either Roundup or GM corn: this is not just showing a threshold, as the authors suggest, since in all six of their comparisons the highest-dose group has lower mortality than lower-dose groups.  The hypothesis of hormone-related cancer differences is not supported by the multivariate biochemical analysis, which found differences in salt excretion but not in testosterone or estradiol.  The strongest conclusion that could be drawn from this study is that it would be worth studying a larger group of controls than just 10 and (since there is no sign of dose-response) just a single low dose of Roundup or GM corn.

The researchers say “It is noteworthy that the first two male rats that died in both GM treated groups had to be euthanized due to kidney Wilm’s tumors”. This is noteworthy, but perhaps not in the way the researchers mean: increases in human Wilms’ tumor from GM corn or herbicide residues would already be obvious even at rates hundreds of times lower than reported in these rats.

At the time, I had only read the research paper, not any of the media stories.  There is a detail in the story I linked above that is absolutely outrageous:

Breaking with a long tradition in scientific journalism, the authors allowed a selected group of reporters to have access to the paper, provided they signed confidentiality agreements that prevented them from consulting other experts about the research before publication.

That is, we’ll let you have a scoop provided we can make sure there’s no risk of getting it right or disagreeing with us.  Embargoes on stories about scientific papers are standard, but one of the justifications is to precisely to provide journalists with time to get the facts right.   It would be interesting to know how many of the journalists who signed these agreements were willing to admit to it in their stories.


September 19, 2012

They don’t reverse into mountains

That’s how I first heard the theory that it’s safer to sit at the back of a plane than at the front. It turns out there’s something to it: back in 2007, Popular Mechanics magazine looked at data on all the US plane crash fatalities over 35 years and found a roughly 40% higher risk of death in front of the wing.

Stuff is now reporting on a British TV stunt, where a plane full of crash-test dummies was deliberately crashed in the Sonoran Desert.  The test found that the front of the plane experienced higher accelerations, so you would be better off near the back. It also found that the brace position helped.  This, of course, applies to only one form of plane crash — the ‘controlled flight into terrain’, and only to a subset of those.  In some crashes no-one dies; in others everyone dies.

The conclusion that economy class is safer in general is much more dubious.  It can’t be much safer, since the chance of dying in a ‘fatal air incident’ is very, very, very small wherever you sit (Wikipedia claims about 1 per 10 million journeys). Crashes are only a subset of fatal incidents,  and the benefit of sitting near the back must be substantially smaller even than this. As a comparison, on an 8+ hour flight, the chance of pulmonary embolism is about 16 times higher than the chance of dying in a fatal air incident, and nearly 50 times high for a 12+ hour flight, so a relatively small reduction in risk in first class would outweigh any crash benefit.


Albacore goldmine

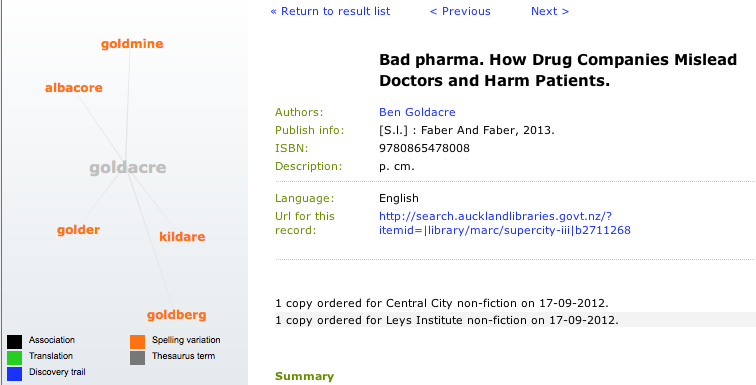
Ben Goldacre has a new book, “Bad Pharma”, coming out next week. I was checking to see if the Auckland city library had ordered it:

Indeed they have. Also, I found out that they have a graphical search tool for looking at connections between possible search terms. Just like Google’s Knowledge Graph, only not.  Clicking one of the orange words (eg, albacore or goldmine) takes you to another set of connections: albacore, hardcore, Vegemite, lockdown, toast, Screwtape,.. the possibilities for free association are endless).

Colour choices matter

In the map below(via), of extrapolated obesity rates in the US in 2030, one state stands out

Does Colorado have the highest predicted rate? No, that’s down in the South-East. The lowest rate? Again, no, that’s further west. Colorado is just the pinkest state, because of infelicitous colour choices.


September 18, 2012

NRL Predictions, Preliminary Finals

Team Ratings for the Preliminary Finals

Here are the team ratings prior to the Preliminary Finals, along with the ratings at the start of the season. I have created a brief description of the method I use for predicting rugby games. Go to my Department
home page to see this.

Current Rating Rating at Season Start Difference
Bulldogs 6.65 -1.86 8.50
Sea Eagles 6.61 9.83 -3.20
Rabbitohs 6.38 0.04 6.30
Cowboys 6.35 -1.32 7.70
Storm 5.67 4.63 1.00
Raiders 1.12 -8.40 9.50
Knights 0.01 0.77 -0.80
Dragons -0.37 4.36 -4.70
Broncos -0.98 5.57 -6.50
Sharks -2.05 -7.97 5.90
Titans -2.20 -11.80 9.60
Wests Tigers -2.74 4.52 -7.30
Roosters -5.43 0.25 -5.70
Panthers -6.45 -3.40 -3.00
Warriors -8.08 5.28 -13.40
Eels -8.25 -4.23 -4.00


Performance So Far

So far there have been 198 matches played, 121 of which were correctly predicted, a success rate of 61.11%.

Here are the predictions for last week’s games.

Game Date Score Prediction Correct
1 Sea Eagles vs. Cowboys Sep 14 22 – 12 3.77 TRUE
2 Rabbitohs vs. Raiders Sep 15 38 – 16 7.44 TRUE


Predictions for the Preliminary Finals

Here are the predictions for the Preliminary Finals

Game Date Winner Prediction
1 Storm vs. Sea Eagles Sep 21 Storm 3.60
2 Bulldogs vs. Rabbitohs Sep 22 Bulldogs 0.30


The question matters

Luis Apiolaza has an interesting post on suicide statistics in Canterbury, where he examines the Coroner’s comments that suicide rates decreased after the quake.

He compares the actual counts of suicides since 2007 to a purely random sequence of counts with the same mean (a Poisson process), and doesn’t see much difference: one of the panels below shows the real data, and the other four show data with no pattern.

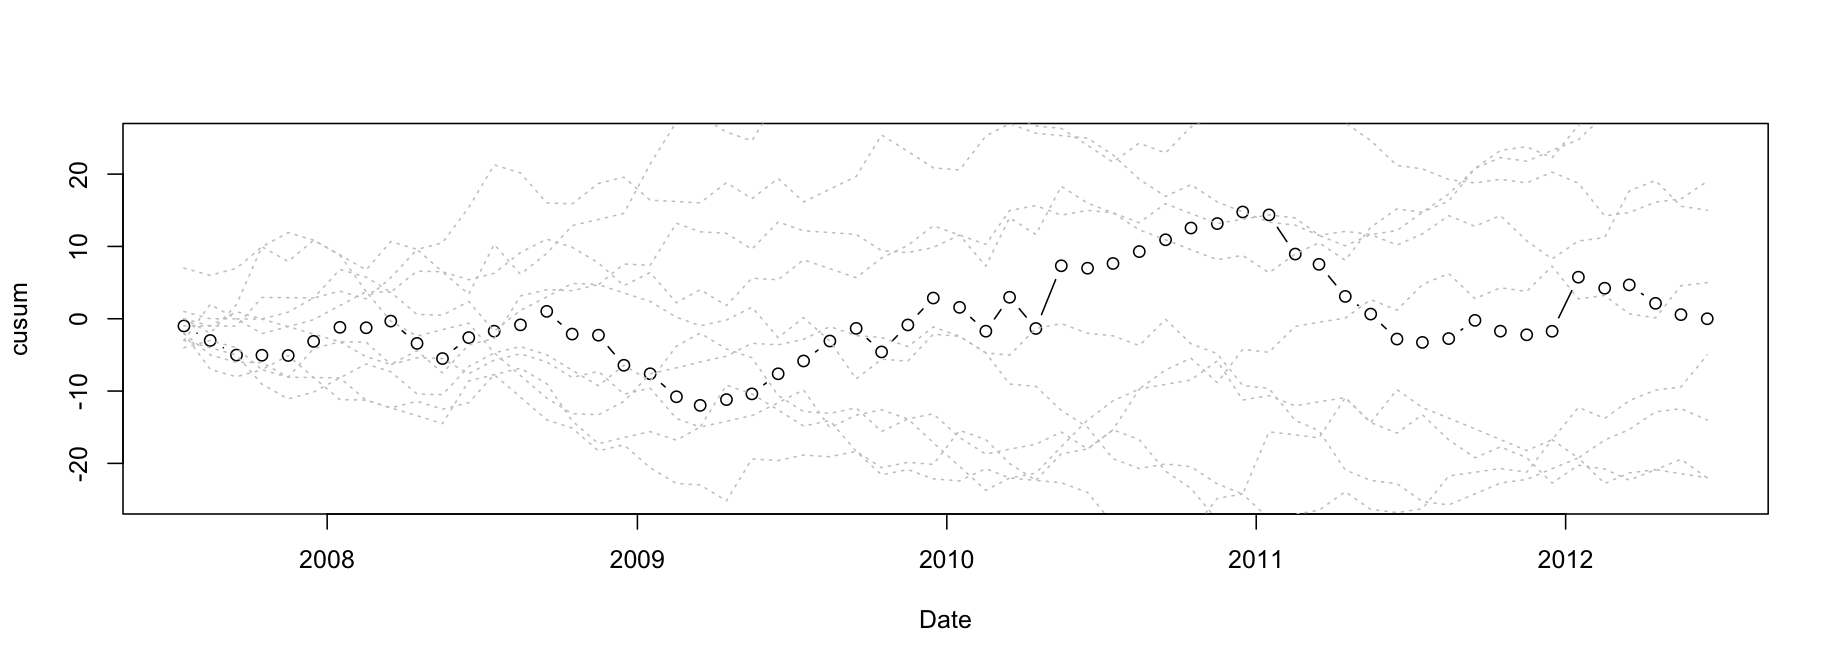
Another way to look at the same thing is with cumulative sums, used in industrial process control: the dots are cumulative sums of actual minus average suicides, and the dashed lines in the background are ten simulated versions of the same thing, with no true pattern. Again, the real data doesn’t stand out as different.

These analyses answer the question “Is there evidence of changes in suicide rate in Canterbury some time in the last five years?”, saying “Not really”.  However, if we know when the February earthquake was, and we know that lower suicide rates (and also crime rates) are often seen after natural disasters, we can ask if the Canterbury data are consistent with that expectation. They are, as the Coroner observed, but if you didn’t already have that expectation, the data wouldn’t provide much evidence for it.

The data don’t speak for themselves: you have to ask them questions, and the choice of question matters.


Doing arithmetic in public

Stuff’s story about the real costs and potential profits of ‘The Block’-style renovations is an example of something we should see more of.  Except, that ideally, we wouldn’t need the newspapers to do it for us.

Matthew Yglesias, at Slate, has a related complaint about ‘math is hard’ descriptions of national budgets

one of the most frustrating things about Washington-style budgeting—there are tons of numbers but almost no math, and yet the barely extant math is considered extremely difficult to master.

The math in question, however, consists of basically stuff you should have mastered in eighth or ninth grade. You add stuff up, multiply, and sometimes solve for x.

And you don’t even have to do it by hand, as you might have in school.

September 17, 2012

Correlation without mechanism

Sometimes you just know that apparent associations just have to be spurious: the price of tea in China really doesn’t affect NZ violent crime rates, and you’re no more likely to win at lotto if you buy your ticket from a shop that’s sold winning tickets in the past.  There’s no way that one could affect the other.

The Herald has a story on functional foods that’s very similar to one I commented on in May.  Again, before even looking at the claims, how could it be true that the shape of a food was a guide to its function? It would be necessary for God to have set it up that way (and, apparently, without bothering to tell anyone).

Match foods to parts of the body for optimum health benefits:

Also, let’s look at some of the examples

1. Healthy Bones: Bony-looking foods such as rhubarb, rich in vitamin K, and celery, rich in silicon, are both good for bones and healthy joints.

Vitamin K was once suggested as involved in bone health, based on observational studies, but a large randomised trial didn’t find any beneficial effect.  Also, although raw rhubarb has moderately high Vitamin K levels (about half as much as cooked broccoli), cooked rhubarb has much less.

3. Sight for Sore Eyes: Slice a carrot and the round circle will show a likeness to an eye, complete with pupil and iris. They contain beta-carotene and antioxidants, both helpful for eyesight issues.

Parsnips have the same shape (as do many roots), but lack the carotenoids.  Orange/golden kumara and pumpkin, which don’t have the eye shape, do have the carotenoids.  And I’m sure you could think of other body parts with more similarity to the carrot than eyes…

5. Round Fruit: Lemons and grapefruit with limonoids and vitamin C are believed to be helpful in preventing breast cancer.

How about quinces, mangoes, coconuts, and melons, which all have historical and cultural support for looking like breasts (or, if we follow Biblical authority, perhaps venison is the relevant food)
Stat of the Week Competition: September 15 – 21 2012

Each week, we would like to invite readers of Stats Chat to submit nominations for our Stat of the Week competition and be in with the chance to win an iTunes voucher.

Here’s how it works:

  • Anyone may add a comment on this post to nominate their Stat of the Week candidate before midday Friday September 21 2012.
  • Statistics can be bad, exemplary or fascinating.
  • The statistic must be in the NZ media during the period of September 15 – 21 2012 inclusive.
  • Quote the statistic, when and where it was published and tell us why it should be our Stat of the Week.

Next Monday at midday we’ll announce the winner of this week’s Stat of the Week competition, and start a new one.

(more…)