August 24, 2012

Today’s biggest cancer breakthrough

Stuff is reporting on a software system called Volpara for improving breast-cancer screening, from Wellington company Matakina (and 3News had a similar story).  The software is designed to give more reliable and objective estimates of breast density, with less variation due to different equipment or different radiologists.  This should be helpful in screening younger women, either to improve detection of tumours or to reduce false positives, and the software seems to have been quite successful commercially.

Medical progress is pretty incremental: even the best ideas and techniques tend to have relatively small impact on health, so while it’s good to see NZ medical contributions being recognised, it’s also useful to put them in context. (more…)

One in three, one in six, one in eight?

The Herald says

One in three New Zealanders have been harmed by their own alcohol drinking, a survey shows.

The survey, published in the New Zealand Medical Journal, found 33.8 per cent of current drinkers reported they had been adversely affected in the past year.

This is actually true: there is such a survey, it is published in the NZMJ, and it’s a real survey (the response rate isn’t all one could wish, but it’s not out of line with other major health surveys).  The story goes on to say that the harm was reported more often by men.

The interesting point is that the current issue of NZMJ has two articles about frequency of harm from drinking.  The other one says, also based on real survey data,

The prevalence of self-reported harm from others’ drinking was higher than harm from own drinking (18% vs 12% in the past year) and was higher in women and young people.

And this second survey isn’t pro-alcohol in the slightest — for example, it quotes the proportion of criminal offenders who had been drinking as if it was the proportion of crimes resulting from alcohol.  This is a huge overestimate, precisely because there is too much drinking in NZ: the people who are drunk and arrested in the major cities tend to be just as drunk about three times a week on average (based on Massey Uni. research that we’ve mentioned before).

The timing of these articles is perhaps not a coincidence, but in fact there’s pretty wide consensus about the harms from drinking: the real disagreement is about the costs of various sorts of regulation.

August 23, 2012

NRL Predictions, Round 25

Team Ratings for Round 25

Here are the team ratings prior to Round 25, along with the ratings at the start of the season. I have created a brief description of the method I use for predicting rugby games. Go to my Department home page to see this.

Current Rating Rating at Season Start Difference
Bulldogs 7.81 -1.86 9.70
Sea Eagles 5.87 9.83 -4.00
Cowboys 5.44 -1.32 6.80
Storm 4.44 4.63 -0.20
Rabbitohs 2.89 0.04 2.80
Knights 0.98 0.77 0.20
Wests Tigers 0.94 4.52 -3.60
Broncos -0.25 5.57 -5.80
Titans -0.43 -11.80 11.40
Sharks -0.75 -7.97 7.20
Raiders -2.75 -8.40 5.60
Dragons -4.22 4.36 -8.60
Warriors -4.47 5.28 -9.70
Eels -5.00 -4.23 -0.80
Roosters -6.08 0.25 -6.30
Panthers -8.15 -3.40 -4.70


Performance So Far

So far there have been 176 matches played, 103 of which were correctly predicted, a success rate of 58.52%.

Here are the predictions for last week’s games.

Game Date Score Prediction Correct
1 Broncos vs. Storm Aug 17 18 – 19 -0.04 TRUE
2 Bulldogs vs. Wests Tigers Aug 17 23 – 22 13.35 TRUE
3 Raiders vs. Roosters Aug 18 24 – 20 8.56 TRUE
4 Sharks vs. Rabbitohs Aug 18 20 – 7 -1.45 FALSE
5 Titans vs. Eels Aug 19 24 – 16 9.27 TRUE
6 Warriors vs. Panthers Aug 19 16 – 18 10.12 FALSE
7 Sea Eagles vs. Knights Aug 19 42 – 20 6.99 TRUE
8 Dragons vs. Cowboys Aug 20 22 – 32 -4.24 TRUE


Predictions for Round 25

Here are the predictions for Round 25

Game Date Winner Prediction
1 Sea Eagles vs. Broncos Aug 24 Sea Eagles 10.60
2 Raiders vs. Bulldogs Aug 24 Bulldogs -6.10
3 Panthers vs. Titans Aug 25 Titans -3.20
4 Dragons vs. Warriors Aug 25 Dragons 4.70
5 Cowboys vs. Knights Aug 25 Cowboys 9.00
6 Roosters vs. Wests Tigers Aug 26 Wests Tigers -2.50
7 Rabbitohs vs. Eels Aug 26 Rabbitohs 12.40
8 Storm vs. Sharks Aug 27 Storm 9.70


Stat-related startups

At Simply Statistics, a set of stat/data related startups.

One that looks interesting for teaching and for data journalism purposes is Statwing, which is building a web-based pointy-clicky data analysis system, aiming to have good graphics and good text descriptions of the results.  This is the sort of project where the details will matter a lot — poking around at their demo there were a few things I was slightly unhappy about, but nothing devastatingly bad, so there is potential.

How was the survey done, by whom, and what are they selling?

Those are the basic questions you need to ask when reading, for example, that “almost half of Australian workers would rather quit a job than deal with office tension.”

Unfortunately, in the case the media release doesn’t answer the first question, and its answer to the second and third questions is

The 2012 R U OK? Australian Workplace Relationships Survey was developed in partnership with the Centre for Corporate Health, one of Australia’s leading workplace mental health service providers. 

Now, workplace mental health is an important issue, and for all I know it may be seriously neglected in Australia (I last worked there in 1995, but it was in a medical research centre, which probably isn’t typical).   That doesn’t mean mental-health advocates get a free pass on data quality — good facts matter more for important issues than for, say, whether we should wear pyjamas in the street.

The Centre for Corporate Health isn’t that enthusiastic about telling us how the survey was done: you need to subscribe to their research news to get in, and even then all they say is

The survey was distributed via online and paper-based to people across a wide range of Australian workplaces including both public and private sectors with all industry groups being represented.  The survey was open for a four week period. The total number of survey respondents was 1554.

which is not encouraging either in what it says or what it omits.  As far as I can tell, there’s no reason to believe the numbers are good estimates of anything about Australian employees as a whole.

The reason that organizations do these surveys seems to largely be marketing: having things that look (from the right angle, in poor light) like statistics makes it easier to get media coverage.  It shouldn’t: if we’re covering West Island business or health news, “R U OK Day” is important enough to be in the papers without needing unconvincing numerical camouflage to get it past the gate.
Where does 80m of molten rock end up?

Wherever it wants.

Apparently, if the next Auckland volcano is in the worst possible location, 500000 people might need to be evacuated.  Even in a better location it will be no fun at all, with the only redeeming feature being that even Peter Thompson will have to concede that it’s not the best time to buy a house.   It’s good that research and planning is underway, so the mayor’s office will have a set of contingency plans filed under “V” for when the next eruption happens, but the need for public panic awareness is perhaps less than for the Alpine Fault.

From a statistical viewpoint, there are two factors that go into how much you should do to prepare for an emergency: how likely it is, and how much the preparation will help.   The earthquake wins on both of these: it’s about ten times as likely in the next 50 years, and we can do a lot more to reduce the damage.  With the Alpine Fault, we need to decide how much to spend on strengthening roads, bridges, and houses, and making water and sewer systems less likely to break.  Public discussion and pressure on the government are important.  On the other hand, if a river of molten rock heads south from One Tree Hill, or a chunk of tuff the size of a refrigerator lands on my roof, my house isn’t going to survive no matter how good the building standards are.

In terms of things we can actually influence, we might want to worry more about which bits of Auckland will be under water in 50-100 years, not which bits will be under lava.

August 22, 2012

Non-awful lottery story

Stuff has a story on today’s Big Wednesday lotto that doesn’t say anything obviously untrue or misleading.  I’m sure this isn’t a first, but it is rare enough to be notable.

The story doesn’t say anything about the odds, but in a sense that’s not the point: you don’t play the lottery to win, you play it to imagine winning.  To quote another statistician

The benefit to playing the lottery comes entirely between buying the ticket, and when the winner is revealed. During this interval, someone who has bought the ticket can entertain the idea that they might win, and pleasantly imagine how much better their life could be with the money, what they would do with it, etc. … If a $1 lottery ticket licenses even one hour of imagining a different life, I don’t see how people who spend $12 for two or three hours of such imagining at a movie theater, or $25 for ten hours at a bookstore, are in any position to talk.


August 21, 2012

Show us the sources

The Herald has a good story today about attitudes to depression (unfortunately, only in Australia, but you can’t have everything).

Judging from the information on the beyondblue website about the 2001-2 survey, this is a real survey using random telephone sampling.  It’s asking important questions, and the Herald’s story summarises the worrying level of ignorance about depression among Aussies.  Notably, “62 per cent wrongly believe antidepressant medication is addictive” — the problem is the reverse, these medications are often difficult to keep taking for the necessary extended periods of time.

I said that I was judging from the information about the 2001-2 survey.  The webpage was last updated in 2006, and it says they are looking to do a second survey in 2004. Some more Googling suggests that they did a second survey in 2007-8, but I can’t find any results.  The media releases page doesn’t say anything, and the most recent release listed is from a month ago.

In the modern world it’s a pity that organisations can’t be more consistent about posting for the rest of us the information that they send out to the media. Then we might even have more success in persuading the media to link to it.

Measuring what you care about

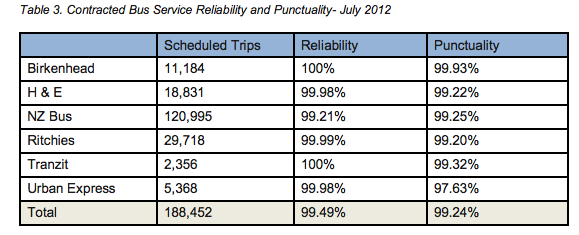
The Herald is reporting on Auckland Transport’s monthly report (you can find the reports here).  One of the recurring surprises in these reports is how high the punctuality figures are, and the Herald comments on these for some of the train services.

The bus punctuality statistics are even shinier


As a regular bus commuter it’s hard to imagine how these could be correct — and if they were, there would be no need for the real-time bus predictions, since the timetables would be more accurate than the predictions.

The solution is in the fine print: “Service punctuality for July 2012 was 99.24%, measured by the percentage of services which commence the journey within 5 minutes of the timetabled start time and reach their destination“.

Or, to quote Lewis Carroll’s Humpty Dumpty “When I use a word it means just what I choose it to mean — neither more nor less”

Queueing theory and practice

There’s an interesting story in the New York Times about queueing, a subject dear to the hearts of some of my colleagues.  In one sense queueing is a topic in probability theory, where you work out how long people might have to wait under various circumstances, leading to surprising but useful techniques such as metered on-ramps to motorways.  But it’s also a topic in applied psychology: if you get off your plane ten minutes before your bags arrive at the carousel, you’ll notice the wait less if you spend most of it walking. So that’s what the airports make you do.