March 12, 2012

Stat of the Week Winner: March 3-9 2012

This week’s winner was tough to decide – there were a fantastic selection of nominations. Thank you to all who entered!

The winner is Eric Crampton’s nomination of the Dominion Post’s burglary statistics:

“Wellingtonians were far less likely to be burgled than their Auckland counterparts, with 31 per cent of all burglaries taking place in the Auckland region, compared with just under 9 per cent in Wellington.”

Eric points to Bill Kaye-Blake’s thorough critique here.

Stat of the Week Competition: March 10-16 2012

Each week, we would like to invite readers of Stats Chat to submit nominations for our Stat of the Week competition and be in with the chance to win an iTunes voucher.

Here’s how it works:

  • Anyone may add a comment on this post to nominate their Stat of the Week candidate before midday Friday March 16 2012.
  • Statistics can be bad, exemplary or fascinating.
  • The statistic must be in the NZ media during the period of March 10-16 2012 inclusive.
  • Quote the statistic, when and where it was published and tell us why it should be our Stat of the Week.

Next Monday at midday we’ll announce the winner of this week’s Stat of the Week competition, and start a new one.

(more…)

March 9, 2012

NRL Predictions, Round 2

Team Ratings for Round 2

Here are the team ratings prior to Round 2, along with the ratings at the start of the season.
I have created a brief description of the method I use for predicting rugby games. Go to my Department home page
to see this.

Current Rating Rating at Season Start
Sea Eagles 10.30 9.83
Broncos 6.10 5.57
Warriors 4.80 5.28
Dragons 4.51 4.36
Storm 4.34 4.63
Wests Tigers 3.24 4.52
Roosters 0.92 0.25
Knights 0.62 0.77
Rabbitohs -0.62 0.04
Bulldogs -0.98 -1.86
Cowboys -3.96 -1.32
Panthers -4.28 -3.40
Eels -4.77 -4.23
Sharks -6.69 -7.97
Raiders -8.12 -8.40
Titans -9.16 -11.80


Performance So Far

So far there have been 8 matches played, 4 of which were correctly predicted, a success rate of 50%.

Here are the predictions for the games so far.

Game Date Score Prediction Correct
1 Knights vs. Dragons  Mar 01 14 – 15 0.91 FALSE
2 Eels vs. Broncos  Mar 02 6 – 18 -5.30 TRUE
3 Raiders vs. Storm  Mar 03 19 – 24 -8.53 TRUE
4 Panthers vs. Bulldogs  Mar 03 14 – 22 2.96 FALSE
5 Cowboys vs. Titans  Mar 03 0 – 18 14.98 FALSE
6 Warriors vs. Sea Eagles  Mar 04 20 – 26 -0.05 TRUE
7 Wests Tigers vs. Sharks  Mar 04 17 – 16 16.99 TRUE
8 Rabbitohs vs. Roosters  Mar 05 20 – 24 4.29 FALSE


Predictions for Round 2

Here are the predictions for Round 2.

Game Date Winner Prediction
1 Sea Eagles vs. Wests Tigers  Mar 09 Sea Eagles 11.60
2 Broncos vs. Cowboys  Mar 09 Broncos 14.60
3 Titans vs. Raiders  Mar 10 Titans 3.50
4 Bulldogs vs. Dragons  Mar 10 Dragons -1.00
5 Sharks vs. Knights  Mar 11 Knights -2.80
6 Roosters vs. Panthers  Mar 11 Roosters 9.70
7 Storm vs. Rabbitohs  Mar 11 Storm 9.50
8 Eels vs. Warriors  Mar 12 Warriors -5.10


Newsflash: Auckland is larger than Wellington

The denominator problem shows up yet again, this time in a press release from AA insurance, leading to stories in the Dominion Post, the Herald, the Aucklander, and probably others, and a Stat of the Week nomination for the Groping Towards Bethlehem blog (via Eric Crampton).

There are statistical problems in the press release, but the newspapers came up with additional bonus examples.

The press release says

Between 2009 and 2011 AA Insurance received the highest number of burglary and theft from vehicle claims from Auckland, Hamilton, Wellington, and Christchurch.

and the Dominion Post amplifies this to

But Wellingtonians were far less likely to be burgled than their Auckland counterparts, with 31 per cent of all burglaries taking place in the Auckland region, compared with just under 9 per cent in Wellington.

Auckland has three times as many burglaries as Wellington, which sounds bad until you consider that Auckland is larger than Wellington, by a factor of about, um, three.  Using population at the last census, the rate of burglaries per capita is still higher in Auckland, but by only 20%.   If we compare Auckland to the whole population of New Zealand, the burglary rate per capita is slightly lower in Auckland; and since the Wellington rate is lower, if we combine Auckland and Wellington the rate is also lower than for the rest of the country. This tends to cast doubt on the comment

AA Insurance head of operations Martin Fox said daytime robberies were more common in big cities, where most people did not head home for lunch.

This could be true  if night-time burglaries[I assume he means burglaries, not robberies] were much more common outside big cities, but we aren’t given any data to support this, and the data we do have argues against it.

So far this is mostly fluff, but the interesting bit of news is

Security alarms had proven effective for preventing burglaries, with 60 per cent of claims between 2009-11 coming from homes without alarm systems.

AA Insurance presumably know how many of their customers have security alarms, so they might have evidence for this claim. Perhaps only  30% of insured homes lack alarm systems, so the 60% of claims from such homes is notable.   We can’t tell, because they don’t explicitly give any comparisons of rates, they don’t give information that we could use to compute rates, and they sure haven’t given us any reason to trust them on the handling of denominators.

If we did have rates, there would still be a problem of causation vs correlation.  A Ministry of Justice survey in 2004 did find lower rates of burglary in houses with alarms, but they also found

The security measure most strongly associated with lowered rates of burglary was ‘telling neighbours when everyone will be away’. As only a small proportion of burglaries occurred while the occupants were away (Section 6.5.1), presumably this measure was an indicator for a more general relationship, such as a lowered risk of burglary when neighbours are known and when neighbours look out for one another.
Super 15 Predictions, Week 3

Team Ratings for Week 3

Here are the team ratings prior to Week 3, along with the ratings at the start of the season.
I have created a brief description of the method I use
for predicting rugby games. Go to my Department
home page
to see this.

Current Rating Rating at Season Start
Crusaders 9.22 10.46
Bulls 6.38 4.16
Stormers 6.03 6.59
Reds 4.90 5.03
Waratahs 4.35 4.98
Blues 1.78 2.87
Sharks 1.66 0.87
Chiefs -0.95 -1.17
Hurricanes -2.05 -1.90
Highlanders -3.57 -5.69
Force -4.08 -4.95
Cheetahs -4.45 -1.46
Brumbies -6.72 -6.66
Lions -10.12 -10.82
Rebels -15.68 -15.64


Performance So Far

So far there have been 14 matches played, 9 of which were correctly predicted, a success rate of 64.3%.

Here are the predictions for the games so far.

Game Date Score Prediction Correct
1 Blues vs. Crusaders Feb 24 18 – 19 -3.10 TRUE
2 Brumbies vs. Force Feb 24 19 – 17 2.80 TRUE
3 Bulls vs. Sharks Feb 24 18 – 13 7.80 TRUE
4 Chiefs vs. Highlanders Feb 25 19 – 23 9.00 FALSE
5 Waratahs vs. Reds Feb 25 21 – 25 4.40 FALSE
6 Stormers vs. Hurricanes Feb 25 39 – 26 13.00 TRUE
7 Lions vs. Cheetahs Feb 25 27 – 25 -4.90 FALSE
8 Chiefs vs. Blues Mar 02 29 – 14 -0.70 FALSE
9 Rebels vs. Waratahs Mar 02 19 – 35 -15.40 TRUE
10 Lions vs. Hurricanes Mar 02 28 – 30 -3.90 TRUE
11 Highlanders vs. Crusaders Mar 03 27 – 24 -10.40 FALSE
12 Reds vs. Force Mar 03 25 – 20 15.10 TRUE
13 Cheetahs vs. Bulls Mar 03 19 – 51 -1.40 TRUE
14 Stormers vs. Sharks Mar 03 15 – 12 10.00 TRUE


Predictions for Week 3

Here are the predictions for Week 3. The prediction is my estimated points difference with a positive margin being a win to the home team, and a negative margin a win to the away team.

Game Date Winner Prediction
1 Crusaders vs. Chiefs Mar 09 Crusaders 14.70
2 Force vs. Hurricanes Mar 09 Force 2.50
3 Brumbies vs. Cheetahs Mar 10 Brumbies 2.20
4 Highlanders vs. Waratahs Mar 10 Waratahs -3.40
5 Reds vs. Rebels Mar 10 Reds 25.10
6 Sharks vs. Lions Mar 10 Sharks 16.30
7 Bulls vs. Blues Mar 10 Bulls 9.10


Current nominations for Stat of the Week – add yours before midday

Thanks for all the nominations on our Stat of the Week competition, there’s still a couple of hours to add yours in before this week’s competition closes.

Nominations to date which qualify are:

Online NZ Herald poll: Port workers’ sacking – who do you support?

Sammy Jia points out that the options are only “The sacked workers” and “Ports of Auckland”. There is no option for saying “Neither side” or “Don’t know”.

Women: good at budgets, bad savers

Ksenia Kovaleva rants:

“This is an example of very limited numbers/ statistics being used by the media to suggest something I find misogynistic. The actual survey and numbers are very shaky evidence to draw any conclusions, especially about Kiwi women. This stat is affected by selection bias, self-reporting bias and possibly even a social desirability bias element in that are men likely to admit to feeling insecure when not that long ago a man’s ‘role’ was thought to be to provide financial stability?)

I find this stat an example of irresponsible journalism to take what I would deem an unreliable and limited statistical result, rip it apart from any current sociological context, and pair it with a quote as if those numbers support that one person’s view when they don’t.

A badly designed survey is being published in a national newspaper pared with a quote perpetuating stereotypes and the sad thing is unless you have actually studied statistics, I think most people will simply take it at face value.” Read the full nomination »

Attractiveness of beards

Jordan Yates critiques an article in the NZ Herald on the attractiveness of beards.

Rubbish statistics

Manakaetau ‘Otai says statistics in a NZ Herald article:

“may mislead and confuse NZ Herald readers, but overall the story is a positive use of statistics but there is no real reputable source for the statistics to back up their claims”

Let us know what you think of the nominations!

March 8, 2012

Not all heart disease is the same

The Heart Foundation is calling for approval of a new drug, ivabradine (for subsidy — it’s already approved for prescription).  The report in Stuff, unfortunately, puts in a bunch of numbers of varying relevance.

We are told the pill costs “as little as $3 a day” and that “Up to 160,000 people” in New Zealand have heart disease.  If ivabradine was actually useful in all those 160,000 people, the total cost would be $175 million per year, or about a quarter of Pharmac’s budget.   And you would know about it already.

The randomized trials of ivabradine, which do look very promising, are in people with one specific type of heart failure.  Heart failure is a particularly nasty form of chronic heart disease where the heart can’t pump enough blood to supply oxygen to the body.  Slowing down the heart rate helps — for centuries, foxglove extract (digitalis) was used, and the introduction of standardised versions of digitalis in 1785 is regarded as the start of modern therapeutics.  Fortunately, heart failure is a relatively small part of heart disease in the population.   There’s about 10,000 hospitalisations per year for heart failure, but that’s not 10,000 different people.  A 2005 paper found 8000 deaths over 9 years, or about 900 per year.   Not all of these will be the specific type of heart failure where ivabradine works.

If ivabradine works as well in practice as in the trials, and there don’t turn out to be any nasty side-effects, the Heart Foundation could be right — it could potentially prevent (actually, postpone for a bit) hundreds of deaths per year in NZ.   But the 160,000 people with heart disease or the one death every 90 minutes from all types of heart disease are not relevant to this much more specialised medical question.

March 7, 2012

Smoking wrecks the economy

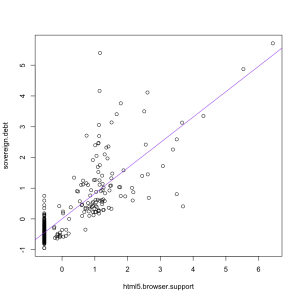
Our Stat-of-the-Summer was a miscalculation of the individual costs of smoking.  A correspondent has pointed me to an international correlation on the same topic.  Economists at ConvergEx have found a strongish correlation across countries between debt:GFP ratio and smoking.  The economists went as far as saying

“The relationship is strong enough that counting the cigarette butts in the ashtrays of street-side cafes around the world could be safely called `sovereign credit research’,” said Nicholas Colas, chief market strategist at ConvergEx.

That’s clearly nuts, but is the correlation telling us something useful or even interesting?  Could it really be true, as the correlation would suggest, that sovereign debt is the biggest factor affecting smoking rates (or, almost equally plausibly, vice versa)?

One empirical indication that ashtrays are not the best place to find national debt data comes from looking at changes over time.  Public debt is a cumulative process, so even more than usual we can quote the biologist D’Arcy Thompson “Everything is the way it is because it got that way”.

Over time, in the US, Britain, Australia, New Zealand, and many other countries, smoking reached a maximum among people born at the start of the twentieth century and has now been decreasing in popularity (because it, you know, kills you and stuff).  The pattern of public debt in those countries has been quite variable.  In Australia, debt ballooned and has now shrunk again.  In NZ, debt is increasing.  In the USA then debt:GDP ratio went down to a post-war minimum in the Clinton years and has been increasing again.  Also, the reasons for the changes are different in different countries — US debt is up largely because of tax cuts, but Australian debt is down in part because of better commodity prices.

So, over time, there is no consistent correlation between smoking and sovereign debt:GDP.  That being the case, it’s hard to see how the correlation across countries right now could be anything other than a coincidence.

If you ask Google Correlate what is correlated with “sovereign debt” as a web search term, you find out that “html 5 browser support”, rather than “smoking” has the strongest correlation (0.82) among terms that aren’t specifically debt-related, as in the graph on the left.  That makes about as much sense.


Hardcore music has a use

News outlets around the world and locally are reporting on a study that found loud music made alcohol taste sweeter.  The research participants drank various concentrations of cranberry & vodka while listening to nothing,  loud annoying music, a news track that they had to repeat back, or both the music and the news.

People who listened to the music rated the drinks as sweeter.  The researchers suggest this explains why people drink more in clubs.  I think they’re missing an important point.  The sweetness of alcoholic drinks is under the control of the manufacturer and the drinker, and there’s no reason to think that people in quiet settings deliberately choose drinks that are less sweet than they would prefer.  If the noise effect is strong enough to be meaningful in practice, it should just mean that people choose less sweet drinks when it’s loud and sweeter ones when it’s quiet — the same way that people allegedly drink more tomato juice on aeroplanes because taste sensations are different at altitude.

The researchers also found that the combination of the music and the news task “was accompanied by increased negative mood”, so if you need to take dictation, choose a bar that plays country and western, not hardcore.

March 6, 2012

Ban icecream sniffing?

The Herald headline is “Icecream cravings like cocaine: study”, and it’s another paper from our friends at the American Journal of Clinical Nutrition, but this time filtered through the British press.

Co-author of the study, Dr Kyle Burger, from the Oregon Research Institute, told The Daily Telegraph overeating high fat or high sugar foods appeared to change the way the brain responded to the food.

That’s not quite what the paper said he found.  The study looked at brain activity in people drinking a milkshake compared to a tasteless drink, and found that the milkshake effect was smaller in people who had eaten icecream frequently in past weeks.  But it wasn’t smaller in people who had eaten cookies, chocolate, hamburgers, cake, or chips, and there wasn’t any relationship to total dietary fat and sugar.   So, in fact, the study found that overeating high fat or high sugar foods did not appear to change the way the brain responded to the food.  As far as I can tell (and, unlike you, I can get the whole paper), the study does not report at all on the relationship between craving for icecream and the brain activity measurements.

So. The study found that brain response to a milkshake was weaker in people who eat a lot of icecream, but was unrelated to other high-fat or high-sugar foods, and that people who have cravings for icecream eat more icecream than people who don’t have cravings for it.