October 3, 2011

Emigration graphics

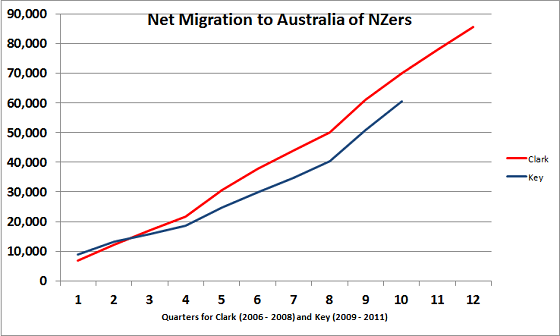
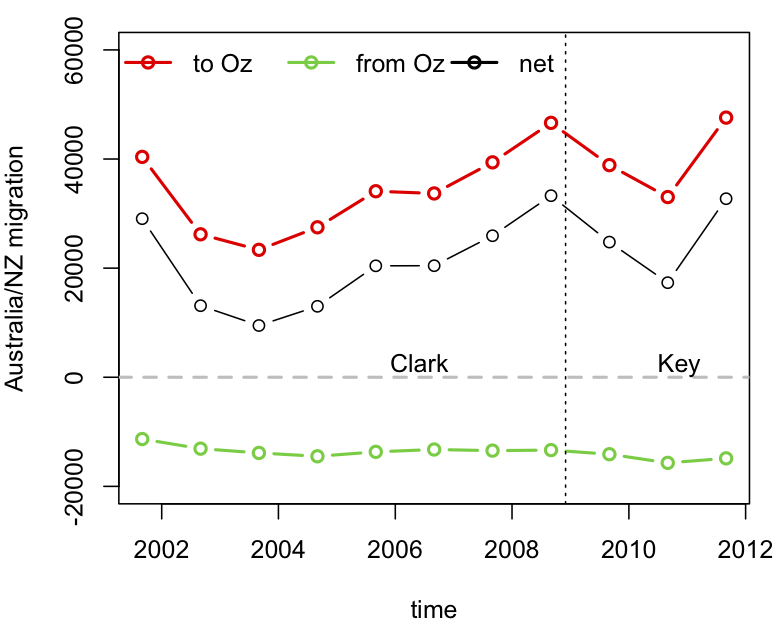
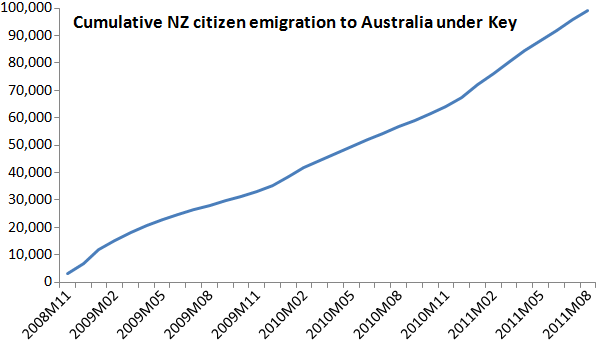
The big problem with our stat-of-the-week was the graphics.  While David Farrar’s redesign to add the early years of Helen Clark’s government provides some context, a cumulative graph is not a good way to see changes over time.   For anyone who actually wants to see the immigration/emigration rates over time, rather than just making a political point, here is a non-cumulative graph using data I downloaded from Stats New Zealand.  The dots are totals for the 12 months ending August each year (the most up-to-date values available).

Disaggregating immigration and emigration is helpful here: immigration from Australia has been roughly constant, but emigration to Australia fluctuates a lot, on top of a weak upwards trend.

“Unexpected results of a new poll”?

Kiwiblog’s David Farrar has nominated 3 News for the most misleading story of the week in their reporting of a political poll because their story does not mention that the poll was only a sample of Maori voters, not a sample of all voters:

“Labour most popular party in new poll…

Labour leader Phil Goff will be clinging to the unexpected results of a new poll in which his party has picked up twice as much support as National.

But he is well behind John Key in the preferred prime minister stakes, according to the TVNZ Marae Investigates Digipoll, released today.

Labour’s on 38.4 percent support in the poll, followed by the Maori Party on 22.2 percent, while National’s on just 16.4 percent. That is in stark contrast to other media polls, which put National above 50 percent support, with Labour rating at 30 percent or less, and the Maori Party on around one percent support.

…The TVNZ poll interviewed 1002 respondents between August 19 and September 20, and has a margin of error of +/- 3.1 percent.”

The original press release from TVNZ does state this very clearly:

Full release of Digipoll Maori Voter Survey… The TVNZ Marae Investigates Digipoll is one the most established voter polls in NZ and often the only one to survey Maori voters in an election year.

In a further 3 News article they discuss a different poll and say that “the poll differs greatly to one released by TVNZ’s Marae Investigates earlier today” without explanation for the difference.

UPDATE: 3 News have now updated the headline to: “Labour most popular party among Maori” and added “The TVNZ Marae Investigates Digipoll surveyed Maori listed on both the general and Maori electoral rolls.”

3 News’ Chief Editor James Murray apologised on Kiwiblog:

“Got to put our hands up to a genuine mistake there. This was a story from our wire service, and we didn’t do our due diligence in fact-checking it.

We absolutely understand the importance of getting this right, and the story has now been corrected. My team have been told to be extra vigilant on poll stories in future and NZN have been informed of the error.

Apologies for anyone who may have been misled by this mistake.”

Stat of the Week Winner: September 24-30 2011

This week we’ve chosen Jeremy Greenbrook-Held’s nomination of this graph found on political blog The Standard:

Many have been criticising the graph, including David Farrar, those in the comments on The Standard and a blog post on Stuff, and here’s a summary of the main concerns:

  1. Using cumulative figures, making it appear as though the rate of emigration is increasing.
  2. Starting the graph at zero makes it appear as though no-one emigrated prior to John Key becoming Prime Minister.
  3. The graph uses gross migration rather than net migration
  4. Not displaying historial emigration data for comparison

David Farrar created a graph which addresses points 3 and 4 above:

Stat of the Week Competition: October 1-7 2011

Each week, we would like to invite readers of Stats Chat to submit nominations for our Stat of the Week competition and be in with the chance to win an iTunes voucher.

Here’s how it works:

  • Anyone may add a comment on this post to nominate their Stat of the Week candidate before midday Friday October 7 2011.
  • Statistics can be bad, exemplary or fascinating.
  • The statistic must be in the NZ media during the period of October 1-7 2011 inclusive.
  • Quote the statistic, when and where it was published and tell us why it should be our Stat of the Week.

Next Monday at midday we’ll announce the winner of this week’s Stat of the Week competition, and start a new one.

The fine print:

  • Judging will be conducted by the blog moderator in liaison with staff at the Department of Statistics, The University of Auckland.
  • The judges’ decision will be final.
  • The judges can decide not to award a prize if they do not believe a suitable statistic has been posted in the preceeding week.
  • Only the first nomination of any individual example of a statistic used in the NZ media will qualify for the competition.
  • Employees (other than student employees) of the Statistics department at the University of Auckland are not eligible to win.
  • The person posting the winning entry will receive a $20 iTunes voucher.
  • The blog moderator will contact the winner via their notified email address and advise the details of the $20 iTunes voucher to that same email address.
  • The competition will commence Monday 8 August 2011 and continue until cancellation is notified on the blog.

Noted for the record

One of the reasons statistics is difficult is the ‘availability heuristic’. That is, we estimate probabilities based on things we can remember, and it’s a lot easier to remember dramatic events than boring ones.  It’s not just that correlation doesn’t imply causation; our perception of correlation doesn’t even imply correlation.

To help with availability, I’d like to make two boring and predictable observations about recent events.

1.  This winter, despite the Icy Polar Blast™, was slightly warmer than the historical average, as forecast.

2. There wasn’t a major earthquake in ChCh in the last week of September, despite the position of the moon or the alignment of Uranus (or anything else round and irrelevant).

Stat of the Week Nominations: October 1-7 2011

If you’d like to comment on or debate any of this week’s Stat of the Week nominations, please do so below!

October 2, 2011

Watch out, England: Aussie RWC prediction

Today’s Sunday  Star-Times has a story on page 5 suggesting that England should brace themselves for grand-final defeat.

An Aussie-based New Zealand statistics expert, Stefan Yelas, research director at Beaton Research & Consulting, is backing the All Blacks to beat Argentina and the Springboks on their road to the world cup final, where, he says, they will hammer England by 23 points.

Read the full story here …

September 30, 2011

Infographic: Laundry by family member

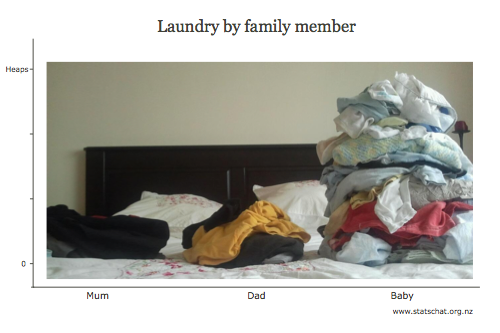
Data visualisation is difficult to do correctly, but this one just sort of fell out while I was sorting the family’s laundry:

Three stacks of laundry: Mum, Dad, Baby (gigantic)

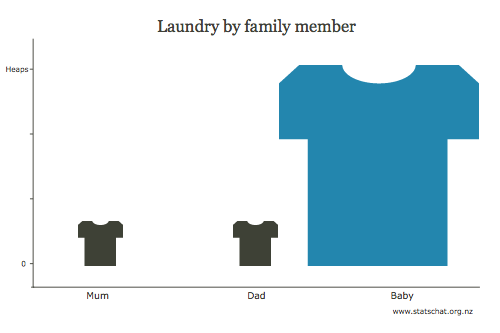
This sort of graphical representation is easy to do improperly, the most common offence being to scale on more than one axis, causing the area to confusingly increase at a much greater rate than the underlying data:

Three stacks of laundry, badly represented by a scaled picture

Here I demonstrate just one of many ways in which the graph can be manipulated to mislead the eye and thus the viewer.

Edward Tufte would still dislike my original graphic: there’s too much “chart junk” in the background. Move that pillow!

September 29, 2011

Will the All Blacks win the RWC? David Scott explains his predictions

In TV3 News on Tuesday, September 27, in a segment on predicting the 2011 Rugby World Cup, David Scott of the Department of Statistics at The University of Auckland gave a probability of 0.61 of the All Blacks winning the World Cup. Where did this come from?

He explains:

I did explain it a little more when talking to TV3 reporter Jane Luscombe, but essentially it was a quick and very dirty approximation to make the point that even if the All Blacks have a high probability of winning individual games, the chance of them actually winning the Cup can be disconcertingly low. Just that morning, the New Zealand Herald had reported that Graham Henry had won 84 out of 99 tests where he had coached the All Blacks, a success rate of 84.8%. To win the World Cup, the All Blacks must win three games in a row, and assuming independence that means a probability of 0.8483 = 0.61. If the probability of winning a game is as high as 90%, the probability of winning the Cup is still only 0.72, and if it is as low as 80%, then it is barely better than an even bet at 0.52.

There are reasons why the individual game probability should be higher than 84.8% and reasons why it should be lower. It should be lower because the 84/99 figure includes a lot of matches against lesser opposition than will be found in the finals of the World Cup, but higher because there is a home-ground advantage, particularly at Eden Park where the All Blacks have not lost since some time in the 1990s. If pressed I would probably say that the true probability is lower than 0.61, and may only be just above 0.5.

Tony Cooper’s calculations

Statistician Tony Cooper, of Auckland consultancy Double-Digit Numerics, has done an extensive analysis on his website.

Tony is even more downbeat on the chance of the All Blacks winning the World Cup, his probability being 0.478. He considers the likely opponents in each of the finals games and estimates the probabilities of winning the three games. First of all, he gives a rough calculation similar to mine above with probabilities of winning the three games to be 0.96, 0.58 and 0.70 giving a probability of 0.39 (All Blacks fans better prepare the sackcloth and ashes right now) …

I don’t think Tony is correct in some of his assumptions, however, and his determination of probabilities. Specifically he states:

“What about the home-game advantage? Should we increase the probability of New Zealand winning because they are playing at home? Probably. New Zealand has played better at home than away. But then you could argue that we should decrease the probability of New Zealand winning because they usually ‘choke’ at the Rubgy World Cup.

“It is difficult to asses these psychological changes in probabilities, so we remain more objective by ignoring them.”

I don’t think you can ignore the home-ground advantage. My analysis of the Super 15 and previous World Cups suggest a home ground advantage of 5 points. The same advantage appears to exist in the NRL.

My second criticism of Tony’s methodology is to question the relevance of some of his data. Yes, you can look at some thousands of past games, but surely most recent data is of more importance than data from 1987 or 1991? That is why I am a believer in exponential smoothing as a way of properly accounting for the relevance of the data.

Finally, there is the question of choking. There have been six Rugby World Cups so far, and New Zealand has won one. If the probability of winning is 0.478 then the All Blacks expect to win less than 3, compared to the 1 they have won, and the probability of winning one or less is still 0.131. If they win this year that will be 2 out of 7 with a p-value of 0.264. If they don’t win this year then the p-value will drop to 0.078. If the probability of winning a World Cup is 0.61, however, then the p-value given the current success rate of 1 out of 6 is only 0.037 which would provide evidence of inferior performance at World Cups.

At this time, I don’t think it is unreasonable to say that there is scant evidence that the All Blacks choke at World Cups: all we are seeing is the playing out of sensible probability calculations.

An alternative approach

My approach would be the one espoused by Stephen Clarke who is responsible for the method I have used for predicting results. Use the predicted game margins to estimate the probabilities of each team winning individual games. Use these probabilities to simulate the course of the Cup and the eventual winner, and determine the probability of winning by the proportion of wins over a large number of simulations.

The final word

The person on the street might be tempted to think this is a statistical version of the old joke about accountants. The dodgy accountant, when asked what is 1 plus 1, replies “What would you like it to be?” However, Tony and I agree on one thing: even if the All Blacks are the best team in the world and have high probabilities of beating other teams, the probability of them winning the World Cup is actually quite low.


Faster-than-light neutrinos.

So. It turns out that there is a statistical angle to the recent report of neutrinos travelling faster than light, since it’s the assessment of uncertainty in the travel time and distance that is really at issue.  For a nice summary of the measurement issues from a card-carrying physicist and popular science writer, see Chad Orzel’s blog.