March 15, 2026

Survey framing

From an admittedly bogus poll of my followers on Mastodon

The correct answer is “none of the above”. The most appropriate common name is probably “avocado”

It looks like most respondents didn’t know what Persea americana is, but assumed the question was about some actual controversy such as the appropriate name for Actinidia deliciosa cultivars  — ‘kiwifruit’, but often called ‘kiwi’ in the US. This is frivolous, but it’s similar in many ways to putatively serious survey questions such as “bombing Agrabah” or asking about Harambe as a presidential candidate in 2016.

March 10, 2026

AFL Predictions for Week 2

Team Ratings for Week 2

The basic method is described on my Department home page.
Here are the team ratings prior to this week’s games, along with the ratings at the start of the season.

Current Rating Rating at Season Start Difference
Western Bulldogs 27.32 26.06 1.30
Brisbane Lions 24.94 26.20 -1.30
Geelong Cats 22.24 26.75 -4.50
Hawthorn Hawks 20.61 22.83 -2.20
Adelaide Crows 15.32 15.32 0.00
Gold Coast Suns 14.74 10.24 4.50
GWS Giants 11.77 9.54 2.20
Collingwood 11.09 11.76 -0.70
Fremantle Dockers 6.56 6.56 0.00
Sydney Swans 4.02 0.56 3.50
Melbourne Demons 1.64 1.64 0.00
St Kilda Saints -6.96 -7.63 0.70
Carlton Blues -8.23 -4.77 -3.50
Port Adelaide Power -14.65 -14.65 -0.00
North Melbourne -21.71 -21.71 0.00
Essendon Bombers -27.89 -27.89 0.00
Richmond Tigers -29.44 -29.44 -0.00
West Coast Eagles -39.36 -39.36 -0.00

Performance So Far

So far there have been 5 matches played, 2 of which were correctly predicted, a success rate of 40%.
Here are the predictions for last week’s games.

Game Date Score Prediction Correct
1 Sydney Swans vs. Carlton Blues Mar 05 132 – 69 16.30 TRUE
2 Gold Coast Suns vs. Geelong Cats Mar 06 125 – 69 -5.50 FALSE
3 GWS Giants vs. Hawthorn Hawks Mar 07 122 – 95 -2.30 FALSE
4 Brisbane Lions vs. Western Bulldogs Mar 07 106 – 111 11.10 FALSE
5 St Kilda Saints vs. Collingwood Mar 08 66 – 78 -19.40 TRUE

Predictions for Week 2

Here are the predictions for Week 2. The prediction is my estimated expected points difference with a positive margin being a win to the home team, and a negative margin a win to the away team.

Game Date Winner Prediction
1 Carlton Blues vs. Richmond Tigers Mar 12 Carlton Blues 21.20
2 Essendon Bombers vs. Hawthorn Hawks Mar 13 Hawthorn Hawks -48.50
3 Western Bulldogs vs. GWS Giants Mar 14 Western Bulldogs 26.60
4 Geelong Cats vs. Fremantle Dockers Mar 14 Geelong Cats 26.70
5 Sydney Swans vs. Brisbane Lions Mar 14 Brisbane Lions -9.90
6 Collingwood vs. Adelaide Crows Mar 14 Collingwood 6.80
7 North Melbourne vs. Port Adelaide Power Mar 15 North Melbourne 3.90
8 Melbourne Demons vs. St Kilda Saints Mar 15 Melbourne Demons 8.60
9 Gold Coast Suns vs. West Coast Eagles Mar 15 Gold Coast Suns 65.10

Super Rugby Predictions for Week 5

Team Ratings for Week 5

The basic method is described on my Department home page.
Here are the team ratings prior to this week’s games, along with the ratings at the start of the season.

Current Rating Rating at Season Start Difference
Chiefs 11.87 12.36 -0.50
Hurricanes 9.44 8.29 1.10
Blues 8.89 8.91 -0.00
Crusaders 7.26 8.41 -1.20
Brumbies 7.04 5.59 1.50
Reds 1.82 1.74 0.10
Highlanders -2.72 -3.06 0.30
Waratahs -5.37 -5.84 0.50
Western Force -6.39 -6.29 -0.10
Fijian Drua -8.18 -7.64 -0.50
Moana Pasifika -9.08 -7.88 -1.20


Performance So Far

So far there have been 20 matches played, 11 of which were correctly predicted, a success rate of 55%.
Here are the predictions for last week’s games.

Game Date Score Prediction Correct
1 Chiefs vs. Moana Pasifika Mar 06 57 – 24 25.20 TRUE
2 Waratahs vs. Hurricanes Mar 06 19 – 59 -9.10 TRUE
3 Highlanders vs. Western Force Mar 07 39 – 31 7.00 TRUE
4 Blues vs. Crusaders Mar 07 29 – 13 5.70 TRUE
5 Brumbies vs. Reds Mar 07 31 – 34 11.40 FALSE


Predictions for Week 5

Here are the predictions for Week 5. The prediction is my estimated expected points difference with a positive margin being a win to the home team, and a negative margin a win to the away team.

Game Date Winner Prediction
1 Hurricanes vs. Western Force Mar 13 Hurricanes 19.30
2 Fijian Drua vs. Brumbies Mar 14 Brumbies -10.20
3 Crusaders vs. Highlanders Mar 14 Crusaders 15.00
4 Reds vs. Waratahs Mar 14 Reds 12.20
5 Blues vs. Moana Pasifika Mar 15 Blues 23.00


NRL Predictions for Round 2

Team Ratings for Round 2

The basic method is described on my Department home page.
Here are the team ratings prior to this week’s games, along with the ratings at the start of the season.

Current Rating Rating at Season Start Difference
Panthers 10.66 8.77 1.90
Storm 9.31 6.96 2.40
Sharks 8.69 7.25 1.40
Roosters 7.49 9.50 -2.00
Broncos 5.17 7.06 -1.90
Raiders 2.01 1.62 0.40
Bulldogs 1.26 2.13 -0.90
Warriors 0.84 -1.18 2.00
Dolphins 0.39 1.85 -1.50
Sea Eagles -0.18 0.21 -0.40
Eels -2.72 -0.37 -2.30
Rabbitohs -3.60 -5.05 1.50
Cowboys -4.17 -2.69 -1.50
Dragons -5.85 -6.72 0.90
Wests Tigers -7.26 -7.26 -0.00
Titans -9.47 -8.02 -1.50
Knights -12.57 -14.06 1.50


Performance So Far

So far there have been 8 matches played, 3 of which were correctly predicted, a success rate of 37.5%.
Here are the predictions for last week’s games.

Game Date Score Prediction Correct
1 Knights vs. Cowboys Mar 01 28 – 18 -11.40 FALSE
2 Bulldogs vs. Dragons Mar 01 15 – 14 8.80 TRUE
3 Storm vs. Eels Mar 05 52 – 4 11.30 TRUE
4 Warriors vs. Roosters Mar 06 42 – 18 -6.70 FALSE
5 Broncos vs. Panthers Mar 06 0 – 26 2.30 FALSE
6 Sharks vs. Titans Mar 07 50 – 10 19.30 TRUE
7 Sea Eagles vs. Raiders Mar 07 28 – 29 2.60 FALSE
8 Dolphins vs. Rabbitohs Mar 08 30 – 40 10.90 FALSE


Predictions for Round 2

Here are the predictions for Round 2. The prediction is my estimated expected points difference with a positive margin being a win to the home team, and a negative margin a win to the away team.

Game Date Winner Prediction
1 Broncos vs. Eels Mar 12 Broncos 11.90
2 Warriors vs. Raiders Mar 13 Warriors 2.80
3 Roosters vs. Rabbitohs Mar 13 Roosters 15.10
4 Wests Tigers vs. Cowboys Mar 14 Wests Tigers 0.90
5 Dragons vs. Storm Mar 14 Storm -11.20
6 Panthers vs. Sharks Mar 14 Panthers 6.00
7 Sea Eagles vs. Knights Mar 15 Sea Eagles 16.40
8 Dolphins vs. Titans Mar 15 Dolphins 13.90


March 8, 2026

Briefly

  • From BBC Somerset: “Rare coincidence as three cousins born on same day“. Two sisters-in-law gave birth on the same day, one to identical twins. One of the hospitals notes that identical twins are about 1 in 250 pregnancies. It’s going to be uncommon for two closely-linked women to give birth to three kids on the same day. The chance increases as you consider non-identical twins and more relationships — primary-school BFF, college flatmate, next-door neighbour, sky-diving partner, whatever.  Given that the UK has over half-a-millon births per year, this has got to be a thing that regularly happens.  It’s still rare enough to properly be a big deal to the families involved, and BBC Somerset aren’t overselling it too much.
  • From a BBC news item about electricity theft (and the risks involved)

    The clear increase shown in the graph is a bit undermined by “Crimestoppers estimates that a further 250,000 cases go unreported every year”. If 95% of cases are unreported, there’s no hope for estimating trends from the 5% of reported cases — we can’t possibly distinguish trends in reporting from trends in the true rate.  Long-time StatsChat readers will remember me saying this about everything from skin cancer to domestic violence.
  • Weight-loss jab could be made for $3 a month, study finds (Guardian).  This is plausibly true and I’m not going to argue that pharmaceutical prices are where they should be. However, as with The Guardian itself, the price of one additional copy of the the finished product is not the main determiner of the price, nor should it be.
  • CNN: Here’s how much the war with Iran is expected to cost every day. The answer they give is nearly US$1 billion per day. That’s a lot, but the US is a big country: it’s about three times the US daily spend on coffee and a bit less than the cost of car insurance.  More importantly, it’s not the cost of the war. It’s  not even the cost of the war to the USA as ABC News and Al Jazeera frame the same number. It’s only the cost of the munitions used by the USA.  The cost of the war, under any attempt at reasonable accounting, is far higher.
March 6, 2026

Over-averaging

The Guardian reports “Gen Z males twice as likely as baby boomers to believe wives should obey husbands”, with similar phrasing in headlines from the Daily Mail, and the NY Post, and in the lede from the BBC. This has, unsurprisingly, caused a bit of concern.

Looking at the original information from King’s College London (research for International Women’s Day†) the trend seems to go over all ages

This seems strange. I would not have thought women’s equality had been getting steadily worse for the past eighty years. Do we just have a bad question, or a bad sample, or what? The page at King’s College shows broadly similar patterns for other gender attitude questions, though often less extreme. It’s not just the question but it might be partly the question.  In particular, there might be a carryover from ‘obey’ in wedding vows, which is not quite the same. However, “A husband should have the final word on important decisions made in his home” gets very similar answers to the “obey” question.

Here’s the worldwide comparison for the ‘obey’ question:

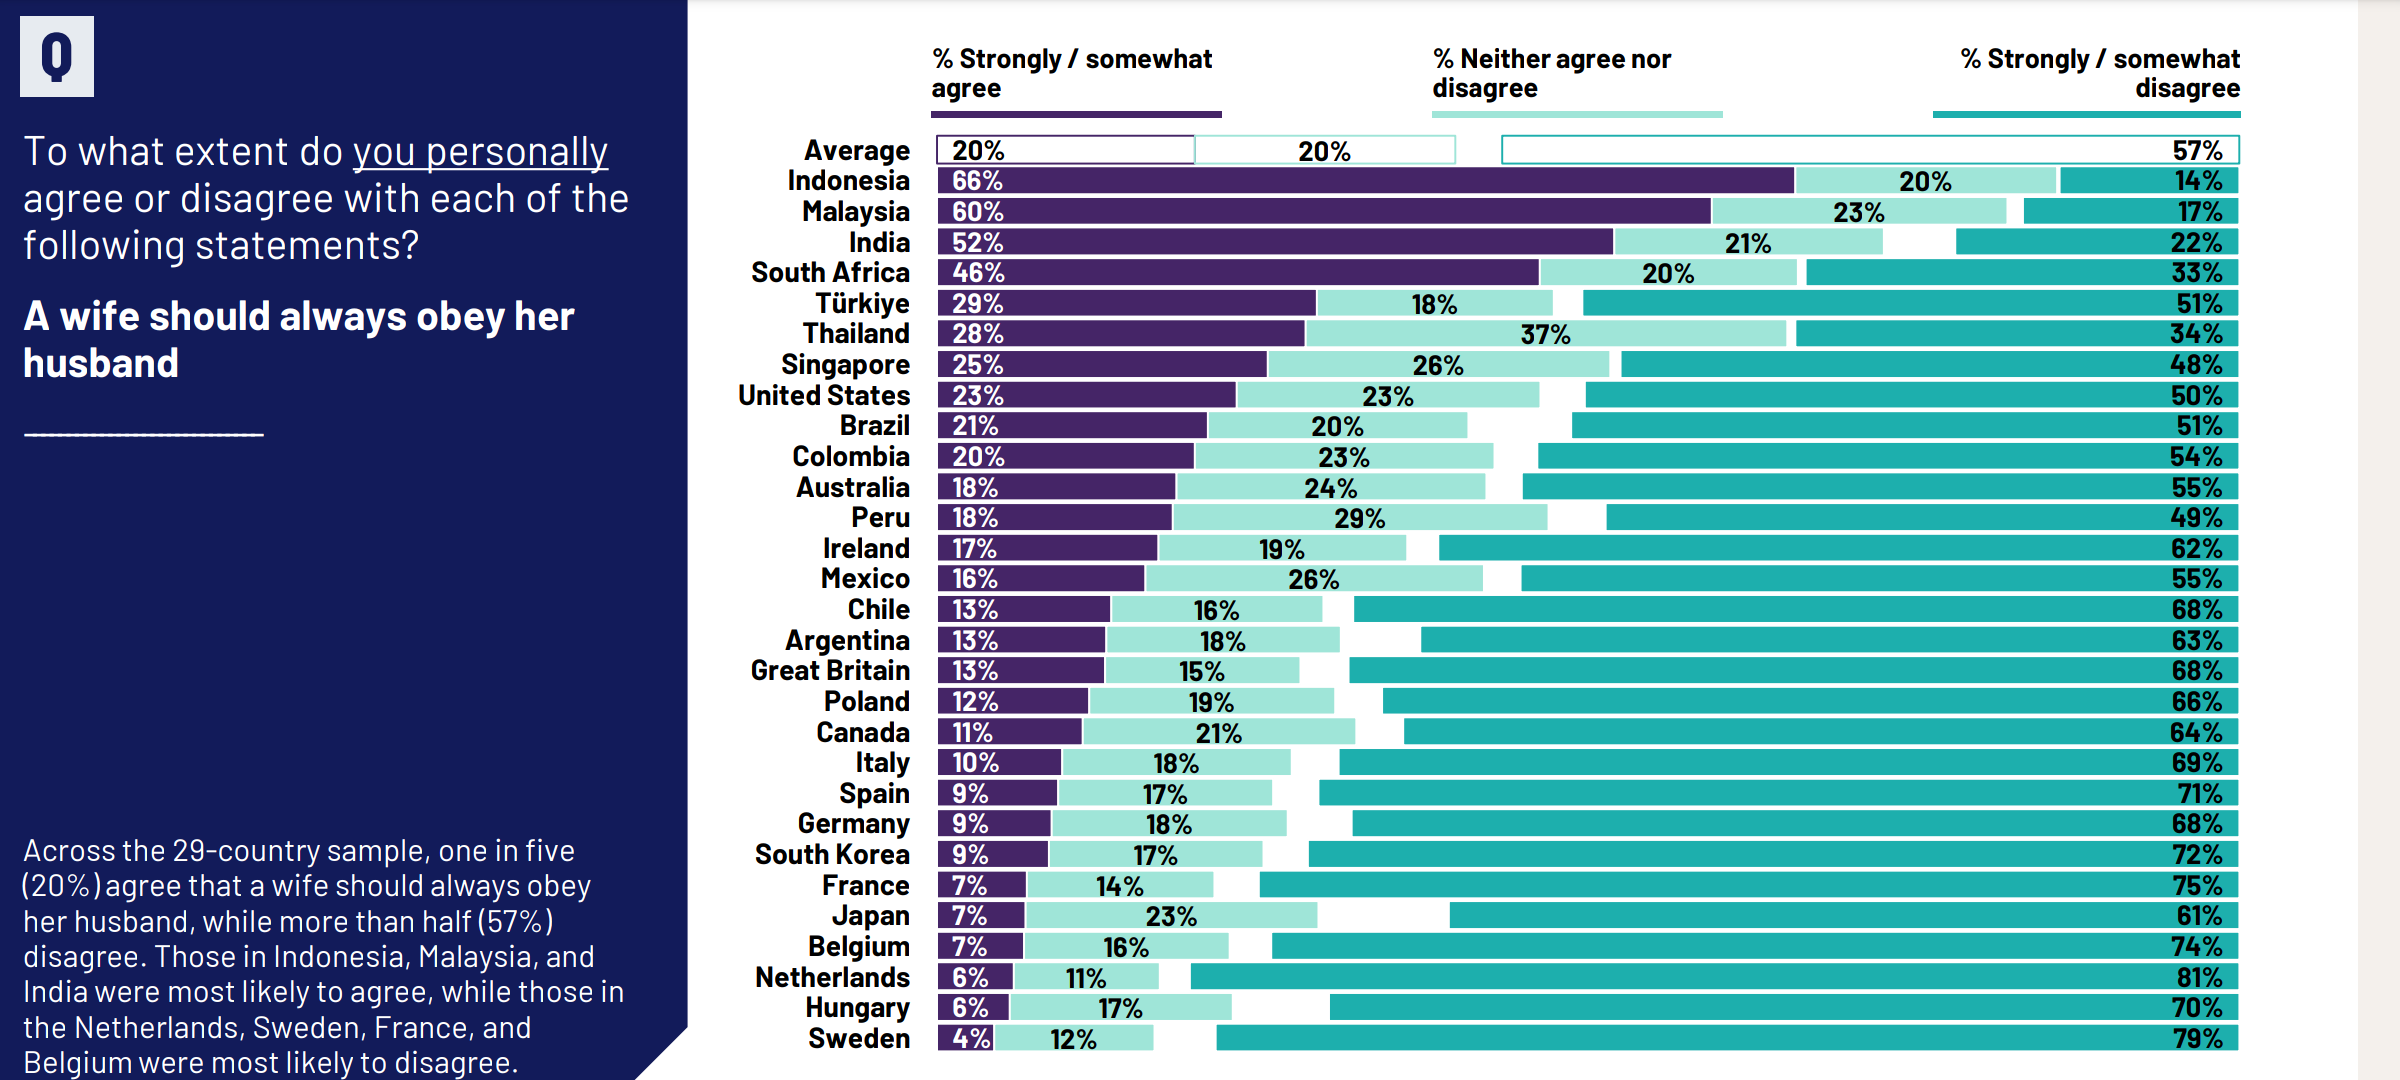
There’s a huge amount of variation between countries, so the results will be sensitive to how countries are combined.  Honest and competent researchers will give you this sort of information, and there is a full PDF report actually linked from the King’s College page, near the top!  It has a Technical Note on the last page that says in part

The data is weighted so that the composition of each country’s sample best reflects the demographic profile of the adult population according to the most recent census data. “The Global Country Average” reflects the average result for all the countries and markets in which the survey was conducted. It has not been adjusted to the population size of each country or market and is not intended to suggest a total result. [emphasis added]

It would be interesting to see separate trends for countries and regions, rather than suggesting a total result, when the responses from different countries are so different.


† Yes, there is. November 19.

March 5, 2026

March madness

Newsroom has a long piece on traffic congestion in Auckland in March. Near the beginning, Douglas Wilson, from the Transport Research Centre at the Uni of Auckland says

“So suddenly people say, ‘Wow, it’s taking me double the travel time to get to work. Why is that the case?’ It’s not that you’ve doubled the traffic volume. Actually, the volume has only gone up a little, proportionally, but the traffic flow has reached capacity.”

This is one of the Two Simple Facts from queueing theory, the branch of applied probability that deals with congestion in networks. These networks can be physical road networks or electronic data networks or something like a system of medical waiting lists, or something as simple as a literal queue, and what they all have in common is waiting for other users.

Queueing theory can lead to very complicated simulations and theoretical approximations, but parts of it are simple. My Two Simple Facts are

  1. When you have multiple servers you should still try to have a single queue
  2. A queueing system has a “capacity” and when it gets near that capacity small changes make things much worse

Most of the time, Auckland’s traffic system works reasonably well. There’s enough wiggle room for traffic to catch up around the inevitable slowdows.  When you get a big crash on the motorway or heavy rain or extra drivers, though, the whole system suddenly gets much slower. In the other direction, removing drivers after Christmas opens up the city out of all proportion to the number who leave.

Sudden slowdowns near full capacity are a pretty general property of queueing systems. We can look at them in a nice simple example — this sort of mathematical model is very useful both for understanding the general vibes and for developing theoretical tools.

(more…)

AFL Predictions for Week 1

Team Ratings for Week 1

The basic method is described on my Department home page.
Here are the team ratings prior to this week’s games, along with the ratings at the start of the season.

Current Rating Rating at Season Start Difference
Geelong Cats 26.75 26.75 0.00
Brisbane Lions 26.20 26.20 0.00
Western Bulldogs 26.06 26.06 0.00
Hawthorn Hawks 22.83 22.83 -0.00
Adelaide Crows 15.32 15.32 0.00
Collingwood 11.76 11.76 0.00
Gold Coast Suns 10.24 10.24 0.00
GWS Giants 9.54 9.54 -0.00
Fremantle Dockers 6.56 6.56 0.00
Melbourne Demons 1.64 1.64 0.00
Sydney Swans 0.56 0.56 0.00
Carlton Blues -4.77 -4.77 -0.00
St Kilda Saints -7.63 -7.63 -0.00
Port Adelaide Power -14.65 -14.65 -0.00
North Melbourne -21.71 -21.71 0.00
Essendon Bombers -27.89 -27.89 0.00
Richmond Tigers -29.44 -29.44 -0.00
West Coast Eagles -39.36 -39.36 -0.00


Predictions for Week 1

Here are the predictions for Week 1. The prediction is my estimated expected points difference with a positive margin being a win to the home team, and a negative margin a win to the away team.

Game Date Winner Prediction
1 Sydney Swans vs. Carlton Blues Mar 05 Sydney Swans 16.30
2 Gold Coast Suns vs. Geelong Cats Mar 06 Geelong Cats -5.50
3 GWS Giants vs. Hawthorn Hawks Mar 07 Hawthorn Hawks -2.30
4 Brisbane Lions vs. Western Bulldogs Mar 07 Brisbane Lions 11.10
5 St Kilda Saints vs. Collingwood Mar 08 Collingwood -19.40


March 3, 2026

Top 14 Predictions for Round 18

Team Ratings for Round 18

Not sure how I missed posting this one, but here it is for completeness.

The basic method is described on my Department home page.
Here are the team ratings prior to this week’s games, along with the ratings at the start of the season.

Current Rating Rating at Season Start Difference
Stade Toulousain 14.20 11.56 2.60
Bordeaux Begles 5.70 4.78 0.90
Montpellier 4.13 -0.21 4.30
Clermont 3.69 1.88 1.80
Section Paloise 2.97 2.21 0.80
Stade Rochelais 2.19 1.22 1.00
Stade Francais 1.55 -2.17 3.70
Lyon 1.09 -0.45 1.50
Racing 92 0.92 1.88 -1.00
Toulon 0.18 3.49 -3.30
Castres Olympique -0.09 0.59 -0.70
Bayonne -2.01 1.48 -3.50
USA Perpignan -4.63 -3.37 -1.30
Montauban -17.01 -10.00 -7.00

Performance So Far

So far there have been 119 matches played, 94 of which were correctly predicted, a success rate of 79%.
Here are the predictions for last week’s games.

Game Date Score Prediction Correct
1 Bordeaux Begles vs. Castres Olympique Feb 15 57 – 32 11.30 TRUE
2 Bayonne vs. Racing 92 Feb 15 36 – 41 4.30 FALSE
3 Lyon vs. Montauban Feb 15 73 – 12 22.40 TRUE
4 Stade Rochelais vs. Montpellier Feb 15 33 – 43 5.60 FALSE
5 USA Perpignan vs. Section Paloise Feb 15 40 – 24 -2.30 FALSE
6 Toulon vs. Clermont Feb 15 14 – 34 4.50 FALSE
7 Stade Francais vs. Stade Toulousain Feb 16 9 – 13 -6.40 TRUE

Predictions for Round 18

Here are the predictions for Round 18. The prediction is my estimated expected points difference with a positive margin being a win to the home team, and a negative margin a win to the away team.

Game Date Winner Prediction
1 Castres Olympique vs. Stade Rochelais Mar 01 Castres Olympique 4.20
2 Clermont vs. Bayonne Mar 01 Clermont 12.20
3 Lyon vs. Toulon Mar 01 Lyon 7.40
4 Montpellier vs. Racing 92 Mar 01 Montpellier 9.70
5 Stade Francais vs. USA Perpignan Mar 01 Stade Francais 12.70
6 Stade Toulousain vs. Montauban Mar 01 Stade Toulousain 37.70
7 Section Paloise vs. Bordeaux Begles Mar 02 Section Paloise 3.80

United Rugby Championship Predictions for Delayed Games

Team Ratings for Delayed Games

The basic method is described on my Department home page.
Here are the team ratings prior to this week’s games, along with the ratings at the start of the season.

Current Rating Rating at Season Start Difference
Leinster 9.16 13.41 -4.20
Bulls 8.56 8.86 -0.30
Glasgow 7.63 6.18 1.40
Stormers 5.72 4.17 1.60
Munster 1.90 3.65 -1.80
Edinburgh 1.22 2.67 -1.50
Lions 0.76 -1.19 2.00
Ulster 0.61 -3.24 3.80
Sharks -1.06 1.29 -2.30
Connacht -1.19 -1.39 0.20
Scarlets -1.82 -0.54 -1.30
Cardiff Rugby -2.00 -2.74 0.70
Ospreys -2.46 -2.15 -0.30
Benetton -4.94 -2.32 -2.60
Dragons -10.01 -15.66 5.60
Zebre -12.09 -11.02 -1.10


Performance So Far

So far there have been 93 matches played, 61 of which were correctly predicted, a success rate of 65.6%.
Here are the predictions for last week’s games.

Game Date Score Prediction Correct
1 Cardiff Rugby vs. Leinster Feb 28 8 – 7 -5.60 FALSE
2 Edinburgh vs. Scarlets Feb 28 24 – 19 11.50 TRUE
3 Lions vs. Stormers Mar 01 24 – 10 -5.00 FALSE
4 Bulls vs. Sharks Mar 01 41 – 12 9.60 TRUE
5 Connacht vs. Glasgow Mar 01 15 – 10 -2.90 FALSE
6 Dragons vs. Benetton Mar 01 15 – 15 2.50 FALSE
7 Munster vs. Zebre Mar 01 21 – 7 22.00 TRUE
8 Ospreys vs. Ulster Mar 01 21 – 10 2.90 TRUE


Predictions for Delayed Games

Here are the predictions for Delayed Games. The prediction is my estimated expected points difference with a positive margin being a win to the home team, and a negative margin a win to the away team.

Game Date Winner Prediction
1 Edinburgh vs. Ulster Mar 14 Edinburgh 7.60
2 Connacht vs. Scarlets Mar 14 Connacht 7.60
3 Bulls vs. Stormers Mar 15 Bulls 4.80